Publisher’s version / Version de l'éditeur:
Journal of Fire Sciences, 10, 1, pp. 58-71, 1992
READ THESE TERMS AND CONDITIONS CAREFULLY BEFORE USING THIS WEBSITE. https://nrc-publications.canada.ca/eng/copyright
Vous avez des questions? Nous pouvons vous aider. Pour communiquer directement avec un auteur, consultez la
première page de la revue dans laquelle son article a été publié afin de trouver ses coordonnées. Si vous n’arrivez pas à les repérer, communiquez avec nous à [email protected].
Questions? Contact the NRC Publications Archive team at
[email protected]. If you wish to email the authors directly, please see the first page of the publication for their contact information.
NRC Publications Archive
Archives des publications du CNRC
This publication could be one of several versions: author’s original, accepted manuscript or the publisher’s version. / La version de cette publication peut être l’une des suivantes : la version prépublication de l’auteur, la version acceptée du manuscrit ou la version de l’éditeur.
Access and use of this website and the material on it are subject to the Terms and Conditions set forth at
Air quality problems inside a house following a fire
Tsuchiya, Y.
https://publications-cnrc.canada.ca/fra/droits
L’accès à ce site Web et l’utilisation de son contenu sont assujettis aux conditions présentées dans le site
LISEZ CES CONDITIONS ATTENTIVEMENT AVANT D’UTILISER CE SITE WEB.
NRC Publications Record / Notice d'Archives des publications de CNRC:
https://nrc-publications.canada.ca/eng/view/object/?id=d8ba6dd6-071e-4c2a-8e0b-b10f09fa5132 https://publications-cnrc.canada.ca/fra/voir/objet/?id=d8ba6dd6-071e-4c2a-8e0b-b10f09fa5132Air quality problems inside a
house following a fire
Tsuchiya, Y.
NRCC33970
A version of this document is published in:
Journal of Fire Sciences, 10, (1), pp. 58-71, 92
The material in this document is covered by the provisions of the Copyright Act, by Canadian laws, policies, regulations and international agreements. Such provisions serve to identify the information source and, in specific instances, to prohibit reproduction of materials without
written permission. For more information visit http://laws.justice.gc.ca/en/showtdm/cs/C-42
Les renseignements dans ce document sont protégés par la Loi sur le droit d’auteur, par les lois, les politiques et les règlements du Canada et des accords internationaux. Ces dispositions permettent d’identifier la source de l’information et, dans certains cas, d’interdire la
Air Quality Problems Inside a
House Following a Fire
YOSHIO TSUCHIYA
Institute for Research in Construction National Research Council of Canada Building M-59, Montreal Road Ottawa, Ontario
Canada KlA OR6
ABSTRACT: Fire-damaged houses are often refurbished for further use. In
some cases occupants complain about odours from the fire in the refurbished houses. Experimental box fires and a field study of refurbished houses were un-dertaken to investigate the problem. Concentrations of combustion products from fires in the experimental box were measured for up to 30 days afterwards and the decay of concentrations of the combustion products was calculated. The decay was faster in humid conditions than in dry conditions. There was a cor-relation between the boiling point of compounds and the decay constant. Some compounds remained in higher-than:normal concentrations for several hun-dred or several thousand days. Field studies of refurbished houses showed re-sults consistent with the experimental study.
KEY WORDS: refurbished house, combustion products, decay, odours, field
study, humidity, GC/MS.
INTRODUCTION
THERE WERE 70,624 unwanted fires in Canada in 1988, of which 31,752 were residential fires. The monetary loss from residential fires was $442 million [1], an average of $13,900 per house. When damage is mi-nor to medium, houses are refurbished for continued use. The Institute for Research in Construction, National Research Council of Canada re-ceived several inquiries from residents of refurbished houses regarding odours and ill-health suspected to be due to the presence of combustion 58 JoURNAL OF FIRE SCIENCES, VOL. 10-JANUARY/FEBRUARY 1992
0734-9041/92/01 0058-14 $06.00/0 © 1992 Technomic Publishing Co., Inc.
Air Quality Problems Inside a House Following a Fire
products. One house was treated with odour-control chemicals by a con-tractor before refurbishing. In this case improper application of the chemicals, causing decomposition or interaction with combustion prod-ucts, was suspected in the subsequent ill-health of the residents.
Little information is available on odour problems in houses after a fire, methods of odour control, compositions of chemicals used for the odour control and their reaction to combustion products. This paper summarizes information collected from the literatw·e, a laboratory study, and a field study of refurbished houses after a fire.
EXPERIMENTAL Fire Experiments
Three experiments were conducted in a 1.73 mJ cubical box con-structed of mineral fibre/ceme11t boards (12 mm thick, density 0.85 g/ml) without surface treatment. In the first experiment, a crib of nom-inal 50 mm square white pine studs (total weight 10 kg) was ignited with a torch. Air for the combustion was supplied by natw·al convection through an opening (0.38 x 1.02 .m) made in the wall. When about half the wood was consumed, the fu·e was smothered by closing the opening. After the box cooled, humid air (50% relative humidity at 22 °C) gener-ated from a commercially available humidity controller was supplied through a hose attached to one wall and exhausted through an opening on the opposite wall at a rate of 0.233 Lisee (0.5 air change/hour). In the second experiment, using a similar crib, the same procedure was fol-lowed except that dry air was supplied. In the third experiment, mixed fuel (wood, PVC, polymethyl methacrylate, polystyrene in approxi-mately 2.5 kg each) was bw·ned and 50% RH air was supplied. Analysis of Air
A known volume of the exhaust air from the box was periodically sampled for up to 30 days through sorption tubes by suction from a small mechanical pump. These were commercially available, 3-layer (glass beads!fenax-Ambersorb) sorption tubes. Volatile organic com-pounds (VOC) in the air were collected and concentrated in the tube. Volumes of the sampled air varied from 100 mL to 10 L depending on the expected concentrations of the VOC. The absorbed organic com· pounds were thermally released using an Envirochem Unacon Model 810 desorption unit under a helium flow. Two 4% splits of the flow went
60 YOSHIO tsu セャャャ ya@
• into a flame ionization detector (FID) for monitoring purpose at dif-ferent times. The latter of the two was used for quantification of the total volatile organic compounds (TVOC). The remaining 92% flow was introduced into the gas chromatograph separation column of a Hewlett Packard Model 5995 gas chromatograph/mass spectrometer (GC/MS). The column was a methyl-silicone bonded phase glass capillary, 25 m
x
0.2 mm i.d. The desorbed compounds were cryofocused on the begin-ning of the GC column at -50°C. The oven temperature was pro-grammed from - 50°C to 250°C at an increasing rate of l0°C/min for GC separation. Inorganic compounds were not measured.Major components in the GC effluent were identified by the MS using a spectra library and search program supplied by the manufacturer of the instrument. All the identifications were confirmed by comparing the sample spectra and the reference spectra. To measure concentra-tions of organic compound in sample gases, the response factor of the FID, fin count//<g, was determined using known volumes of cylindered cyclohexane/helium mixture (Matheson certified standard 607 ppm cyclohexane) as:
(1)
where
cs = FID count for a known volume of standard cyclohexane/helium Vs
=
volume of the standard cyclohexanelhelium in m3Cs
=
concentration of the standard cyclohexane/helium in i<glm3The TVOC, T in l<g/m3
, was then calculated as:
T
=
c/f!V (2)where
c
=
FID count for an air sampleV
=
volume of the air sample taken into the tube in m3Concentration of an organic component is then
セᆳ セセ@ エセセZ@ " tr r.;_·
セ[@ Air Quality Problems Inside a House Following a Fire
セᄋG@
61
セᄋ@ where
セMN@
A = total area under peaks in the chromatogram in ion count of MS
A = area under a peak of interest in ion count of MS
C = concentration of the interested component in f-tg/m' Field Study
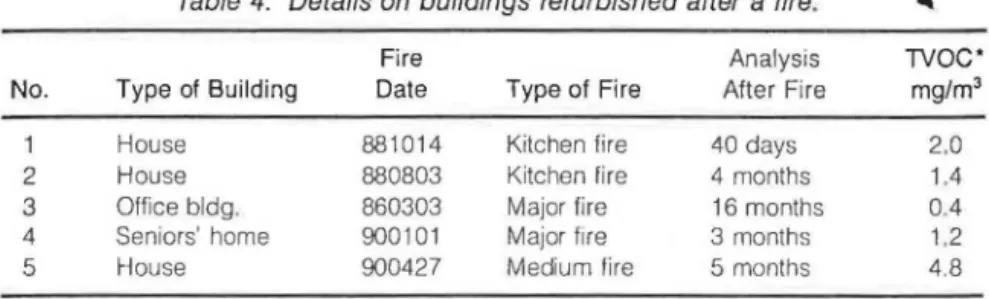
Five refurbished buildings-three houses, a senior citizens' home and an office building-were visited and room air was sampled using the same type of sorption tubes. These buildings had been cleaned and re-furbished after a fire and were occupied. The collected samples were analyzed in the laboratory using the procedure described above.
RESULTS AND DISCUSSION Experimental Box Fires
Concentrations of organic components in the air in the box decayed with time. Measured concentrations and days after the fire were sub-jected to a regression analysis. The following equation had the best linear correlation: '
log C = log Co - a x log d (4)
where Cis the concentration in v/v of an organic component measured on days, d, after the fire and Co is the initial (24 hours after fire) concen-tration. The consta nt, a, is the decay constant.
Identified compounds, their regression constants and correlation ,.ac-tors, r, are shown in Tables l{a-c) in the order of their boiling points. In the 50% RH air experiments, the logarithm of concentration corre-lated well with the logarithm of days after the fire according to Equa-tion (4). In the dry air experiment on wood, however, the results were more erratic and the decay was slower than in the 50% RH experiment by a factor of 2.5 in terms of the averaged decay constant.
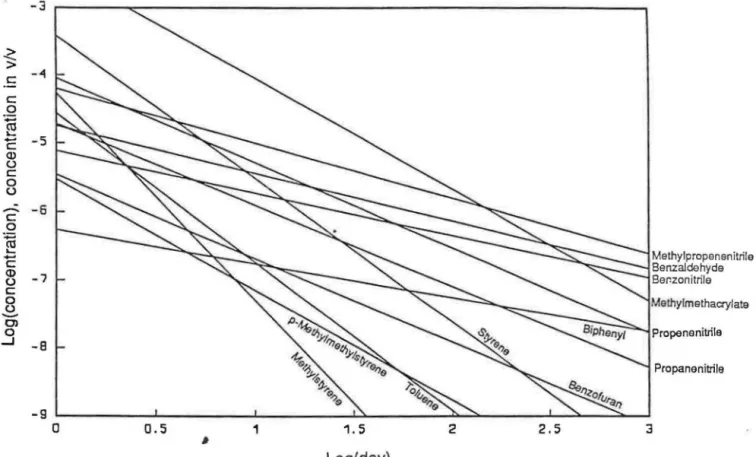
The decays of various compounds in Equation (4) are plotted in Fig-ure 1 for the wood burn and in FigFig-ure 2 for the mixed fuel burn, both in the 50% RH experiments. The experimental data, measured up to 30 days [log (day) = 1.5], were extrapolated to log (day)
=
3.Table 1(a). Decay of combustion products in experimental fires . Wo od burn, decay in 50 % RH air.
Regression Correlation Constants Factor Compound bp
oc
Mol. wt. a Log CoFuran 31 . 68.1 1.191 -4.578 -0.945 Methyl luran 63.2 82 .1 1.349 -4.112 -0.957 Methylethylketone 79 .6 72 .1 2.803 -3.345 -0.998 Meth ylisopropylketone 95. 86.1 2.456 -3.878 -0.966 Toluene 110.6 92.1 1.053 -4.440 -0.957 Hexanal 13 1. 100.2 1.211 -3.801 -0.943 Pinene 155. 136.2 0.939 -3.601 -0967 Camphene 159. 136.2 0.670 -4.092 -0.936 Furfural 161.7 96.1 1.743 -3 .557 -0.977 Limon ene 178. 136.2 0.940 -3.787 -0.959 Methylfurfural 186. 110.1 0.906 -5 .179 -0 947
Table 1(b). Decay of combustion products in experimental fires . Mixed fuel burn, decay in 50 % RH air.
Regression Correlation Constants Factor Compound bp °C Mol. wt. a Log Co r Propenenitrile 77.3 53.1 1.245 -4 .040 -0.804 Benzene 80.1 78.1 2.289 -4.270 -0.951 Propanenitrile 97.2 55.1 1.191 -4.717 -0.903 Methylmethacrylate 101 . 100.1 1.632 -2.410 -0.976 Toluene 110.6 92.1 2 .178 -4.567 MP N YVセ@ Methylpropenenitrile 122.4 67.1 0.804 -4.202 -0.844 Styrene 145.2 104.2 2.101 -3.420 -0.962 Pinene 155. 136 .2 1.069 -4.248 -0.977 Camphene 159. 136.2 0.914 -4.949 -0.944 Methylstyrene 165.4 118.2 3.038 -4.266 -0.923 Benzofuran 174 118.1 1.227 -5.462 -0.933 Limonene 178. 136.2 0.945 -4.911 -0.961 Benzaldehyde 179.1 106.1 0.692 -4.752 -0.917 lndene 181 .8 116.1 1.064 -5,092 -0.941 Benzonitrile 191 .1 103.1 0.620 -5.111 -0.885 Naphthalene 218 .0 128.2 1 '168 -4 .177 -0.943 Biphenyl 256.1 154 2 0.499 -6.257 -0.855
62
Air Quality Problems Inside a House Following a Fire 63
Table 1(c). Decay of combustion products in experimental fires. Wood burn, decay in dry air.
Regression Correlation Constants Factor Compound bp °C Mol. wt. a Log Co r
Hexanal 131. 100.2 0.261 -4.880 -0.391
Pinene 155. 136.2 0.489 -4.410 -0.624
Camphene 159. 136.2 0.350 -4 .512 -0.580 Furiural 161.7 96.1 0.193 -5 .625 -0.544 Limonene 178. 136.2 0.341 -4.668 -0.601
house. In a study of indoor air quality of residential houses (not fire houses), occurrence and average concentrations of various organic com-pounds were reported [2). Comcom-pounds common to the present sLudy are listed in Table 2. The calculated number of days re.quired for the con-centration of these common compounds in the air of the box fires to de-cay to their average level in residential houses is also shown. High boil-ing point compounds such as styrene and naphthalene will take several hundred or several thousand days to decay to the average concentra-tion.
Values of the decay constant are plotted against boiling points in Figure 3. For three groups of compounds, 1) styrene and methyl sty-rene, 2) furan and methylfuran, and 3) propanenitrile, propenenitrile, and methylpropenenitrile, the values deviate from those of the other compounds. A partial explanation of this observation is that: (a) sty-renes polymerize and quickly decay by this additional mechanism, (b) furans undergo revers ible oligomer formation, which reduces their va-pour pressures, and they decay slowly. Except for the three groups of compounds, there wa a correlation between boiling points of combus-tion products and decay constants (r
=
0.789). Compounds witlt-low boiling points decayed quickly, as expected. Other mechanisms such as absorption and diffusion into a solid phase may also affect the decay rate.Field Study
An example of GC/MS results of organic compounds in the air inside a fire house is shown in Figure 4 (house #2 in Table 4). Quantitative an-alytical results of the five field studies are shown in Table 3. Details about the five buildings investigated in the field study are given in Table 4.
Ol
""'"
<
> c c 0 -..::; co .._-
c Q) u c 0 u-
c 0:a
.._-
c Q) u c 0 u-
0 )..9
-3-"'
-5 -6 -7 -8 -9 0 0.5 1 # 1.5 Log( day) 2 2.5FinllrA 1 nP.r.RV nf ('nmhu<::tinn nrnr/url<:: nf wnnrl hurn イOッイセカ@ in &;nOin QJ.../ <>ir
O'l 01 セ@ > !:: c 0 :;::: C13 ._
-
c Q) u c 0 u-
c 0 :;::; ca ._-
c Q) u c 0 セ@ O'l 0 ...J -3-"'
- 5 - 6_,
セ@
セ mッエィケャーイッーッッッッゥヲイゥャッ@Benzaldehyde Ber.zonitrile Methylm ethacrylate -8セ@
セ P セ@
セ@
セpイッー・ョ・ョゥエイゥャ・@ Propane nitrile -9 セMMMMMMMMセMMMMMMMMセMMMMMMMMセMMMMMMMMセセMMMMMMセセMMセセ@ 0 0.5 1 1.5 2 2.5 3 セ@ Log( day)Table 2. Average concentration in v/v x t0-9 of some organic compounds
occurring in residential houses (not fire houses) and days required for the concentration of the experimental fires to
decay to the average concentration.
Compound Avg. Cone. Log (Cone.) Days
Methylethylketone 5.53 -8.257 57.
Benzene 3.04 -8.517 72.
Toluene 9.71 -8 .013 38.
Styrene 0.52 -9.287 620.
Naplhalene 7.16 -8.145 2495.
Table 3. Organic compounds, concentration in vlv x 1
o-
9 quantified in the air ofrefurbished fire buildings. Building numbers correspond with numbers in Table 4.
No. Furfural Benzene Toluene Xylenes Hexanal Pinene Camphene Limonen 0.02 13. 1 19.5 18.8 4.5 4,5 1.1 4.8 2 0.23 1.6 11 .6 16 8 3.0 2.3 1.9 2.9 3 0.00 1.6 2.6 9.7 0.2 0.0 0.0 0.0 4 0.00 12.8 8.1 0.0 0.0 5.6 22.0 0.0 5 0.00 4.9 16.7 13.5 29.2 29.5 37.3 36 .7
Table 4. Details on buildings refurbished after a fire.
"
Fire Analysis TVOC*
No. Type of Building Date Type of Fire After Fire mg/m3
House 881014 Kitchen fire 40 days 2.0 2 House 880803 Kitchen fire 4 months 1.4 3 Office bldg. 860303 Major fire 16 months 0.4 4 Seniors' home 900101 Major fire 3 months 1.2 5 House 900427 Medium fire 5 months 4.8
• Total volatile org an1c compounds.
(j) -3 セ@ イMMMMMMMMMMMMMMMMMMMMMMMMMMMMMMMMMMMMMMMMMMMMMMMMMMMMMMMMMMMセ@
·r
-
c: liE liE Styrenes <tS-
J( en c:•
21-0 (.) セ@•
(.)•
(J) 0 11-•
I(セ@
セᄋ@
•
••
•
••
•
• •
•
0 MM MM MMMMMMセMMMMMMMMセMMMMMMMMセMMMMMMMMセMMMMMMセセMMMMMMセ@ 0 50 100 1SO 200 250 300•
Boiling point,oc
Figure 3. Boiling points versus de9ay constants for all the compounds in Table 1(a) wood burn and Table 1(b) mixed fuel bum, decay both in 500t6 RH air.
O'l 00
..
c 0 7jXKlO.B
..
0 c < c 0 fJCIKill 0"'
セ@ >.. c セ@ X 'E セPPPP@ -5"'
..
..
c :J w c.,
0....
0..
lll "'DODO c c 0 c セii^@ 0 '0 c:"'
.§ cI
0 X ·- c: :J .2 3a1Ca c..
Q.<l) ....1 J: r"§.c
..
I N.
-= 01aaaa 1QCDG 0 18 111 211 22 2"1 211 28 40 :12 34 •a Time, minFigure 4. Example of GCIMS analytical results of air in a fire, house #2 in Table 4, four months after a fire, TVOC
=
1.4 mg/m3, December 1988.Air Quality Problems Inside a House Following a Fire 69
Compounds with low boiling points such as furans and keton es were not detected. Quantities of hexanal and larger quanti ties of high boil-ing point terpenes were detected. These are common combustion prod-ucts of wood. In building #4, the concentration of camphene was un-usually high . It is suspected that t h e compound was from an external source such as deodorizer. Aromatic hydrocarbons such as benzene, toluene, and xylenes are commonly detected in indoor air and are com-mon combustion products of various plastics and hydrocarbons. These results are in line with the results of the box fire experiments. Unpleasant Odour
Residents of refurbished houses after a fire may complain of unpleas-ant odours. Nagata and others studied the relationship between
con-en en <D c:
c
co en co Q) a.. c: ::> 2.:5 2 1.5 0.5"'
セ・@ 1oPl''
セLャゥsG@セ L セ BG@
·5 .5 · 5 -:u.,
MセNL@ -4 Log(concentration), concentration in vlvFigure 5. Empirical relationship between concentration of odorous compounds and unpleasantness (from Reference 2) .
70 YOSHIO TSUCHIYA
centrations of about 50 odorous compounds and their degree of unpleas-antness to humans [3]. Unpleasunpleas-antness in this case is an empirical scale for human perception with scale 3 being "very unpleasant" and 0, no perception. Figure 5 shows the empirical relationships between con-centration and unpleasantness for five compounds commonly found af-ter a fire. It is noteworthy that in order to reduce unpleasantness by a unit degree, concentrations have to be reduced by a factor of ten. This is why cleaning alone will not reduce odour effectively. Compared with decay data in Figure 2, it is estimated that styrene in the box experi-ment reach at unpleasantness degree 1 on day 31 and at degree 0 on day 77. Styrenes were relatively quick decaying compounds. More data on concentration-unpleasantness relationship for slow decaying com-bustion products produced in fires are required for further discussion of individual compounds.
Commercial deodorizers are commonly used after a house is refur-bished. There is a wide variety of products containing many types of chemicals [ 4]. For example, typical ingredients are alcohols, glycol, gly-col esters, hydrocarbons, organic amines, chlorohydrocarbons, surfac-tants, and fragrant compounds. Compositions of commercial products are not normally disclosed.
The mechanism of deodorizing in most cases is to mask the unpleas-ant odour by fragrance, not to reduce セッョ」・ョエイ。エゥッョウ@ of odorous pounds [4]. Deodorizers will not reduce the toxic effects of inhaled com-pounds. The present author was consulted by a house owner who was suspicious about improper usage of deodorizers by the refurbishing con-tractor; chemical interactions of combustion products and deodorizing agents were suspected to have produced toxic products.
CONCLUSIONS
The concentrations of combustion products and number of days after fire showed good linear correlation on a log-log scale.
Slopes of the decay line on the log-log scale (decay constants) had a correlation with boiling points of combustion products, except for sev-eral types of compounds that may polymerize. The lower the boiling point the faster the decay.
In experimental wood fires, the decay of concentrations of combustion products in a 50% RH atmosphere was 2.5 times faster than in a dry at-mosphere.
Some combustion products could remain in a house in noticeable con-centrations several thousand days after a fire.
Air Quality Problems Inside a House Following a Fire 71 ACKNOWLEDGEMENTS
The author thanks Mr. J. B. Stewart for conducting fire experiments, field sampling, and analysis, and Dr. M. Kanabus-Kaminska for field sampling, analysis, and valuable discussions on the paper.
REFERENCES
1. 1990. "Fire Losses in Canada;' Labour Canada, Annual Report 1988. Ot-tawa: Department of Supply and Services.
2. Chan, C. C., L. Vainer, J. W. Martin and D. T. Williams. 1990. "Determina-tion of Organic Contaminants in Residential Indoor Air Using an Adsorption-Thermal Desorption Technique;' J. Air Waste Management
Assoc., 40:62.
3. Nagata, Y, T. Ishiguro, T. Hasegawa, N. Takeuchi, 0. Furukawa, S. Nakayama andY Shigeta. 1981. "Studies on the Relationship between Con-centration of Odorants and Hedonic Tone;' Bull. Jap. Environ. Sanitary
Center (8):76 (in Japanese).
4. Slivka, D. C., R. Leverenz and T. R. Steadman. 1979. "Room Deodorizers and Air Fresheners: Market, Manufacturers, and Chemical Compositions;' CPSC-C-78-0091, Task 11, Subtask 11.01. Columbus, OH: Battelle.
BIOGRAPHY
Yoshio Tsuchiya
Dr. Yoshio Tsuchiya is a senior research officer at the National Fire Laboratory, Institute for Research in Construction, National Research Council of Canada. His Bachelor of Engineering (1953) and Doct-or of Engineering (1962) degrees from the University of Tokyo were based on studies on explosives. He is the author of over 70 papers in the fields of pyrolysis and combustion of polymers, fire gas toxicity, and indoor air quality.