Publisher’s version / Version de l'éditeur:
Vous avez des questions? Nous pouvons vous aider. Pour communiquer directement avec un auteur, consultez la première page de la revue dans laquelle son article a été publié afin de trouver ses coordonnées. Si vous n’arrivez pas à les repérer, communiquez avec nous à PublicationsArchive-ArchivesPublications@nrc-cnrc.gc.ca.
Questions? Contact the NRC Publications Archive team at
PublicationsArchive-ArchivesPublications@nrc-cnrc.gc.ca. If you wish to email the authors directly, please see the first page of the publication for their contact information.
https://publications-cnrc.canada.ca/fra/droits
L’accès à ce site Web et l’utilisation de son contenu sont assujettis aux conditions présentées dans le site LISEZ CES CONDITIONS ATTENTIVEMENT AVANT D’UTILISER CE SITE WEB.
CFD 2004, the 12th Annual Conference of the Computational Fluid Dynamics
Society of Canada [Proceedings], pp. 1-6, 2004-05-01
READ THESE TERMS AND CONDITIONS CAREFULLY BEFORE USING THIS WEBSITE. https://nrc-publications.canada.ca/eng/copyright
NRC Publications Archive Record / Notice des Archives des publications du CNRC : https://nrc-publications.canada.ca/eng/view/object/?id=da919f8f-de87-4518-b853-c561af3fe96d https://publications-cnrc.canada.ca/fra/voir/objet/?id=da919f8f-de87-4518-b853-c561af3fe96d
NRC Publications Archive
Archives des publications du CNRC
This publication could be one of several versions: author’s original, accepted manuscript or the publisher’s version. / La version de cette publication peut être l’une des suivantes : la version prépublication de l’auteur, la version acceptée du manuscrit ou la version de l’éditeur.
Access and use of this website and the material on it are subject to the Terms and Conditions set forth at
CFD simulation of a fire in the living area of three storey residential
house to evaluate life safety in houses
CFD simulation of a fire in the living area of three storey
residential house to evaluate life safety in houses
Bounagui, A.; Bénichou, N.; Kashef, A.;
McCartney, C.
NRCC-47008
A version of this document is published in / Une version de ce document se trouve dans :
CFD 2004, the 12
thAnnual Conference of the Computational Fluid Dynamics
Society of Canada, Ottawa, May 9, 2004, pp. 1-6
CFD simulation of a fire in the living area of three storey
residential house to evaluate life safety in houses
A. Bounagui, N. Benichou, A. Kashef and C. McCartney
Institute for Research in Construction, National Research Council CanadaOttawa, ON, K1A 0R6, Canada
Email: abderrazzaq.bounagui@nrc-cnrc.gc.ca
A
BSTRACTOver time there have been changes in construction practices, building designs and materials and construction technologies. The Institute for Research in Construction (IRC) at the National Research Council of Canada (NRC) is undertaking research project to determine the impact of innovative residential construction products and systems on the fire safety of houses. The research study includes two phases: experimental and numerical. A new three-level full-scale experimental facility, representing a typical single-family house, has been built to study the structural fire performance, smoke movement and tenability conditions in the event of a fire.
In the event of a fire in the first storey of a house, fire and smoke can move up to the main and second floors either through an open door or any openings in the floor structure between the basement and the main floor rendering the upper floor untenable for the occupants.
Using CFD simulations this paper investigates the effect of the state of a stairwell door (opened or closed) on the fire development as well as on the moving up of the toxic gases to the upper floors. Simulation results were then used to estimate the time when conditions would become untenable, based on criteria found in the literature.
1. INTRODUCTION
To evaluate life safety in houses, the Fire Risk Management program at IRC/NRC, has carried out numerical simulations to study fires in houses. The numerical simulations were conducted using the Fire Dynamics Simulator (FDS) [1].
The 1999 Canadian fire statistics indicate that the most fatal fire scenarios in houses were fires originated in the living areas [2].
This paper presents the results of simulations performed to study the effect of the state of stairwell door (opened or closed) on the fire development of a fire that originated in the living area and on the moving up of the toxic gases to the upper floors. Simulations were then used to estimate the time when conditions would become untenable, based on criteria found in the New Zealand Fire Engineering Design Guide [3].
2. CFD MODEL
FDS is a CFD fire model that employs the large eddy simulation (LES) technique [1] to compute the gas density, velocity, temperature, pressure and species concentrations in each control volume. FDS has been demonstrated to predict thermal conditions resulting from a fire in an enclosure [1,4].
FDS requires as input: geometry of the modeled domain, computational cell size, location of the ignition source, fuel type, material thermal properties of walls and the vents.
2.1 Geometry
The full-scale test facility is a three-storey house. Figure 1 shows a perspective view of the facility. The three levels of the facility are enclosed within a 10.77 m x 9.25 m x 8.24 m tall rectangular volume.
Figure 1 Perspective view of the facility 2.2
Vents
The number of windows in the first storey and its surface areas are the mean values that were obtained from the survey conducted by IRC [5]. The model considered the following openings:
• Three window openings to the outside of the structure located in the first storey (FS) of the facility and is approximately 1.1 m wide x 0.7 m high.
• First stairway opening from the first storey to the second storey (SS) to represent the door between the FS and SS.
• Door opening to the outside of the structure located in the second storey of the facility and is approximately 0.9 m wide x 2.4 m high.
•
Second stairway opening from the second storey to the third storey (TS) to represent the door between the SS and TS.2.3 Thermal properties
The ceilings and floors of the facility are composed of steel and gypsum board. The walls are composed of gypsum board. The sofa, loveseat and chairs represent the upholstered furniture. The coffee table is composed of oak. The thermal properties of these materials are taken from the FDS database.
2.4 Fire
In this paper, the fire is assumed to originate in the first storey living area of a three-storey house. A fire load composed of sofa, loveseat, two chairs and a coffee table is considered. These items are most likely to be found in a living space. The values of the heat of combustion and density of the items are taken from the FDS database.
A burner with a size of 0.3 m wide by 0.5 long is placed on the sofa and is representing an ignition source of 30 kW. The total heat release that may be released by all the furniture is assumed to be about 6000 kW.
2.5 Grid sizes
The characteristic fire diameter D* represents the combined effect of the effective diameter of the fire and the size of the fire. It is about 2 m and is defined as follows: Ignition source D D D g T c Q g T c Q D p p 5 2 2 . 5 2 . * = = ∞ ∞ ∞ ∞ ρ ρ where: *
D
: characteristic fire diameter, m;D
: effective diameter, m;.
Q
: total heat release rate, kW (6000 kW); ∞ρ
: density at ambient temperature, kg/m3;p
c
: specific heat of gas, kJ/kg.K; ∞T
: ambient temperature, K;g
: acceleration of gravity, m/s2.The resolution of the fire plume simulation was defined as a dimensionless parameter [6]:
* *
max(
,
,
)
D
z
y
x
R
=
δ
δ
δ
and it was found that a value of 0.07 leads to an optimum resolution [7]. Therefore, the optimum grid size for the simulation was set to 0.14 m. The facility geometric domain was divided into a uniform grid using a (0.14x0.14x0.14 m) grid distribution.2.6 Position of thermocouples
In the model, the thermocouple trees, as well as the measurement of CO, CO2 and visibility, are placed at
different points of the first and second storeys to record the predicted quantities. Table 1 and Table 2 show the positions of the measurements that will be presented. Position (m) TC - No x y z Description 1 2.7 2.3 2.35 Temperature 2 7 5.2 2.0 Temperature
Table 1 Thermocouple positions
North Z
Y X
The measurements of CO, CO2 and visibility were
taken at a height of 1.5 m and 4.25 m. These heights were chosen to indicate the effect on the occupants in the first and second storeys of the house.
Position (m) M - No x y z Description 3 8.07 2.3 1.5 CO2 4 8.07 2.3 1.5 CO 5 8.07 2.3 1.5 Visibility 6 8.07 2.3 4.25 CO2 7 8.07 2.3 4.25 CO 8 8.07 2.3 4.25 Visibility
Table 2 CO, CO2 and visibility measurements at the northeast quarter point of the facility
TC: Thermocouple
M: Measurements of CO, CO2 and visibility
3. RESULTS AND DISCUSSION
In this section the effects of the stairwell opening on the development of the fire and smoke movement in the facility are presented. The fire originated in the first storey and started on a sofa; four ventilation scenarios have been studied and are summarized in Table 3. Scena rios W ind ow 1 W ind ow 2 W ind ow 3 Stairwell 1 Stairwell 2 Do or
1 Open Open Open Closed
2 Open Closed Open Closed
3 Break at 300 °C Open Open Closed 4 Break at 300 °C Closed Open Closed
Table 3 Ventilation scenarios
3.1 Heat Release predictions
The energy release by the burning item is termed the heat release rate. The rate at which the energy is released in a fire depends on the type, quantity, and orientation of the fuel and the effects of the enclosure.
Figure 2 shows the heat release rate vs. time as predicted by the simulation for the four scenarios. For the case when the windows and the stairwell are open during the simulation, the heat release rate is the
highest. This means that the air entrained in the combustion zone contains enough oxygen for the development of the fire. However, when the windows did not break until it reached a temperature of 300 °C and the stairwell door was closed the heat release was the lowest. The air entrained into the combustion zone contains less oxygen and due to the oxygen depletion, the heat release rate decreases.
Time (s) 0 100 200 300 400 500 600 700 H eat R e lea s e R a te (k W ) 0 1000 2000 3000 4000 5000 6000 Scenario 1 Scenario 2 Scenario 3 Scenario 4
Figure 2 Heat release rate for different scenarios
3.2 Temperature predictions
In the model, the thermocouple trees are placed in different quarter points of the first storey to record the predicted temperatures. The simulation results from thermocouples No 1 and 2 are presented to highlight the effect of the stairwell opening on the estimated temperatures.
Figure 3 gives the time-temperature profile predictions for thermocouple No 1. The temperature follows a similar trend to the heat release rate. When the air is entrained into the combustion zone it contains less oxygen due to the restriction of the opening and the heat release rate decreases as well as the temperature.
Time (s) 0 100 200 300 400 500 600 700 Tem perature ( oC) 0 200 400 600 800 1000 Scenario 1 Scenario 2 Scenario 3 Scenario 4
Figure 3 Temperature 20 cm below the first storey ceiling for different scenarios
Figure 4 gives the temperature vs. time for thermocouple N° 2 which is located in the middle of the stairwell opening at a height of 2 m from the floor. This position is very close to the stairwell door. Figure 4 shows that the temperature is lower when the door is open. This is due to the fact that when the door is open, a flow exchange of hot gases from the first storey and cold air from the second storey occurred and caused the drop of the temperature as well a turbulence phenomena.
Time (s) 0 100 200 300 400 500 600 700 T e m perat ure ( oC) 0 50 100 150 200 250 300 350 Door open Door closed
Figure 4 Temperature near the stairwell door in the first storey
3.3 Tenability criteria
To evaluate life safety in a house, tenability criteria are needed. The Fire Engineering Design Guide [3] in New Zealand adopted the criteria shown in Table 4.
Tenability type Tenability limit
Toxicity CO ≤ 1400 ppm
CO2≤ 0.05 mol/mol
Smoke obscuration
Visibility in the relevant layer should not fall below 2 m. Table 4 Tenability criteria
3.4 CO
2predictions
Figure 5 gives the CO2 concentrations vs. time for
measurement locations No 3 and 6, located at 1.5 and 4.25 m from the floor in the northeast quarter point. The figure shows that the effect of the stairwell is minimal on the prediction of the CO2 concentration in
the first storey (FS). However, the impact of the stairwell opening on moving the smoke up to the second storey is high. As can be noticed in Figure 5 there is a considerable amount of the CO2 moved to
the second storey which is harmful to the occupants. Figure 5 also shows that the situation in the first storey (FS) becomes life-threatening at 280 s from
the start of the simulation because the CO2
concentrations reach the tenability limit of 0.05 mol/mol. A considerable amount of toxic gases accumulate rapidly in the second storey when the stairwell is open. Time (s) 0 100 200 300 400 500 600 700 CO 2 concentration (m ol/mol) 0.00 0.02 0.04 0.06 0.08 0.10 FS door open FS door closed SS door open SS door closed Tenability limit
Figure 5 CO2 concentrations for scenarios 3 and 4
3.5 CO predictions
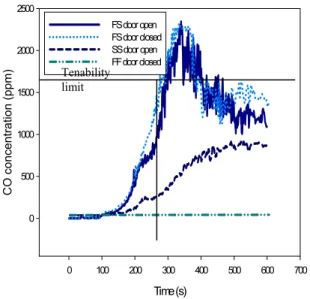
Figure 6 shows the CO concentrations vs. time for measurement locations No 4 and 7, located at 1.5 and 4.25 m from the floor in the northeast quarter point. The figure shows that the effect of the stairwell is minimal on the prediction of the CO concentration in the FS. However the opening of the stairwell has a large impact on the SS because when it is open, it allows the toxic gases to move up and will harm the occupants of the upper floors.
Time (s) 0 100 200 300 400 500 600 700 CO concentration (ppm) 0 500 1000 1500 2000 2500 FS door open FS door closed SS door open FF door closed
Figure 6 CO concentrations in the first & second storeys
Figure 6 shows also that the CO concentration reaches the tenability limit of 1400 ppm at 280 s from the start of the simulation. At this time the CO concentration increases rapidly in the second storey when the stairwell door is open.
3.6 Visibility predictions
Figure 7 shows the visibility vs. time for the measurement locations No 5 and 8, located at 1.5 and 4.25 from the floor in the northeast quarter point. The figure shows a similar trend as the CO2 and CO
predictions. The effect of the stairwell is minimal on the prediction of the visibility in the first storey (FS). However, the impact of the stairwell opening in moving the smoke to the second storey is significant. When the stairwell door is open the smoke moved up, rendered the visibility in the SS lower which will delay the escape of occupants. As can be noticed from Figure 6 the visibility in the second storey becomes poor after 200 s of ignition.
Time (s) 0 100 200 300 400 500 600 700 Visib ility (m) 0 5 10 15 20 25 30 35 FS door open FS door closed SS door open SS door closed Tenability limit
Figure 7 Visibility predictions in the first & second storeys
CONCLUSION
This paper presented the simulation results for a fire that originated in the living area in the first storey of an experimental facility, in order to determine the effect of the state of the stairwell door on the development of the fire and on the moving of the toxic gases to the upper floors.
Tenability limit
CFD simulations were conducted for 4 ventilation scenarios. The numerical simulations showed that when the door of the stairwell is open, toxic gases in the form of CO2 and CO moved to the upper floor.
This contaminated the upper floors and rendered them life threatening for the occupants.
Based on the tenability limits adopted, the simulation results predicted that untenable conditions for CO2
and CO were reached after 280 s in the first storey. The untenable conditions for visibility criteria were reached after 100 s in the first storey and after 180 s in the second storey.
The simulations predict reasonably the phenomena of the fire dynamic in the facility; however, these results will be compared with experiments in the near future.
REFERENCES
1. McGrattan, Kevin B., Baum, Howard R., Rehm,
Ronald G., Hamins, Anthony, Forney, Glenn P., Fire Dynamics Simulator – Technical Reference
Guide, National Institute of Standards and Technology, Gaithersburg, MD., NISTIR 6467, January 2000.
2. Yung, D., and Lougheed, G., “Fatal Fire
Scenarios in Canadian Houses”, NRC Internal
Report, No. 830, 2001.
3. A. H. Buchanan, Fire Engineering Design Guide, Center for Advanced Engineering, University of Canterbury, New Zealand, 1994.
4. McGrattan, Kevin B., Forney, Glenn P., Fire
Dynamics Simulator – User’s Manual, National
Institute of Standards and Technology,
Gaithersburg, MD., NISTIR 6469, January 2000. 5. A. C. Bwalya, M. Sultan and N. Benichou, “ A
pilot survey of fire loads in Canadian homes”,
NRC, Research Report, No., 159, 2004
6. T. G. Ma, J. G. Quintiere, Numerical simulation
of axi-symmetric fire plumes : accuracy and limitations , Fire Safety Journal 38, 467-492,
2003.
7. A. Bounagui, N. Benichou, C. McCartney and A.
Kashef. “Optimizing the Grid Size Used in CFD Simulations to Evaluate Fire Safety in Houses”,
3rd NRC CFD Symposium on Computational Fluid Dynamics, High Performance Computing and Virtual Reality, Ottawa, December 4, 2003.