HAL Id: hal-03104070
https://hal.archives-ouvertes.fr/hal-03104070
Submitted on 11 Jan 2021
HAL is a multi-disciplinary open access
archive for the deposit and dissemination of
sci-entific research documents, whether they are
pub-lished or not. The documents may come from
teaching and research institutions in France or
abroad, or from public or private research centers.
L’archive ouverte pluridisciplinaire HAL, est
destinée au dépôt et à la diffusion de documents
scientifiques de niveau recherche, publiés ou non,
émanant des établissements d’enseignement et de
recherche français ou étrangers, des laboratoires
publics ou privés.
Influence of large-scale atmospheric circulation on
marine air intrusion toward the East Antarctic coast
Naoyuki Kurita, Naohiko Hirasawa, Seizi Koga, Junji Matsushita, Hans
Christian Steen-Larsen, Valérie Masson-Delmotte, Yasushi Fujiyoshi
To cite this version:
Naoyuki Kurita, Naohiko Hirasawa, Seizi Koga, Junji Matsushita, Hans Christian Steen-Larsen, et
al.. Influence of large-scale atmospheric circulation on marine air intrusion toward the East Antarctic
coast. Geophysical Research Letters, American Geophysical Union, 2016, 43 (17), pp.9298-9305.
�10.1002/2016GL070246�. �hal-03104070�
Influence of large-scale atmospheric circulation on marine air
intrusion toward the East Antarctic coast
Naoyuki Kurita1, Naohiko Hirasawa2, Seizi Koga3, Junji Matsushita2, Hans Christian Steen-Larsen4, Valérie Masson-Delmotte5, and Yasushi Fujiyoshi6
1Institute for Space-Earth Environmental Research, Nagoya University, Nagoya, Japan,2National Institute of Polar
Research, Tokyo, Japan,3National Institute of Advanced Industrial Science and Technology, Tsukuba, Japan,4Centre for Ice
and Climate, Niels Bohr Institute, University of Copenhagen, Denmark,5LSCE Laboratoire des Sciences du Climat et de
l’Environnement, Paris, France,6Institute of Low Temperature Science, Hokkaido University, Sapporo, Japan
Abstract
Marine air intrusions into Antarctica play a key role in high-precipitation events. Here we use shipboard observations of water vapor isotopologues between Australia and Syowa on the East Antarctic coast to elucidate the mechanism by which large-scale circulation influences marine air intrusions. The temporal isotopic variations at Syowa reflect the meridional movement of a marine air front. They are also associated with atmospheric circulation anomalies that enhance the southward movement of cyclones over the Southern Ocean. The relationship between large-scale circulation and the movement of the front is explained by northerly winds which, in association with cyclones, move toward the Antarctic coast and push marine air with isotopically enriched moisture into the inland covered by glacial air with depleted isotopic values. Future changes in large-scale circulation may have a significant impact on the frequency and intensity of marine air intrusion into Antarctica.1. Introduction
Large-scale atmospheric circulation anomalies that enhance poleward moisture transport are thought to affect local weather and the East Antarctic surface mass balance. Observations at Dronning Maud Land (DML) in East Antarctica (EA), for example, have revealed the highest snowfall events recorded in the past 60 years [e.g., Lenaerts et al., 2013]. According to an analysis of heavy snow accumulation events from 2009 to 2011 at Princess Elisabeth station in DML, more than 70% of the total yearly accumulation was derived atmo-spheric rivers (ARs) taking the form of narrow filamentary structures stretching from the subtropical latitudes to Antarctica [Gorodetskaya et al., 2014].
The link between large-scale circulation and local precipitation can be mediated by coastal cyclones over the Southern Ocean (SO) [e.g., Bromwich et al., 1995; King and Turner, 1997; Genthon and Krinner, 1998; Tietäväinen
and Vihma, 2008; Tsukernik and Lynch, 2013]. The northerly winds associated with cyclones may transport
warm, moist marine air to the interior of the Antarctic continent. Then, when the marine air meets the cold glacial air over the ice-covered region, frontogenesis, a process that can bring intense snowfall, occurs along the leading edge of the marine air (marine air front). The larger temperature gradient between the extratrop-ical air and glacial air may result in more enhanced frontal activity. It would simplistic, however, to rely wholly on this explanation. The steep coastal topography, for example, shields the ice sheets from marine air intrusion [Stohl and Sodemann, 2010]. The persistent cold air drainage flow along the steep slope from the interior of the ice sheet (katabatic outflow), may push the front seaward. There is also uncertainty as to whether marine air from the extratropical regions can reach the Antarctic coast through the enhanced poleward moisture flow associated with large-scale circulation. These issues complicate the relationship between large-scale cir-culation and local precipitation. Our ability to accurately predict future mass balance changes in EA hinge on our understanding of the mechanism by which large-scale circulation influences the marine air intrusion [e.g.,
Huybrechts et al., 2004; Krinner et al., 2007; Lenaerts et al., 2016].
Water vapor isotopologues (HDO and H18
2O) are effective tracers to identify air mass sources in the polar region
[Kurita, 2011; Steen-Larsen et al., 2013, 2014; Bonne et al., 2014, 2015]. The isotopic composition is expressed by
𝛿 notation, which is a normalized difference of the isotopic ratio (R) from the isotopic ratio of Vienna Standard
Mean Ocean Water (Rvsmow):𝛿 = R
Rvsmow − 1. Kopec et al. [2014] recently used monitoring data on water stable
RESEARCH LETTER
10.1002/2016GL070246 Key Points:
• Marine air intrusion to the East Antarctic coast is closely associated with the zonal wave number three-like circulation • Large-scale northerly winds
associated with ZW3 push marine air further inland
• Moisture sources of marine air intrusions distribute over the Antarctic Circumpolar Trough
Supporting Information: • Supporting Information S1 Correspondence to: N. Kurita, kurita.naoyuki@e.mbox.nagoya-u.ac.jp Citation:
Kurita, N., N. Hirasawa, S. Koga, J. Matsushita, H. C. Steen-Larsen, V. Masson-Delmotte, and Y. Fujiyoshi (2016), Influence of large-scale atmo-spheric circulation on marine air intru-sion toward the East Antarctic coast, Geophys. Res. Lett., 43, 9298–9305, doi:10.1002/2016GL070246.
Received 30 JUN 2016 Accepted 16 AUG 2016
Accepted article online 19 AUG 2016 Published online 7 SEP 2016 Corrected 12 DEC 2016
This article was corrected on 12 DEC 2016. See the end of the full text for details.
©2016. American Geophysical Union. All Rights Reserved.
Geophysical Research Letters
10.1002/2016GL070246
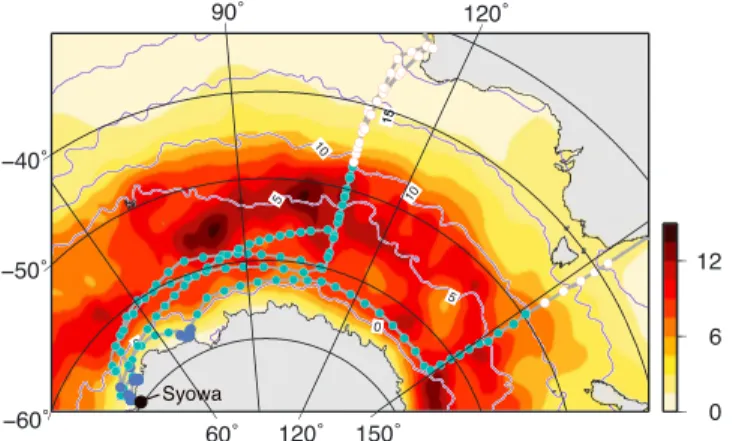
Figure 1. JARE cruise track (gray line) overlaid on a map of the summer cyclone track density during the observation period (2013/2014 and 2014/2015). A track density is a unit of number density per month per unit area (5∘radius). The trajectory launch positions (00 and 12 UTC) are also marked on the cruise track: open circles, green circles, and blue circles, respectively, show locations in the extrapolar ocean, cold ice-free ocean, and ice-covered ocean. Contours represent the austral summer mean sea surface temperature.
isotopes to track the movement and position of a front between marine and glacial air masses in coastal western Greenland. Marine air masses are generally characterized by moist air with higher water vapor iso-topic values derived from the enhanced supply of heavier isotopes incorporated via evaporation from the ocean [Uemura et al., 2008; Kurita, 2011]. The isotopic composition of marine vapor also yields information on the moisture sources of marine air masses since the isotopic composition of oceanic evaporation gradually increase as the sea surface temperature (SST) rises [e.g., Kurita, 2013]. In contrast, glacial air masses over inland ice sheets are very dry and contain fewer heavy isotopes than maritime air due to isotopic removal by con-densation as the vapor moves inland [Steen-Larsen et al., 2013, 2014]. Paired measurements of the water vapor isotopes with H2O concentration are therefore useful to distinguish between marine air mass and glacial air
mass at the observation site (ship position).
Deuterium excess (d-excess), defined by Dansgaard [1964] as d = 𝛿D–8𝛿18O, is also recognized as an
excel-lent tool for identifying moisture origins. The d-excess in evaporated moisture is controlled by evaporation conditions; i.e., sea surface temperature and relative humidity (for a detailed review see Gat [1996]). Low d-excess is associated with the suppression of kinetic effects during evaporation from high humidity or high sea surface temperatures, while high d-excess reflects enhanced kinetic effects from low humidity or cold sea surface temperatures. A recent study combining in situ measurements of d-excess along a transect of sites from the North Atlantic to the Greenland ice sheet has confirmed the preservation of the source signal along transportation [Bonne et al., 2015].
In this study we classify air masses arriving at a coastal station in DML in EA (Syowa) into marine and glacial air masses based on an H2O-𝛿 space diagram with the aid of trajectory analysis. We then use the classification data to investigate the mechanism underlying the large-scale circulation control of marine air intrusion at Syowa.
2. Data and Method
Water vapor isotopologues were continuously measured along the Japanese Antarctic Research Expedition (JARE) cruise track on the icebreaker Shirase from Australia to Syowa station on the EA coast during two Australian summers, 2013/2014 (JARE55) and 2014/2015 (JARE56). Syowa station (69.00∘’S, 39.58∘’E) is located on East Ongul Island in Lutzow-Holm Bay in eastern DML. On each cruise, the Shirase left Fremantle (western Australia) in late November and stayed in the Lutzow-Holm Bay area near Syowa station from late December to early February (Figure 1). She then sailed back to Australia, arriving at Sydney (eastern Australia) or Fremantle by the middle of March.
A Water Vapor Isotope Analyzer (WVIA) coupled with a Water Vapor Isotope Standard Source (WVISS) from Los Gatos Research Inc. was installed in a laboratory placed on the top deck of the Shirase. Ambient air sam-ples were collected 30 m above the sea surface and drawn into the WVIA-WVISS coupled system through a perfluoroalkoxy alkanes tube of 5 m in length. The H2O concentration and water vapor isotopologues were
Figure 2. Joint probability density function (PDF) of H2O versus𝛿D from three different regions identified in Figure 1 along the JARE cruise tracks. The extrapolar ocean, cold ice-free ocean, and ice-covered ocean are, respectively, shown in orange, green, and blue. The bin widths of H2O and𝛿D are 200 ppm and 2.5‰, respectively. The contour interval is 0.5%. All hourly averaged data from JARE observations are shown as gray circles. The solid black curve shows the calculated D values in marine vapor using the closure assumption model from Merlivat and Jouzel [1979] (see Text S2 for details). The blue area between the dashed black curves represents mixing curves showing the possible paths taken when complete mixing occurs between marine vapor and glacial vapor (see Text S3 for details). Inset:𝛿D-d-excess plots for surface vapor observed over the ice-covered ocean near Syowa station. The purple circle represents the average values; the error bars indicate the standard deviation while the ship was near Syowa station.
recorded by the WVIA every second and calibrated according to the procedure described by Kurita et al. [2012] (see Text S1 in the supporting information for details). The analytical uncertainty was 2.5‰ for𝛿D and 0.28‰ for𝛿18O, which resulted in an uncertainty of 3.4‰ for d-excess. Hourly integrated isotope data were used for
the analysis to procedure results easily comparable with hourly meteorological variables. The isotope data used in this study will be available at http://scidbase.nipr.ac.jp.
The measured H2O concentration and𝛿D are plotted on an H2O-𝛿D space diagram to diagnose atmospheric
moistening and drying processes in the surface marine vapor. The moisture balance over the polar ocean is governed by the process of moistening via evaporation from the sea surface and the process of drying through mixture with dry air masses draining from the interior of the ice sheet. The𝛿D of oceanic evaporation (𝛿DE) along the cruise track was calculated using the evaporative model based on Merlivat and Jouzel [1979]
with a closure assumption, the so-called closure model. Surface evaporation was the only source of moisture considered (see Text S2 for details):
𝛿DE= 1 𝛼eq 1 − k 1 − kRHSST − 1 (1)
where 𝛼eq represents the equilibrium fractionation factor between liquid and vapor, which is a variable
depending on sea surface temperature [Majoube, 1971], RHSSTis relative humidity with respect to the sea sur-face temperature (SST), and 1 − k is a parameter expressing diffusive fractionation of a thin saturated layer just above the sea surface into the atmosphere. The𝛿DEvalues are plotted (black line) as a function of the
H2O concentration in Figure 2. An air mass mixing model with a fully mixed assumption [e.g., Noone, 2012] is
applied to estimate the evolution of𝛿D in freshly evaporated marine air approaching the isotopic content of glacial air through continuous mixing (see Text S3 for details):
𝛿D = QMV[𝛿DMV−𝛿DF](1∕QF) +𝛿DF (2)
𝛿DF=
𝛿DGLQGV−𝛿DMVQMV
QGV− QMV
Geophysical Research Letters
10.1002/2016GL070246
where Q is the H2O concentration, the subscript F represents the water vapor added by the diffusion flux in the frontal zone, and the subscripts MV and GV represents marine and glacial vapor, respectively. The blue-shaded area between hyperbolic paths (dashed lines) in Figure 2 shows the area of mixing between the marine air mass evaporated from the open ocean and the glacial air mass draining from the interior of the ice sheet to Syowa station (see section 3 for details).
Surface meteorological variables such as the mixing ratio, air temperature, wind speed, and wind direction are observed on board the Shirase. The SST is also monitored on board the Shirase, and the RHSSTis calculated over
the ocean. Large-scale circulation and synoptic-scale weather conditions are examined using the European Center for Medium-range Weather Forecasts (ECMWF) Interim (ERA-Interim) [Dee et al., 2011] reanalysis data at 0.75∘ × 0.75∘ horizontal resolution. ERA-Interim has been found to effectively reproduce poleward moisture fluxes [Bromwich et al., 2011] and synoptic-scale cyclones over the Southern Hemisphere [Hodges et al., 2011]. Cyclones are tracked using the TRACK-1.4.3 algorithm developed by [Hodges, 1994, 1995, 1999] based on rel-ative vorticity at the 850 hPa field derived from the ERA-Interim. The NOAA Hybrid Single-Particle Lagrangian Integrated Trajectory (HYSPLIT) Model (Version 4.0) [Draxler and Rolph, 2003] is used for trajectory analysis to classify air masses arriving at observation points into maritime and continental (glacial) origins. Four-day back trajectories are calculated at 00 and 12 UTC from the location of the JARE cruises (Figure 1; also, see Text S4). Poleward moving air masses (referred to as “marine air masses” in the ice-covered ocean) are defined as air masses whose computed trajectories originate from oceanic regions warmer than the observation site in more than 80% of the computations. Equatorward (extrapoleward) moving air masses (referred to as “glacial air masses” in the ice-covered ocean) are defined as air masses whose computed trajectories originate from Antarctica or pass through an oceanic region colder than the observation site in more than 50% of the computations.
3. Results and Discussion
Figure 1 shows the mean storm track density for the Australian summer (December–February) in the obser-vation years (2013/2014 and 2014/2015). As shown in past studies, the highest densities correspond to the Antarctic Circumpolar Trough (ACT) expansion from the sea ice edge to the midlatitudes (45∘’S–65∘’S) [e.g.,
Simmonds et al., 2003; Hoskins and Hodges, 2005]. In this study we divide our study area into (1) the
extrapo-lar ocean (north of the ACT), (2) cold ice-free ocean (ACT), and (3) ice-covered ocean (south of ACT). Figure 2 shows the joint probability density function (PDF) of H2O-𝛿D pairs for all measurements in each area. This
PDF is computed as a the two-dimensional histogram between H2O and𝛿D in surface vapor normalized by
the total number of measurements. The PDF represents the distribution of data in the respective study areas during the JARE cruises.
Over the extrapolar ocean, where the SST exceeds 10∘C (north of 45∘’S), the PDF lying along the evaporation curve (black line) suggests that oceanic evaporation from this region is a dominant source. This is supported by a clear negative linear relationship between d-excess and RHSST(Figure S1). Since surface water with a low
(high) RHSSTsupplies moisture with a high (low) d-excess [e.g., Pfahl and Sodemann, 2014], d-excess varies in association with changes in RHSSTin regions where locally evaporated moisture from the ocean dominates.
By contrast, the PDF for the cold ice-free ocean (SST< 10∘C) falls below the evaporation curve and depicts a large spread toward the PDF for the ice-covered ocean. The isotopic composition of precipitation observed in earlier JARE cruises also exhibits a decreasing trend with latitude in this region (south of 60∘’S) [Nakamura
et al., 2014]. These results suggest that southward/northward winds associated with cyclones transport
mois-ture with enriched/depleted𝛿D values to the observation site. Based on trajectory analysis, we identify both the poleward and extrapoleward moving air masses and then examine the isotopic signature of each. As expected, the𝛿D values of poleward moving air lie close to the evaporation curve. While the 𝛿D values of the extrapoleward moving air also turn out to be significantly lower than the𝛿D values of the poleward mov-ing air (Figure 3a), they are still significantly higher than those in the ice-covered region. This difference in𝛿D implies the presence of a significant supply of additional moisture from evaporation during transport over the SO. Southerly winds from the Antarctic coast push cold glacial air across the ice-free ocean. Evaporation under a low-SST condition with a strong temperature contrast between the surface air temperature and SST (corresponding to a lower RHSST) supplies moisture with a relatively lower𝛿D and higher d-excess to the
mar-itime air [e.g., Kurita, 2011]. These isotopic features were clearly observable in the extrapoleward moving air (Figure 3a). Further, the similarity in the relationship between d-excess and RHSSTto that in the extrapolar
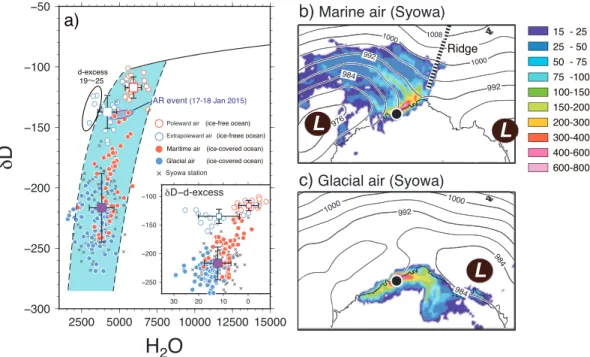
Figure 3. (a) H2O-𝛿D of water vapor for JARE observations at the trajectory launch positions. The trajectory analysis was done from the launch positions at 00 and 12 UTC. The red and blue circles represent poleward and extrapoleward moving air masses arriving at the location of the ship. Open and filled circles show data obtained from the cold ice-free ocean and ice-covered ocean, respectively. The masses measured over the ice-covered ocean are marine and glacial air masses, respectively. The square symbols represent average values; the error bars indicate standard deviations. The cross symbols represent data that cannot be classified into air masses of either marine or glacial origin. The red circles enclosed by the purple oval were collected during an atmospheric river (AR) event (17–19 January 2015). (b) A composite back trajectory pattern for Syowa (black circle) during periods when marine air masses dominated. The color represents the number of trajectories at each grid. Contours represent the mean sea surface pressure (solid lines; contour interval 4 hPa) during the same periods. Sea level pressure data above 150 m elevation is masked. (c) Same as Figure 3b but for glacial air masses.
ocean (Figure S1) supports the notion that oceanic evaporation during transport is the dominant moisture source for the air mass.
The observations over the ice-covered ocean were mostly conducted while the icebreaker Shirase was near Syowa station. The𝛿D values varied widely, ranging from less than −250‰ to more than −150‰, while the variability in H2O was small. When heavy snowfall and blizzards were observed,𝛿D values were higher than the mean for the ice-covered ocean (−212‰). The highest𝛿D value appeared during a 3 day episode of heavy snowfall at Syowa (17–19 January 2015) associated with high poleward moisture transport organized in a fil-amentary structure stretching from subtropical latitudes to the East Antarctic coast (Figure 4a). The vertically integrated water vapor in this filamentary plume satisfies the threshold for an AR event: more than 1 cm at 70∘’S [Gorodetskaya et al., 2014]. Note that the snow height measured at Syowa increased by about 70– 80 mm during this AR event. In contrast, the lowest𝛿D values were observed during a dry, cold period with a daily minimum temperature of below −5∘C. Trajectory analysis was used to explore the𝛿D signatures for the period when marine and glacial air masses were dominant at Syowa. As shown in Figures 3b and 3c, the major trajec-tory paths for the marine and glacial air masses clearly differ. In Figure 3a, anomalously high (low)𝛿D values (anomalies from the mean of the whole events exceed 1𝜎) correspond to the marine air masses (glacial air masses) in spite of the wide range of isotopic variability. The large𝛿D variability at Syowa may therefore reflect the large𝛿D difference between the marine and glacial air masses. Assuming that the isotopic composition of glacial vapor is constant at the lowest𝛿D of the glacial air mass (−285‰) in the H2O concentration range
of glacial air (1500 ppmv ∼ 4500 ppmv), we estimate the evolution of𝛿D in the inland-moving marine air mass under a condition of continuous mixing toward the isotopic content of glacial air. Values for possible end-members of the marine air mass were chosen along the evaporation curve over the ice-free ocean, which spans an SST from 0∘C to 10∘C. H2O-𝛿D pairs for both the ice-free ocean and ice-covered ocean lie along the
Geophysical Research Letters
10.1002/2016GL070246
Figure 4. (a) Composite of total column precipitable water (shading: mm) and 500 hPa geopotential heights (contours; contour interval 150 m) for an atmospheric river event at 00 UTC 17 January 2015. (b) The 500 hPa geopotential height anomalies (shading; m) and column-integrated water vapor flux anomalies (arrows; kg/m−1s−1) regressed against the
𝛿D anomalies of water vapor while the ship was near Syowa station. The color shading and arrows have confidence levels of more than 95%. The counter interval is 0.1, with solid and dashed lines indicating anticyclonic and cyclonic circulation anomalies, respectively.
This result suggests that the coastal-inland movement of the marine air front governs𝛿D variability: higher (lower)𝛿D values correspond to the front moving inland (seaward). This is also consistent with the relationship between the variations in d-excess and𝛿D (inset in Figure 3a). In the 𝛿D-d-excess plot we find that the values for marine air lie between the mean of the whole events over the ice-covered region and those for marine air over the cold ice-free ocean. Note that the observed data during the AR event align with those for the ice-free ocean (Figure 3a). This tells us that the marine air masses from the cold ice-free ocean (ACT) penetrate inland across the Syowa station.
Next, we consider whether the movement and position of the marine air front are influenced by a large-scale atmospheric circulation. Figure 4b exhibits atmospheric circulation anomalies (geopotential height anomalies at 500 hPa) regressed against the𝛿D values recorded from the ship in the ice-covered ocean near Syowa. The correlated anomalies are characterized by a synoptic pattern with an anticyclonic anomaly situated at 60∘E in the SO and cyclonic anomalies to both the east and west, a condition that may have led to poleward moisture transport toward the DML coast. Note that the AR event was also found to be associated with this atmospheric pattern (Figure 4a). The trough-ridge-trough pattern resembles the zonal wave number 3 (ZW3), a typical circulation pattern in the extratropical Southern Hemisphere [e.g., Mo and White, 1985; Kidson, 1988] (Figure S2). Uotila et al. [2013] has reported that anomalous poleward flows associated with ZW3 lead to the increased southward movement of cyclones over the SO. The close association between the ZW3-like pattern and southward cyclone movement is consistent with the southward shift of the cyclonic anomalies from the position of the anticyclonic anomaly (Figure 4b). Southward moving cyclones that reach the Antarctic coast can transport marine air with isotopically enriched moisture to the Antarctic ice sheet. For moisture transport, the correlated anomalies of moisture flux (arrows in Figure 4b) lie along the eastern and northern edge of the cyclone. The significant area extends to around 50∘S in the ACT. This result is consistent with the H2O-𝛿D
diagram showing the moisture sources of the marine air intrusions distributed over the ACT.
4. Conclusions
We used continuous measurements of isotopic ratios in water vapor along the JARE cruises from Australia to Syowa station to identify the moisture origin of marine air moving to Syowa and the influence of large-scale atmospheric circulation on the marine air intrusion. The joint PDF in the H2O-𝛿D space diagram showed the distribution of moisture sources for marine air advected to Syowa, including an AR event, in the ACT (45∘’S–65∘’S). This result supports a past assessment of the moisture sources of the precipitation at Syowa based on the linear relationship between the𝛿18O of precipitation and the sea ice extent [Bromwich and
Weaver, 1983]. They have addressed that the moisture source region is located around the latitudes of 55∘’S
and 58∘’S. It is also consistent with an independent assessment of the moisture sources of this coastal area based on a Lagrangian moisture source diagnostic (48∘’S–55∘’S) [Sodemann and Stohl, 2009]. In the ice-covered ocean near Syowa station, the large range of isotopic variability reflects the coastal-inland
movement of the front between a warm maritime air mass with an enriched𝛿D value and a cold glacial air mass with a depleted𝛿D value. This 𝛿D variability was also found to be linked to the variability of large-scale circulation elicited by the trough-ridge-trough pattern. This synoptic pattern enhances the southward move-ment of the cyclones [Uotila et al., 2013]. The northerly winds associated with cyclones that reach the coast of EA push marine air further inland, possibly bringing heavy snowfall toward inland sites [e.g., Hirasawa et al., 2000; Gorodetskaya et al., 2014; Welker et al., 2014]. Changes in the frequency and duration of this pattern may exert a strong controlling force on the surface mass balance of the EA coast. Close monitoring of these events at coastal sites thus appears to be a promising method for detecting early signs of climate change in EA. A quantitative understanding of the relationship between marine air intrusion and precipitation based on quan-titative modeling is critical for projecting the coastal Antarctic surface mass balance. Our study shows that the isotopic composition of water vapor on the Antarctic ice sheet is an important diagnostic tool for assessing model performance.
References
Bonne, J. L., V. Masson-Delmotte, O. Cattani, M. Delmotte, C. Risi, H. Sodemann, and H. C. Steen-Larsen (2014), The isotopic composition of water vapour and precipitation in Ivittuut, southern Greenland, Atmos. Chem. Phys., 14(9), 4419–4439, doi:10.5194/acp-14-4419-2014. Bonne, J.-L., et al. (2015), The summer 2012 Greenland heat wave: In situ and remote sensing observations of water vapour isotopic
composition during an atmospheric river event, J. Geophys. Res. Atmos., 120(7), 2970–2989, doi:10.1002/2014JD022602.
Bromwich, D. H., and C. J. Weaver (1983), Latitudinal displacement from main moisture source controls𝛿18O of snow in coastal Antarctica,
Nature, 301(5), 145–147, doi:10.1038/301145a0.
Bromwich, D. H., F. M. Robasky, and R. I. Cullather (1995), The atmospheric hydrologic cycle over the Southern Ocean and Antarctica from
operational numerical analyses, Mon. Weather Rev., 123, 3518–3538, doi:10.1175/1520-0493(1995)123<3518:TAHCOT>2.0.CO;2.
Bromwich, D. H., J. P. Nicolas, and A. J. Monaghan (2011), An assessment of precipitation changes over Antarctica and the Southern Ocean since 1989 in contemporary global reanalyses, J. Clim., 24, 4189–4209, doi:10.1175/2011JCLI4074.1.
Dansgaard, W. (1964), Stable isotopes in precipitation, Tellus, 16, 436–468.
Dee, D. P., et al. (2011), The ERA-Interim reanalysis: Configuration and performance of the data assimilation system, Q. J. R. Meteorol. Soc., 137(656), 553–597, doi:10.1002/qj.828.
Draxler, R., and G. Rolph (2003), Hybrid Singlee-Particle Lagrangian Integrated Trajectory (HYSPLIT), model released from NOAA ARL READY NOAA Air Resources Laboratory. Silver Spring, Md. [Available at: http://ready.arl.noaa.gov/HYSPLIT.php, Last access: 30 April,2014]. Gat, J. R. (1996), Oxygen and hydrogen isotopes in the hydrological cycle, Annu. Rev. Earth Planet. Sci., 24, 225–262.
Genthon, C., and G. Krinner (1998), Convergence and disposal of energy and moisture on the Antarctic polar cap from ECMWF reanalyses
and forecasts, J. Clim., 11(7), 1703–1716, doi:10.1175/1520-0442(1998)011<1703:cadoea>2.0.co;2.
Gorodetskaya, I. V., M. Tsukernik, K. Claes, M. F. Ralph, W. D. Neff, and N. P. M. Van Lipzig (2014), The role of atmospheric rivers in anomalous snow accumulation in East Antarctica, Geophys. Res. Lett., 41(1), 6199–6206, doi:10.1002/2014GL060881.
Hirasawa, N., H. Nakamura, and T. Yamanouchi (2000), Abrupt changes in meteorological conditions observed at an inland Antarctic Station in association with wintertime blocking, Geophys. Res. Lett., 27(1), 1911–1914, doi:10.1029/1999GL011039.
Hodges, K. I. (1994), A general method for tracking analysis and its application to meteorological data, Mon. Weather Rev., 122, 2573–2585,
doi:10.1175/1520-0493(1994)122<2573:AGMFTA>2.0.CO;2.
Hodges, K. I. (1995), Feature tracking on the unit sphere, Mon. Weather Rev., 123, 3458–3465,
doi:10.1175/1520-0493(1995)123<3458:FTOTUS>2.0.CO;2.
Hodges, K. I. (1999), Adaptive constraints for feature tracking, Mon. Weather Rev., 127(6), 1362–1373,
doi:10.1175/1520-0493(1999)127<1362:ACFFT>2.0.CO;2.
Hodges, K. I., R. W. Lee, and L. Bengtsson (2011), A comparison of extratropical cyclones in recent reanalyses ERA-Interim, NASA MERRA, NCEP CFSR, and JRA-25, J. Clim., 24, 4888–4906, doi:10.1175/2011JCLI4097.1.
Hoskins, B. J., and K. I. Hodges (2005), A new perspective on Southern Hemisphere storm tracks, J. Clim., 18(2), 4108–4129, doi:10.1175/JCLI3570.1.
Huybrechts, P., J. Gregory, I. Janssens, and M. Wild (2004), Modelling Antarctic and Greenland volume changes during the 20th and 21st centuries forced by GCM time slice integrations, Global Planet. Change, 42, 83–105, doi:10.1016/j.gloplacha.2003.11.011.
Kidson, J. W. (1988), Interannual variations in the Southern Hemisphere circulation, J. Clim., 1(1), 1177–1198,
doi:10.1175/1520-0442(1988)001<1177:IVITSH>2.0.CO;2.
King, J. C., and J. Turner (1997), Antarctic Meteorology and Climatology, Cambridge Univ. Press, p. 422, Cambridge, U.K.
Kopec, B. G., A. M. Lauder, E. S. Posmentier, and X. Feng (2014), The diel cycle of water vapor in west Greenland, J. Geophys. Res. Atmos., 119(1), 9386–9399, doi:10.1002/2014JD021859.
Krinner, G., O. Magand, I. Simmonds, C. Genthon, and J. L. Dufresne (2007), Simulated Antarctic precipitation and surface mass balance at the end of the twentieth and twenty-first centuries, Clim. Dyn., 28(2), 215–230, doi:10.1007/s00382-006-0177-x.
Kurita, N. (2011), Origin of Arctic water vapor during the ice-growing season, Geophys. Res. Lett., 38, L2709, doi:10.1029/2010GL046064. Kurita, N. (2013), Water isotopic variability in response to mesoscale convective system over the tropical ocean, J. Geophys. Res. Atmos., 118,
10,376–10,390, doi:10.1002/jgrd.50754.
Kurita, N., B. D. Newman, L. J. Araguás-Araguás, and P. Aggarwal (2012), Evaluation of continuous water vapor𝛿D and𝛿18O measurements
by off-axis integrated cavity output spectroscopy, Atmos. Meas. Tech., 5, 2069–2080.
Lenaerts, J. T. M., E. Meijgaard, M. R. Broeke, S. R. M. Ligtenberg, M. Horwath, and E. Isaksson (2013), Recent snowfall anomalies in Dronning Maud Land, East Antarctica, in a historical and future climate perspective, Geophys. Res. Lett., 40(1), 2684–2688, doi:10.1002/grl.50559. Lenaerts, J. T. M., M. Vizcaino, J. Fyke, L. Kampenhout, and M. R. Broeke (2016), Present-day and future Antarctic ice sheet climate and surface
mass balance in the Community Earth System Model, Clim. Dyn., 1–15, doi:10.1007/s00382-015-2907-4.
Majoube, M. (1971), Fractionnement en oxygen 18 et en deuterium entre l’eau et sa vapeur, J. Chem. Phys., 10, 1423–1436.
Merlivat, L., and J. Jouzel (1979), Global climatic interpretation of the deuterium-oxygen 18 relationship for precipitation, J. Geophys. Res. Ocean, 84, 5029–5033.
Acknowledgments
This study was supported by JSPS KAKENHI grant 25550022 and grant for Joint Research Program of the Institute of Low Temperature Science, Hokkaido University. We thank Koji Fujita for his valuable comments to improve this paper. We gratefully acknowledge Kevin Hodges for providing the cyclone tracking algorism and the NOAA Air Resources Laboratory (ARL) for the provision of the HYSPLIT transport and dispersion model and the relevant input files for generation of back trajectories. The ERA-Interim data are available via the ECMWF data portal (http://www.ecmwf.int/en/forecast/ datasets). We also thank four anonymous reviewers for constructive comments on the manuscript and Editor, Kim Cobb, for her valuable suggestions. The data are available as indicated in section 2 and otherwise from the authors upon request (nkurita1126@nifty.com).
Geophysical Research Letters
10.1002/2016GL070246
Mo, K. C., and G. H. White (1985), Teleconnections in the Southern Hemisphere, Mon. Weather Rev., 113(1), 22–37,
doi:10.1175/1520-0493(1985)113<0022:TITSH>2.0.CO;2.
Nakamura, K., S. Aoki, K. Yoshimura, and N. Kurita (2014), Distribution of oxygen isotope ratio of precipitation in the Atlantic-Indian sectors of the Southern Ocean, Sci. Online Lett. Atmos., 10, 154–157, doi:10.2151/sola.2014-032.
Noone, D. (2012), Pairing measurements of the water vapor isotope ratio with humidity to deduce atmospheric moistening and dehydration in the tropical midtroposphere, J. Clim., 25(13), 4476–4494, doi:10.1175/JCLI-D-11-00582.1.
Pfahl, S., and H. Sodemann (2014), What controls deuterium excess in global precipitation?, Clim. Past, 10(2), 771–781, doi:10.5194/cp-10-771-2014.
Simmonds, I., K. Keay, and E.-P. Lim (2003), Synoptic activity in the seas around Antarctica, Mon. Weather Rev., 131(2), 272–288,
doi:10.1175/1520-0493(2003)131<0272:SAITSA>2.0.CO;2.
Sodemann, H., and A. Stohl (2009), Asymmetries in the moisture origin of Antarctic precipitation, Geophys. Res. Lett., 36(22), L22803, doi:10.1029/2009GL040242.
Steen-Larsen, H. C., et al. (2013), Continuous monitoring of summer surface water vapor isotopic composition above the Greenland Ice Sheet, Atmos. Chem. Phys., 13(9), 4815–4828, doi:10.5194/acp-13-4815-2013.
Steen-Larsen, H. C., et al. (2014), What controls the isotopic composition of Greenland surface snow?, Clim. Past, 10(1), 377–392, doi:10.5194/cp-10-377-2014.
Stohl, A., and H. Sodemann (2010), Characteristics of atmospheric transport into the Antarctic troposphere, J. Geophys. Res., 115, D02305, doi:10.1029/2009JD012536.
Tietäväinen, H., and T. Vihma (2008), Atmospheric moisture budget over Antarctica and the Southern Ocean based on the ERA-40 reanalysis, Int. J. Climatol., 28(15), 1977–1995, doi:10.1002/joc.1684.
Tsukernik, M., and A. H. Lynch (2013), Atmospheric meridional moisture flux over the Southern Ocean: A story of the Amundsen Sea, J. Clim., 26(20), 8055–8064, doi:10.1175/JCLI-D-12-00381.1.
Uemura, R., Y. Matsui, K. Yoshimura, H. Motoyama, and N. Yoshida (2008), Evidence of deuterium excess in water vapor as an indicator of ocean surface condition, J. Geophys. Res., 113, D19114, doi:10.1029/2008JD010209.
Uotila, P., T. Vihma, and M. Tsukernik (2013), Close interactions between the Antarctic cyclone budget and large-scale atmospheric circulation, Geophys. Res. Lett., 40(12), 3237–3241, doi:10.1002/grl.50560.
Welker, C., O. Martius, P. Froidevaux, C. H. Reijmer, and H. Fischer (2014), A climatological analysis of high-precipitation events in Dronning Maud Land, Antarctica, and associated large-scale atmospheric conditions, J. Geophys. Res. Atmos., 119(2), 11,932–11,954, doi:10.1002/2014JD022259.
Erratum
In the originally published version of Figure 1, open circles showed the locations in the extra-polar ocean where sea surface temperature (SST) exceeded 10∘C. Some open circles appeared inside the cold ocean where SST is colder than 10∘C, and these have been corrected. A description has also been added to the leg-end of Figure 1 to explain contours that represent summer average SST. This version may be considered the authoritative version of record.