EUROPEAN ORGANISATION FOR NUCLEAR RESEARCH (CERN)
Nucl. Phys. A 978 (2018) 65
DOI:10.1016/j.nuclphysa.2018.07.006
CERN-EP-2017-065 6th September 2018
Measurement of jet fragmentation in 5.02 TeV
proton–lead and proton–proton collisions with the
ATLAS detector
The ATLAS Collaboration
A measurement of the fragmentation functions of jets into charged particles in p+Pb colli-sions and pp collicolli-sions is presented. The analysis utilizes 28 nb−1of p+Pb data and 26 pb−1 of pp data, both at √sNN = 5.02 TeV, collected in 2013 and 2015, respectively, with the ATLAS detector at the LHC. The measurement is reported in the centre-of-mass frame of the nucleon–nucleon system for jets in the rapidity range |y∗| <1.6 and with transverse mo-mentum 45 < pT< 260 GeV. Results are presented both as a function of the charged-particle
transverse momentum and as a function of the longitudinal momentum fraction of the particle with respect to the jet. The pp fragmentation functions are compared with results from Monte Carlo event generators and two theoretical models. The ratios of the p+Pb to pp fragmenta-tion funcfragmenta-tions are found to be consistent with unity.
1 Introduction
Heavy-ion collisions at the Large Hadron Collider (LHC) are performed in order to produce and study the quark–gluon plasma (QGP), a phase of strongly interacting matter which emerges at very high energy densities; a recent review can be found in Ref. [1]. Measurements of jets and jet properties in heavy-ion collisions are sensitive to the properties of the QGP. In order to quantify jet modifications in heavy-ion collisions, proton–proton (pp) collisions are often used as a reference system. Using this reference, rates of jet production in Pb+Pb collisions are observed to be reduced compared to that expected from the rates in pp collisions, appropriately scaled to account for the nuclear thickness in Pb+Pb collisions [2,3]. Charged-particle fragmentation functions are also observed to be modified in Pb+Pb collisions compared to pp collisions [4–6]. Both of these effects are interpreted as arising predominantly from the modification of the parton showering process in the final stages of the collision.
In addition to final-state differences emerging from the presence of the hot and dense matter, jet produc-tion in Pb+Pb collisions may also differ from that in pp collisions due to effects arising from the presence of the large nucleus. For example, nucleons bound in a nucleus are expected to have a modified struc-ture compared to the free nucleon [7], and partons may lose energy in the nuclear environment before scattering [8]. Proton–nucleus collisions are used to differentiate between initial- and final-state effects
in Pb+Pb collisions. The inclusive jet production rate in proton–lead (p+Pb) collisions at 5.02 TeV was measured [9–11] at the LHC and found to be only slightly modified after normalization by the nuclear thickness function. Measurements made at the Relativistic Heavy Ion Collider with deuteron–gold col-lisions yield similar results [12] (interestingly, Refs. [9,12] observe a centrality dependence to inclusive jet production). High transverse momentum (pT) charged hadrons originate from the fragmentation of
jets and provide a complementary observable to that of jet production. The CMS Collaboration observed a small excess in the charged-particle spectrum measured in p+Pb collisions for pT > 20 GeV particles
compared to that expected from pp collisions [13]. Measurements of charged-particle fragmentation functions for jets in different pT intervals in p+Pb and pp collisions are crucial for connecting the jet
and charged-particle results. Therefore, the measurements reported here are necessary both to establish a reference for jet fragmentation measurements in Pb+Pb collisions and to determine any modifications to jet fragmentation in p+Pb collisions due to the presence of a large nucleus.
In recent years many of the features of Pb+Pb collisions which were interpreted as final state effects due to hot nuclear matter were also observed in p+Pb collisions at the LHC and in d+Au collisions at RHIC. These features include long-range hadron correlations [14–17] and a centrality-dependent reduction in the quarkonia yields [18–21]. There is considerable debate about whether these features arise from the same source as in Pb+Pb collisions [22] or from other effects such as initial state gluon saturation [23]. Measurements of jets in p+Pb collisions showed no effects that would be attributable to hot nuclear matter, however additional measurements of jet properties in these collisions could help to constrain the source of the modifications observed in other observables.
In this paper, the jet momentum structure in pp and p+Pb collisions is studied using the distributions of charged particles associated with jets which have a transverse momentum pjetT in the range 45 to 260 GeV. Jets are reconstructed with the anti-ktalgorithm [24] using a radius parameter R= 0.4. Charged particles
are assigned to jets via an angular matching∆R < 0.4,1 where ∆R is the angular distance between the
1 ATLAS uses a right-handed coordinate system with its origin at the nominal interaction point (IP) in the centre of the
detector and the z-axis along the beam pipe. The x-axis points from the IP to the centre of the LHC ring, and the y-axis points upward. Cylindrical coordinates (r, φ) are used in the transverse plane, φ being the azimuthal angle around the beam pipe. The pseudorapidity is defined in terms of the polar angle θ as η= − ln tan(θ/2). Rapidity is defined as y = 0.5 lnE+pz
jet axis and the charged-particle position. Results on the fragmentation functions are presented both as a function of the ratio between the component of the particle transverse momentum parallel to the jet direction, and the jet pT, z ≡ pTcos∆R / pjetT ,2 and as a function of the charged-particle transverse
momentum with respect to the beam direction, pT:
D(z) ≡ 1 Njet dNch dz , (1) and D(pT) ≡ 1 Njet dNch dpT . (2)
The quantity Nch is the number of charged particles and Njet is the number of jets under consideration.
The fragmentation functions are per-jet normalized.
The fragmentation functions are compared in p+Pb and pp collisions at a centre-of-mass energy of 5.02 TeV. In order to quantify any difference between p+Pb and pp collisions, the ratios of the frag-mentation functions are measured:
RD(z) ≡ D(z)pPb D(z)pp
. (3)
In Pb+Pb collisions, such measurements are also presented as a function of charged-particle pT [4, 6]
to explore the absolute pT scale of the modifications and to reduce jet-related uncertainties. Thus, in
addition to the more commonly used fragmentation functions as a function of z, this Letter also presents the analogous distributions and their ratios as a function of charged particle pT:
RD(pT)≡
D(pT)pPb
D(pT)pp
. (4)
2 Experimental set-up
The measurements presented here are performed using the ATLAS calorimeter, inner detector, trigger, and data acquisition systems [25]. The calorimeter system consists of a sampling liquid argon (LAr) electromagnetic (EM) calorimeter covering |η| < 3.2, a steel–scintillator sampling hadronic calorimeter covering |η| < 1.7, a LAr hadronic calorimeter covering 1.5 < |η| < 3.2, and two LAr forward calori-meters (FCal) covering 3.2 < |η| < 4.9. The hadronic calorimeter has three sampling layers longitudinal in shower depth. The EM calorimeters are segmented longitudinally in shower depth into three layers plus an additional pre-sampler layer. The EM calorimeter has a granularity that varies with layer and pseudorapidity, but which is generally much finer than that of the hadronic calorimeter. The minimum-bias trigger scintillators (MBTS) [25] detect charged particles over 2.1 < |η| < 3.9 using two segmented counters placed at z = ±3.6 m. Each counter provides measurements of both the pulse heights and the arrival times of ionization energy deposits.
A two-level trigger system was used to select the p+Pb and pp collisions analysed here. The first, the hardware-based trigger stage Level-1, is implemented with custom electronics. The second level is the software-based High Level Trigger (HLT). Jet events were selected by the HLT with Level-1 seeds from
and pzare the energy and the component of the momentum along the beam direction. Angular distance is measured in units
of∆R ≡ p(∆η)2+ (∆φ)2.
jet, minimum-bias, and total-energy triggers. The total-energy trigger required a total transverse energy measured in the calorimeter of greater than 5 GeV. The HLT jet trigger operated a jet reconstruction algorithm similar to that applied in the offline analysis and selected events containing jets with transverse energy thresholds ranging from 20 GeV to 75 GeV in p+Pb collisions and up to 85 GeV in pp collisions. In both the pp and p+Pb collisions, the highest-threshold jet trigger sampled the full delivered luminosity. Minimum-bias p+Pb events were required to have at least one hit in a counter on each side of the MBTS detector at the Level-1 trigger.
The inner detector measures charged-particle tracks within the pseudorapidity interval |η| < 2.5 using a combination of silicon pixel detectors, silicon microstrip detectors (SCT), and a straw-tube transition radiation tracker (TRT), all immersed in a 2 T axial magnetic field [25]. Each of the three detectors is composed of a barrel and two symmetric end-cap sections. The pixel detector is composed of three layers of sensors with a nominal pixel size of 50 µm × 400 µm. Following the p+Pb data-taking and prior to the 5 TeV pp data-taking an additional silicon tracking layer, the “insertable B-layer” (IBL) [26], was installed closer to the interaction point than the other three layers. The SCT barrel section contains four layers of modules with 80 µm pitch sensors on both sides, and each end-cap consists of nine layers of double-sided modules with radial strips having a mean pitch of 80 µm. The two sides of each SCT layer in both the barrel and the end-caps have a relative stereo angle of 40 mrad. The TRT contains up to 73 (160) layers of staggered straws interleaved with fibres in the barrel (end-cap).
3 Event selection and data sets
The p+Pb data used in this analysis were recorded in 2013. The LHC was configured with a 4 TeV proton beam and a 1.57 TeV per nucleon Pb beam producing collisions with √sNN = 5.02 TeV and a rapidity shift of the centre-of-mass frame,∆y = 0.465, relative to the laboratory frame. The data collection was split into two periods with opposite beam configurations. The first period consists of approximately 55% of the integrated luminosity with the Pb beam travelling toward positive rapidity and the proton beam to negative rapidity. The remaining data were taken with the beams of protons and Pb nuclei swapped. The total p+Pb integrated luminosity is 28 nb−1. Approximately 26 pb−1 of √s = 5.02 TeV pp data from 2015 was used. The instantaneous luminosity conditions provided by the LHC resulted in an average number of p+Pb interactions per bunch crossing of 0.03. During pp data-taking, the average number of interactions per bunch crossing varied from 0.6 to 1.3.
The p+Pb events selected are required to have a reconstructed vertex, at least one hit in each MBTS detector, and a time difference measured between the two MBTS sides of less than 10 ns. The pp events used in this analysis are required to have a reconstructed vertex; no requirement on the signal in the MBTS detector is imposed. In p+Pb collisions the event centrality is determined by the FCal in the Pb-going direction as in Ref. [9]. The p+Pb events used here belong to the 0–90% centrality interval.
The performance of the ATLAS detector and offline analysis in measuring fragmentation functions in p+Pb collisions is evaluated using a sample of Monte Carlo (MC) events obtained by overlaying simu-lated hard-scattering pp events generated with Pythia version 6.423 (Pythia6) [27] onto minimum-bias p+Pb events recorded during the same data-taking period. A sample consisting of 2.4×10⁷ ppevents is generated with Pythia6 using parameter values from the AUET2B tune [28] and the CTEQ6L1 parton distribution function (PDF) set [29], at √s = 5.02 TeV and with a rapidity shift equivalent to that in the p+Pb collisions is used in the overlay procedure. About half of the events are simulated with one beam configuration and the second half with the other. The detector response is simulated using GEANT4 [30,
31], and the simulated hits are combined with those from the data event. An additional sample of 2.6×10⁷
pphard-scattering events simulated with Pythia version 8.212 (Pythia8) [32] at √s= 5.02 TeV with the A14 tune [33] and NNPDF23LO PDF set [34] is used to evaluate the performance for measuring frag-mentation functions in the 2015 pp data. Finally, fragfrag-mentation functions at generator-level evaluated from 1.5×10⁷ 5.02 TeV pp events [35] generated with Herwig++ using the UEEE5 tune [36] and the CTEQ6L1 PDFs [29] are compared to the fragmentation function measured in 5.02 TeV pp data.
4 Jet and track selection
Jets are reconstructed with the same heavy-ion jet reconstruction algorithm used in previous measure-ments in p+Pb collisions [9]. The anti-kt algorithm [24] is first run in four-momentum recombination
mode using as input the signal in∆η × ∆φ = 0.1 × 0.1 calorimeter towers with the anti-ktradius parameter
Rset to 0.4 and 0.2 (R= 0.4 jets are used for the main analysis and the R = 0.2 jets are used to improve the jet position resolution as discussed below). The energies in the towers are obtained by summing the energies of calorimeter cells at the electromagnetic energy scale within the tower boundaries. Then, an iterative procedure is used to estimate the layer- and η-dependent underlying event (UE) transverse en-ergy density, while excluding the regions populated by jets. The UE transverse enen-ergy is subtracted from each calorimeter cell and the four-momentum of the jet is updated accordingly. Then, a jet η- and pT
-dependent correction factor derived from the simulation samples is applied to correct the jet momentum for the calorimeter response. Additionally, the jet energies were corrected by a multiplicative factor de-rived in in situ studies of the transverse momentum balance of jets recoiling against photons, Z bosons, and jets in other regions of the calorimeter [37,38]. This in situ calibration, which typically differed from unity by a few percent, accounts for differences between the simulated detector response and data. Jets are required to have jet centre-of-mass rapidity, |y∗jet|< 1.6,3which is the largest symmetric overlap between the two collision systems for which there is full charged-particle tracking coverage within a jet cone of size R= 0.4. To prevent neighbouring jets from distorting the measurement of the fragmentation functions, jets are rejected if there is another jet with higher pTwithin a distance δR= 1.0, where δR is the
distance between the two jet axes. To reduce the effects of the broadening of the jet position measurement due to the UE, for R= 0.4 jets, the jet direction is taken from that of the closest matching R = 0.2 jet within δR= 0.3 when such a matching jet is found (this procedure has been previously used in Ref. [5]). All jets included in the analysis are required to have pT sufficiently large for the jet trigger efficiency
to be higher than 99%. Reconstructed jets which consist only of isolated high-pT electrons [39] from
electroweak bosons are excluded from this analysis.
The MC samples are used to evaluate the jet reconstruction performance and to correct the measured distributions for detector effects. The p+Pb jet reconstruction performance is described in Ref. [9]; the jet reconstruction performance in pp collisions is found to be similar to that in p+Pb collisions. In the MC samples, the kinematics of the particle-level jets are reconstructed from primary particles4with the anti-kt
algorithm with radius parameter R= 0.4. In these studies, particle-level jets are matched to reconstructed jets with a∆R < 0.2.
3The jet centre-of-mass rapidity y∗
jetis defined as y ∗
jet≡yjet−∆y where yjetis the jet rapidity in the ATLAS rest frame and∆y
is the rapidity shift of the centre-of-mass frame.
4Primary particles are defined as particles with a mean lifetime τ > 0.3 × 10⁻¹⁰s either directly produced in pp interactions or
Tracks used in the analysis of p+Pb collisions are required to have at least one hit in the pixel detector and at least six hits in the SCT. Tracks used in the analysis of pp collisions are required to have at least 9 or 11 total silicon hits for|η| < 1.65 or |η| > 1.65, respectively, including both the pixel layers and the SCT. This includes a hit in the first (first or second) pixel layer if expected from the track trajectory for the p+Pb (pp) data. All tracks used in this analysis are required to have pT > 1 GeV. In order to suppress the
contribution of secondary particles, the distance of closest approach of the track to the primary vertex is required to be less than 1.5 mm along the beam axis and less than a value which varies from approximately 0.6 mm at pT= 1 GeV to approximately 0.2 mm at pT= 20 GeV in the transverse plane.
[GeV] truth T p 1 10 102 Tracking efficiency 0.4 0.5 0.6 0.7 0.8 0.9 1 1.1 ATLAS Simulation = 5.02 TeV s pp < -1.0 truth η -2.0 < < 1.0 truth η -1.0 < < 2.0 truth η 1.0 < [GeV] truth T p 1 10 102 Tracking efficiency 0.4 0.5 0.6 0.7 0.8 0.9 1 1.1 ATLAS Simulation = 5.02 TeV NN s +Pb p < -2.0 truth η -2.5 < < -1.0 truth η -2.0 < < 1.0 truth η -1.0 < < 2.0 truth η 1.0 <
Figure 1: Tracking efficiency as a function the primary particle momentum at generation level, ptruth
T , in pp collisions
(left) and in p+Pb collisions for one of the two beam configurations (right). The different sets of points show the
primary particle pseudorapidity, ηtruth, intervals in which the track reconstruction efficiency has been performed.
The different ηtruthintervals in pp and p+Pb plots reflect the different regions of the tracking system used in the two
cases due to the boosted p+Pb system. The solid curves show parameterizations of efficiencies.
The efficiency for reconstructing charged particles within jets in p+Pb and pp collisions is evaluated using Pythia6 and Pythia8 MC samples, respectively, and is computed by matching the reconstructed tracks to generator-level primary particles. The association is done based on contributions of generator-level particles to the hits in the detector layers. A reconstructed track is matched to a generator-level particle if it contains hits produced primarily by this particle [31]. The efficiencies are determined separately for the
two p+Pb running configurations because the η regions of the detector used for the track measurement are different for the two beam configurations. The charged-particle reconstruction efficiencies as a function of the primary particle’s transverse momentum, ptruthT , in coarse ηtruthintervals, are shown in Figure1in ppand p+Pb collisions. The ptruthT dependence of the efficiencies is parameterized using a fifth-order polynomial in log(ptruthT ) which describes the efficiency behaviour in the range of particle ptruthT from 1.0 to 150 GeV. The tracking efficiency is observed to be constant above 150 GeV and a constant efficiency value is used for particles with ptruthT > 150 GeV due to the limited size of the MC samples in that phase space region. To account for finer scale variations of the tracking efficiency with pseudorapidity, the parameterizations are multiplied by an η-dependent scale factor evaluated in ηtruth intervals of 0.1 units in coarse ptruthT intervals. The dependence of the charged-particle efficiency on pjetT is found to be negligible for the pjetT selections used here. The measured D(z) and D(pT) distributions are corrected for
the contribution of reconstructed “fake” tracks which cannot be matched to a generated primary particle in the MC samples produced without minimum bias interactions overlaid and the residual contribution of tracks matched to secondary particles. The fraction of secondary and fake tracks is found to be below 2% of the tracks that pass the selection in any track and jet kinematic region. The contribution from these tracks to the fragmentation functions is subtracted from the measured fragmentation functions in both the
ppand p+Pb collisions.
5 Analysis procedure
Reconstructed charged particle tracks are associated with a reconstructed jet if they fall within ∆R = 0.4 of the jet axis. For each of these particles the momentum fraction, z, is calculated. The measured fragmentation functions are constructed as:
D(z)meas≡ 1 Njet 1 ε(η, pT) ∆Nch(z) ∆z (5) and D(pT)meas≡ 1 Njet 1 ε(η, pT) ∆Nch(pT) ∆pT , (6)
where ε(η, pT) is the track reconstruction efficiency, and Njet is the total number of jets in a given pjetT
bin. The quantities∆Nch(z) and∆Nch(pT) are the numbers of associated tracks within the given z or pT
range, respectively. The efficiency correction is applied on a track-by-track basis, assuming pT = ptruthT .
While that assumption is not strictly valid, the efficiency varies sufficiently slowly with ptruthT that the error introduced by this assumption is negligible.
In p+Pb collisions the UE contribution to the fragmentation functions from charged particles not asso-ciated with the jet constitutes a background that needs to be subtracted. It originates in soft interactions that accompany the hard process in the same p+Pb collision and depends on charged-particle pT and η.
This background is determined event by event for each measured jet by using a grid of∆R = 0.4 cones that span the full coverage of the inner detector. The cones have a fixed distance between their centres chosen such that the coverage of the inner detector is maximized while the cones do not overlap each other. Any such cone containing a charged particle with pT > 3.5 GeV is assumed to be associated with
a real jet and is excluded from the UE contribution. The 3.5 GeV threshold is derived from studies of UE contribution in MC samples. The estimated contribution from UE particles in each cone is corrected to account for differences in the average UE particle yield at a given pT between the η position of the
cone and the η position of the jet. The correction is based on a parameterization of the pT and η
depend-ence of charged-particle yields in minimum-bias collisions. The resulting UE contribution is evaluated for charged particles in the transverse momentum interval of 1 < pT < 3.5 GeV and averaged over all
cones. The UE contribution is further corrected for the correlation between the actual UE yield within the jet cone and the jet energy resolution discussed in Ref. [5]. This effect is corrected by a multiplicative
correction factor, dependent on the track pT (or z) and the jet pT. The correction is estimated in MC
samples as the ratio of the UE contribution calculated from tracks within the area of a jet that do not have an associated generator-level particle to the UE contribution estimated by the cone method. Corrected UE contributions are then subtracted from measured distributions. The maximum size of the UE contribution is 20% for the lowest track pT (or z). The UE from the cone method is compared to an alternative UE
estimation and the difference is found to be negligible. The subtracted UE contribution has no azimuthal variation in p+Pb collisions and no UE subtraction is performed for the pp measurement due to negligible UE contribution (less than 2% over the entire kinematic range measured).
The measured D(z) and D(pT) distributions are corrected for detector effects by means of a two-dimensional
the effect of bin migration due to the jet energy and the track momentum resolutions. Using the MC samples, four-dimensional response matrices are created using the particle-level and reconstructed pjetT, and generator-level and reconstructed track pT (z). Separate unfolding matrices are constructed for the
p+Pb and pp data. An independent bin-by-bin unfolding procedure is used to correct the measured pjetT spectra, which is used to normalize the unfolded fragmentation functions by the number of jets. The response matrices are reweighted such that the shapes of the measured fragmentation functions and jet spectra in the simulation match those in the data. The number of iterations in the Bayesian unfolding is selected to be the minimum number for which the relative change in the fragmentation function at z = 0.1 is smaller than 0.2% per additional iteration in all pjetT bins. This condition ensures the stability of the unfolding and minimizes statistical fluctuations due to the unfolding in the high z and pT regions.
The resulting number of iterations is driven by the low pjetT intervals, which require the most iterations to converge. The systematic uncertainty due to the unfolding is typically much larger than the impact of the stability requirement, especially for the lowest pjetT values used in this analysis (discussed in Section6). Following this criterion, 14 iterations are used for both the p+Pb and pp data sets. The analysis procedure is tested by dividing the MC event sample in half and using one half to generate response matrices with which the other half is unfolded. Good recovery of the generator-level distributions is observed for the unfolded events and the deviations from perfect closure are incorporated into the systematic uncertain-ties.
6 Systematic uncertainties
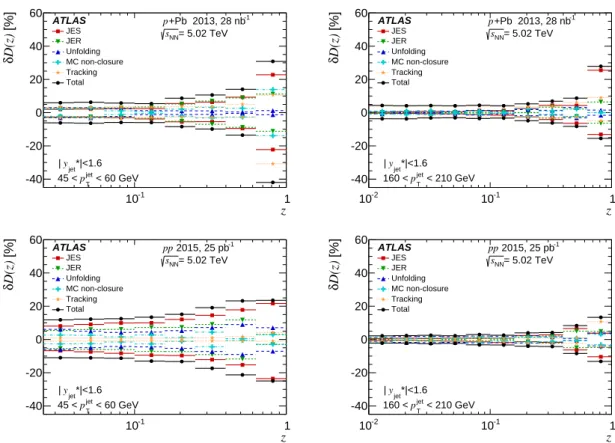
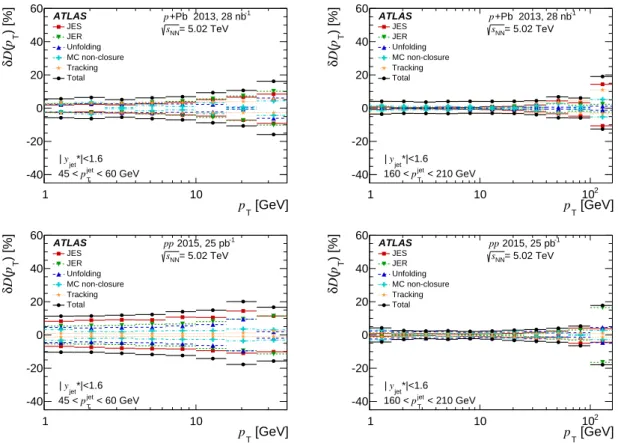
The systematic uncertainties in the measurement of the fragmentation functions and their ratios are de-scribed in this section. The following sources of systematic uncertainty in the measurement of the frag-mentation functions and their ratios are considered: the jet energy scale (JES), the jet energy resolution (JER), the dependence of the unfolded results on the choice of the starting MC distributions, the residual non-closure of the unfolding and the tracking-related uncertainties. For each variation reflecting a sys-tematic uncertainty the fragmentation functions are re-evaluated and the difference between the varied and nominal fragmentation functions is used as an estimate of the uncertainty. The systematic uncertain-ties in the D(z) and D(pT) measurements in both collision systems are summarized in Figures2 and3,
respectively, for two different jet pT bins. The systematic uncertainties from each source are taken as
uncorrelated and combined in quadrature to obtain the total systematic uncertainty.
The JES uncertainty is determined from in situ studies of the calorimeter response [37,42,43], and studies of the relative energy-scale difference between the jet reconstruction procedure in heavy-ion collisions and the procedure used in pp collisions [44]. The impact of the JES uncertainty on the measured distributions is evaluated by constructing new response matrices where all reconstructed jet transverse momenta are shifted by ±1 standard deviation (±1σ) of the JES uncertainty. The data are then unfolded with these matrices. Each component that contributes to the JES uncertainty is varied separately. In total, 45 and 51 independent systematic components constitute the full JES uncertainty in the analysis of p+Pb and ppcollisions, respectively. These components are uncorrelated among each other within the data set and fully correlated across pTand η. The JES uncertainty increases with increasing z and particle pTat fixed
pjetT and decreases with increasing pjetT .
The uncertainty in the fragmentation functions due to the JER is estimated by repeating the unfolding procedure with modified response matrices, where the resolution of the reconstructed jet pjetT is broadened by Gaussian smearing. The smearing factor is evaluated using an in situ technique involving studies of
z -1 10 1 [%] D(z) δ -40 -20 0 20 40 60 JES JER Unfolding MC non-closure Tracking Total *|<1.6 jet y | ATLAS = 5.02 TeV NN s -1 +Pb 2013, 28 nb p < 60 GeV jet T p 45 < z -2 10 10-1 1 [%] D(z) δ -40 -20 0 20 40 60 JES JER Unfolding MC non-closure Tracking Total *|<1.6 jet y | ATLAS = 5.02 TeV NN s -1 +Pb 2013, 28 nb p < 210 GeV jet T p 160 < z -1 10 1 [%] D(z) δ -40 -20 0 20 40 60 JES JER Unfolding MC non-closure Tracking Total *|<1.6 jet y | ATLAS = 5.02 TeV NN s -1 2015, 25 pb pp < 60 GeV jet T p 45 < z -2 10 10-1 1 [%] D(z) δ -40 -20 0 20 40 60 JES JER Unfolding MC non-closure Tracking Total *|<1.6 jet y | ATLAS = 5.02 TeV NN s -1 2015, 25 pb pp < 210 GeV jet T p 160 <
Figure 2: Summary of the systematic uncertainties in the fragmentation function, D(z), in p+Pb collisions (top) and
ppcollisions (bottom) for jets in the 45–60 GeV pjetT interval (left) and in the 160–210 GeV pjetT interval (right). The
systematic uncertainties due to JES, JER, unfolding, MC non-closure and tracking are shown along with the total systematic uncertainty from all sources.
dijet energy balance [45,46]. The systematic uncertainty due to the JER increases with increasing z and particle pTat fixed pjetT and decreases with increasing pjetT.
The unfolding uncertainty is estimated by generating the response matrices from the MC distributions without reweighting to match the shapes of the reconstructed data in pjetT and D(z) or D(pT).
Conser-vatively, an additional uncertainty to account for possible residual limitations in the analysis procedure was assigned by evaluating the non-closure of the unfolded distributions in simulations, as described in Section5. The magnitude of both of these uncertainties is typically below 5% except for the highest z and track pTbins.
The uncertainties related to the track reconstruction and selection originate from several sources. Uncer-tainties related to the rate of secondary and fake tracks, the material description in the simulation, and the track’s transverse momentum were obtained from studies in data and simulation described in Ref. [47]. The systematic uncertainty in the secondary-track and fake-track rate is 30% in pp collisions and 50% in p+Pb. The contamination by secondary and fake tracks is at most 2%, the resulting uncertainty in the fragmentation functions is at most 1%. The sensitivity of the tracking efficiency to the description of the inactive material in the MC samples is evaluated by varying the material description. This uncertainty is between 0.5 and 2% (depending on track η) in the track pTrange used in the analysis. Uncertainty in the
[GeV] T p 1 10 ) [%] T p ( D δ -40 -20 0 20 40 60 JES JER Unfolding MC non-closure Tracking Total *|<1.6 jet y | ATLAS = 5.02 TeV NN s -1 +Pb 2013, 28 nb p < 60 GeV jet T p 45 < [GeV] T p 1 10 102 ) [%] T p ( D δ -40 -20 0 20 40 60 JES JER Unfolding MC non-closure Tracking Total *|<1.6 jet y | ATLAS = 5.02 TeV NN s -1 +Pb 2013, 28 nb p < 210 GeV jet T p 160 < [GeV] T p 1 10 ) [%] T p ( D δ -40 -20 0 20 40 60 JES JER Unfolding MC non-closure Tracking Total *|<1.6 jet y | ATLAS = 5.02 TeV NN s -1 2015, 25 pb pp < 60 GeV jet T p 45 < [GeV] T p 1 10 102 ) [%] T p ( D δ -40 -20 0 20 40 60 JES JER Unfolding MC non-closure Tracking Total *|<1.6 jet y | ATLAS = 5.02 TeV NN s -1 2015, 25 pb pp < 210 GeV jet T p 160 <
Figure 3: Summary of the systematic uncertainties in the fragmentation function, D(pT), in p+Pb collisions (top)
and pp collisions (bottom) for jets in the 45–60 GeV pjetT interval (left) and in the 160–210 GeV pjetT interval (right).
The systematic uncertainties due to JES, JER, unfolding, MC non-closure and tracking are shown along with the total systematic uncertainty from all sources.
in this analysis. The uncertainty due to the track selection criteria is evaluated by repeating the analysis with an additional requirement on the significance of the distance of closest approach of the track to the primary vertex. This uncertainty affects both the track reconstruction efficiency and the rate of secondary and fake tracks. The resulting uncertainty typically varies from 1% at low track pTand low z to 5% at high
track pTand high z. The systematic uncertainties in the fragmentation functions due to the
parameteriza-tion of the efficiency corrections is less than 1%. An additional uncertainty takes into account a possible residual misalignment of the tracking detectors in pp data-taking. The alignment in this data was checked in situwith Z → µ+µ−events, and thus a track-pTdependent uncertainty arises from the finite size of this
sample. The resulting uncertainties in the fragmentation functions are typically smaller than 1% except at large z where they are as large as 4%. Finally, the track-to-particle matching requirements are varied. This variation affects the track reconstruction efficiency, the track momentum resolution, and the rate of secondary and fake tracks. The resulting uncertainties in the fragmentation functions are smaller than 1%. After deriving new response matrices and efficiency corrections, the resulting systematic uncertainty in the fragmentation functions is found to be less than 0.5%. The tracking uncertainties shown in Figures2
and3include all the above explained track-related systematic uncertainties added in quadrature.
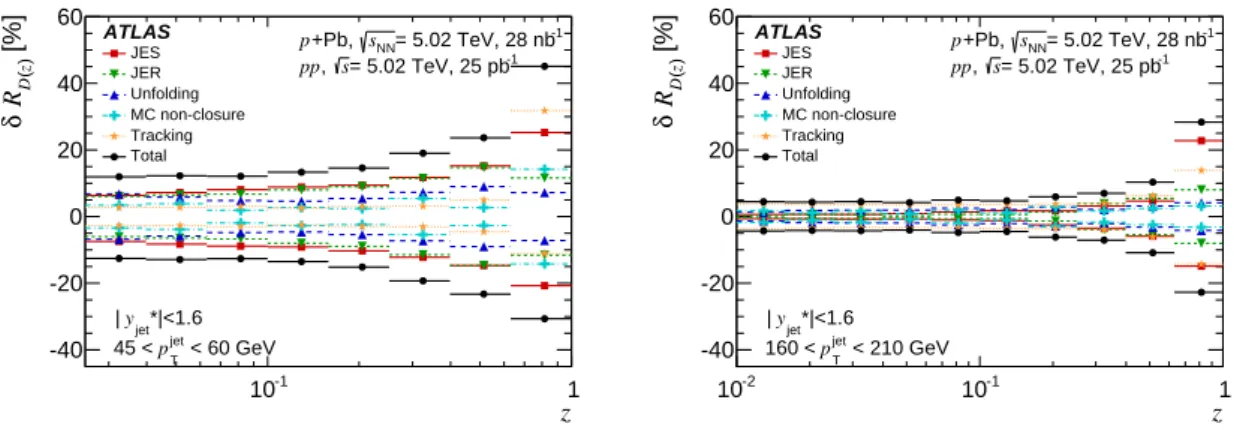
The correlations between the various systematic components in the two collision systems are considered when taking the ratios of p+Pb to pp fragmentation functions. For the JES uncertainty, each source of uncertainty is classified as either correlated or uncorrelated between the two systems depending on
z -1 10 1 [%])z ( D R δ -40 -20 0 20 40 60 JES JER Unfolding MC non-closure Tracking Total *|<1.6 jet y | ATLAS -1 = 5.02 TeV, 28 nb NN s +Pb, p -1 = 5.02 TeV, 25 pb s , pp < 60 GeV jet T p 45 < z -2 10 10-1 1 [%])z ( D R δ -40 -20 0 20 40 60 JES JER Unfolding MC non-closure Tracking Total *|<1.6 jet y | ATLAS -1 = 5.02 TeV, 28 nb NN s +Pb, p -1 = 5.02 TeV, 25 pb s , pp < 210 GeV jet T p 160 <
Figure 4: Summary of the systematic uncertainties for RD(z)ratios, for jets in the 45–60 GeV pT interval (left) and
in the 160–210 GeV pTinterval (right). The systematic uncertainties due to JES, JER, unfolding, MC non-closure
and tracking are shown along with the total systematic uncertainty from all sources.
[GeV] T p 1 10 [%])T p ( D R δ -40 -20 0 20 40 60 JES JER Unfolding MC non-closure Tracking Total *|<1.6 jet y | ATLAS -1 = 5.02 TeV, 28 nb NN s +Pb, p -1 = 5.02 TeV, 25 pb s , pp < 60 GeV jet T p 45 < [GeV] T p 1 10 102 [%])T p ( D R δ -40 -20 0 20 40 60 JES JER Unfolding MC non-closure Tracking Total *|<1.6 jet y | ATLAS -1 = 5.02 TeV, 28 nb NN s +Pb, p -1 = 5.02 TeV, 25 pb s , pp < 210 GeV jet T p 160 <
Figure 5: Summary of the systematic uncertainties for RD(pT)ratios, for jets in the 45–60 GeV pTinterval (left) and
in the 160–210 GeV pTinterval (right). The systematic uncertainties due to JES, JER, unfolding, MC non-closure
and tracking are shown along with the total systematic uncertainty from all sources.
its origin. The JER, unfolding and MC non-closure uncertainties are taken to be uncorrelated. For the tracking-related uncertainties the variation in the selection requirements, tracking in dense environments, secondary-track and fake-track rates, and parameterization of the efficiency corrections are taken as un-correlated. The first three of these are conservatively considered as uncorrelated because the tracking system was augmented with the IBL and the tracking algorithm changed between the p+Pb and pp data-taking periods. The uncertainties due to the track-to-particle matching and the inactive material in the MC samples are taken as correlated between p+Pb and pp collisions. For the correlated uncertainties the ratios are re-evaluated applying the variation to both collision systems; the resulting variations of the ratios from their central values is used as the correlated systematic uncertainty. The total systematic uncertainties in the RD(z)and RD(pT)distributions are shown in Figures4and5, respectively, for two p
jet T
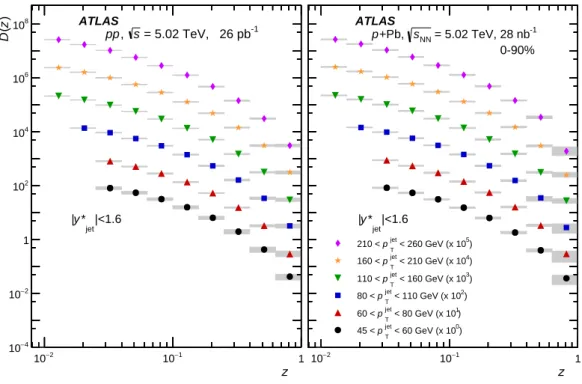
z 2 − 10 10−1 1 ) z( D 4 − 10 2 − 10 1 2 10 4 10 6 10 8 10 -1 = 5.02 TeV, 26 pb s , pp |<1.6 jet * y | ATLAS z 2 − 10 10−1 1 ) 5 < 260 GeV (x 10 jet T p 210 < ) 4 < 210 GeV (x 10 jet T p 160 < ) 3 < 160 GeV (x 10 jet T p 110 < ) 2 < 110 GeV (x 10 jet T p 80 < ) 1 < 80 GeV (x 10 jet T p 60 < ) 0 < 60 GeV (x 10 jet T p 45 < -1 = 5.02 TeV, 28 nb NN s +Pb, p 0-90% |<1.6 jet * y | ATLAS
Figure 6: Fragmentation functions as a function of the charged particle z in pp (left) and p+Pb collisions (right)
for the pjetT intervals used in this analysis. The fragmentation functions in both collision systems are offset by
multiplicative factors for clarity as noted in the legend. The statistical uncertainties are shown as error bars and the systematic uncertainties are shown as shaded boxes. In many cases the statistical uncertainties are smaller than the marker size.
7 Results
The D(z) and D(pT) distributions in both collision systems are shown in Figures 6and7, respectively.
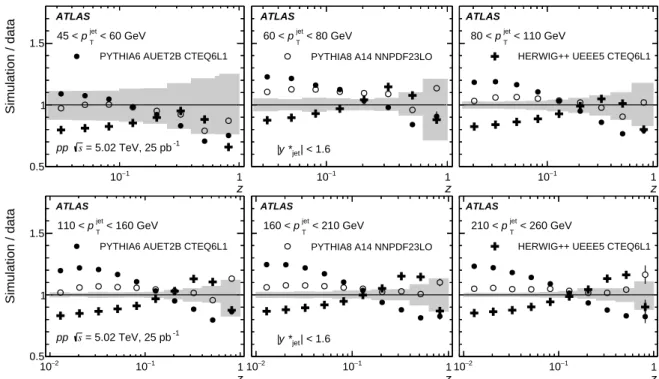
Figure8compares the D(z) distribution in pp collisions at 5.02 TeV to the predictions from three event generators (Pythia6, Pythia8, and Herwig++) using the parameter-value tunes and PDF sets described in Section3 for the six pjetT intervals. The Pythia8 generator provides the best description of the data, generally agreeing within about 5 to 10% over the kinematic range used here. Pythia6 agrees within approximately 25% when compared to the data and Herwig++ agrees within approximately 20% except for the highest z region, where there are some larger deviations. Similar agreement with Pythia6 and Herwig++ generators with different tunes than used in this analysis was reported by ATLAS in the meas-urement of fragmentation functions in 7 TeV pp collisions [49]. The tunes of Pythia6 and Pythia8 used here include the results from that measurement.
Figure9shows the pp fragmentation functions compared to two theoretical calculations. These predic-tions use a slightly different definition of z compared to the definition used in this measurement. This can introduce a difference between the fragmentation functions of approximately 1%. The calculation in Refs. [50,51] provides fragmentation functions with next-to-leading-order (NLO) accuracy as well as a resummation of logarithms in the jet cone size. The calculation in Ref. [52] is at NLO and uses the
[GeV] T p 1 10 102 ] -1 ) [GeV T p( D 4 − 10 2 − 10 1 2 10 4 10 6 10 8 10 |<1.6 jet * y | ATLAS = 5.02 TeV s , pp -1 25 pb ) 5 < 260 GeV (x 10 jet T p 210 < ) 4 < 210 GeV (x 10 jet T p 160 < ) 3 < 160 GeV (x 10 jet T p 110 < ) 2 < 110 GeV (x 10 jet T p 80 < ) 1 < 80 GeV (x 10 jet T p 60 < ) 0 < 60 GeV (x 10 jet T p 45 < [GeV] T p 1 10 102 ) T p D( |<1.6 jet * y | ATLAS = 5.02 TeV, 0-90% NN s +Pb, p -1 28 nb
Figure 7: Fragmentation functions as a function of the charged particle pTin pp (left) and p+Pb collisions (right)
for the pjetT intervals used in this analysis. The fragmentation functions in both collision systems are offset by
multiplicative factors for clarity as noted in the legend. The statistical uncertainties are shown as error bars and the systematic uncertainties are shown as shaded boxes. In many cases the statistical uncertainties are smaller than the marker size.
proximation that the jet cone is narrow. For the parton-to-charged-hadron fragmentation functions, both calculations use DSS07 fragmentation functions [53]. The uncertainties in the theoretical calculation are not estimated, including the uncertainty in DSS07, which is common to both calculations. The calcula-tions are systematically higher than the data and generally agree within 20–30%. Larger deviacalcula-tions are observed at the low and high z regions. The DSS07 fragmentation functions have a minimum z of 0.05 and the calculations use extrapolated fragmentation functions in the region below z= 0.05.
Figures10and11show the ratios of fragmentation functions in p+Pb collisions to those in pp collisions, as a function of z and pT respectively for pjetT from 45 to 260 GeV. Over the kinematic range selected
here, the RD(z)and RD(pT)distributions show deviations from unity of up to approximately 5% (up to 10%
for 60–80 GeV jet selections) for z < 0.1 and pT < 10 GeV. The deviations are larger than the reported
systematic uncertainties by at most a couple of percent and always less than 1.5σ of the systematic uncertainties. At higher z and pTvalues the ratios are consistent with unity. At the highest z points for the
160–210 GeV and 210–260 GeV jet selections, deviations from unity of approximately 0.9σ and 1.3σ of combined statistical and systematic uncertainties, respectively, are observed. This is not observed in the D(pT) distributions. In most pjetT bins there is a slight decrease of the central values of RD(z)and RD(pT)
z 1 − 10 1 Simulation / data 0.5 1 1.5
PYTHIA6 AUET2B CTEQ6L1
< 60 GeV jet T p 45 < ATLAS -1 = 5.02 TeV, 25 pb s pp z 1 − 10 1 Simulation / data
PYTHIA8 A14 NNPDF23LO
< 80 GeV jet T p 60 < | < 1.6 jet * y | ATLAS z 1 − 10 1 Simulation / data
HERWIG++ UEEE5 CTEQ6L1
< 110 GeV jet T p 80 < ATLAS z 2 − 10 10−1 1 Simulation / data 0.5 1 1.5
PYTHIA6 AUET2B CTEQ6L1
< 160 GeV jet T p 110 < ATLAS -1 = 5.02 TeV, 25 pb s pp z 2 − 10 10−1 1 Simulation / data
PYTHIA8 A14 NNPDF23LO
< 210 GeV jet T p 160 < | < 1.6 jet * y | ATLAS z 2 − 10 10−1 1 Simulation / data
HERWIG++ UEEE5 CTEQ6L1
< 260 GeV jet T p 210 < ATLAS
Figure 8: Ratios of the particle-level D(z) distributions from Pythia6, Pythia8, and Herwig++ to the unfolded pp
data for the six pjetT intervals used in this analysis. The statistical uncertainties are shown as error bars and the
systematic uncertainties in the data are shown as the shaded region around unity. In many cases the statistical uncertainties are smaller than the marker size.
z 1 − 10 1 Theory / data 0.5 1 1.5 jet < 60 GeV T p 45 < ATLAS -1 = 5.02 TeV, 25 pb s pp z 1 − 10 1 Theory / data < 80 GeV jet T p 60 < | < 1.6 jet * y | ATLAS z 1 − 10 1 Theory / data Kang et al. Kaufmann et al. < 110 GeV jet T p 80 < ATLAS z 2 − 10 10−1 1 Theory / data 0.5 1 1.5 110 < p jet T < 160 GeV ATLAS -1 = 5.02 TeV, 25 pb s pp z 2 − 10 10−1 1 Theory / data < 210 GeV jet T p 160 < | < 1.6 jet * y | ATLAS z 2 − 10 10−1 1 Theory / data Kang et al. Kaufmann et al. < 260 GeV jet T p 210 < ATLAS
Figure 9: Ratios of theoretical calculations from Refs. [50,51] (solid points) and Ref. [52] (open points) to the
un-folded pp D(z) distributions for the six pjetT intervals used in this analysis. The statistical uncertainties are shown as
error bars and the systematic uncertainties in the data are shown as the shaded region around unity. The uncertainties in the theoretical calculations are not shown.
z 1 − 10 1 ) z( D R 0.6 0.8 1 1.2 1.4 < 60 GeV jet T p 45 < |<1.6 jet * y | ATLAS z 1 − 10 1 ) z( D R < 80 GeV jet T p 60 < ATLAS , 0-90% -1 = 5.02 TeV, 28 nb NN s +Pb, p -1 = 5.02 TeV, 25 pb s , pp z 1 − 10 1 ) z( D R < 110 GeV jet T p 80 < ATLAS z 2 − 10 10−1 1 ) z( D R 0.6 0.8 1 1.2 1.4 < 160 GeV jet T p 110 < |<1.6 jet * y | ATLAS z 2 − 10 10−1 1 ) z( D R < 210 GeV jet T p 160 < ATLAS , 0-90% -1 = 5.02 TeV, 28 nb NN s +Pb, p -1 = 5.02 TeV, 25 pb s , pp z 2 − 10 10−1 1 ) z( D R < 260 GeV jet T p 210 < ATLAS
Figure 10: Ratios of fragmentation functions as a function of the charged particle z in p+Pb collisions to those in
ppcollisions for the six pjetT intervals. The statistical uncertainties are shown as error bars and the total systematic
uncertainties are shown as shaded boxes.
[GeV] T p 1 10 ) T p( D R 0.6 0.8 1 1.2 1.4 < 60 GeV jet T p 45 < |<1.6 jet * y | ATLAS [GeV] T p 1 10 ) T p( D R < 80 GeV jet T p 60 < ATLAS , 0-90% -1 = 5.02 TeV, 28 nb NN s +Pb, p -1 = 5.02 TeV, 25 pb s , pp [GeV] T p 1 10 ) T p( D R < 110 GeV jet T p 80 < ATLAS [GeV] T p 1 10 102 ) T p( D R 0.6 0.8 1 1.2 1.4 < 160 GeV jet T p 110 < |<1.6 jet * y | ATLAS [GeV] T p 1 10 102 ) T p( D R < 210 GeV jet T p 160 < ATLAS , 0-90% -1 = 5.02 TeV, 28 nb NN s +Pb, p -1 = 5.02 TeV, 25 pb s , pp [GeV] T p 1 10 102 ) T p( D R < 260 GeV jet T p 210 < ATLAS
Figure 11: Ratios of fragmentation functions as a function of the charged particle pTin p+Pb collisions to those in
ppcollisions for the six pjetT intervals. The statistical uncertainties are shown as error bars and the total systematic
8 Summary
This paper presents the first measurement of the jet charged-particle fragmentation functions in a p+A collisions system. The jet charged-particle fragmentation functions are reported for |y∗jet| < 1.6 and pjetT from 45 to 260 GeV in √sNN = 5.02 TeV p+Pb and pp collisions with the ATLAS detector at the LHC. The measurement utilizes 28 nb−1 of p+Pb data and 26 pb−1of pp data. The pp fragmentation func-tions are compared to predicfunc-tions from the Pythia6, Pythia8 and Herwig++ generators. The generators show deviations from the pp data of up to approximately 25%, depending on z and the choice of gen-erator. Pythia8 with the A14 tune and NNPDF23LO PDF set matches the data most closely. The pp D(z) distributions are also compared to two theoretical calculations based on next-to-leading-order QCD and DSS07 fragmentation functions. The calculations are systematically higher than the data and agree generally within 20–30%, with larger deviations at small and large values of z. These measurements help constrain jet fragmentation in pp collisions. The ratios of fragmentation functions in p+Pb collisions to those in pp collisions show no evidence for modification of jet fragmentation in p+Pb collisions. This measurement provides new constraints on the modifications to jets in p+Pb collisions at the LHC and is directly relevant to the current investigations into the properties of small collision systems. Finally, these measurements of jet fragmentation functions for different intervals of jet transverse momentum provide necessary baseline measurements for quantifying the effects of the quark-gluon plasma in Pb+Pb collisions.
Acknowledgments
We thank CERN for the very successful operation of the LHC, as well as the support staff from our institutions without whom ATLAS could not be operated efficiently.
We acknowledge the support of ANPCyT, Argentina; YerPhI, Armenia; ARC, Australia; BMWFW and FWF, Austria; ANAS, Azerbaijan; SSTC, Belarus; CNPq and FAPESP, Brazil; NSERC, NRC and CFI, Canada; CERN; CONICYT, Chile; CAS, MOST and NSFC, China; COLCIENCIAS, Colombia; MSMT CR, MPO CR and VSC CR, Czech Republic; DNRF and DNSRC, Denmark; IN2P3-CNRS, CEA-DRF/IRFU, France; SRNSFG, Georgia; BMBF, HGF, and MPG, Germany; GSRT, Greece; RGC, Hong Kong SAR, China; ISF, I-CORE and Benoziyo Center, Israel; INFN, Italy; MEXT and JSPS, Ja-pan; CNRST, Morocco; NWO, Netherlands; RCN, Norway; MNiSW and NCN, Poland; FCT, Portugal; MNE/IFA, Romania; MES of Russia and NRC KI, Russian Federation; JINR; MESTD, Serbia; MSSR, Slovakia; ARRS and MIZŠ, Slovenia; DST/NRF, South Africa; MINECO, Spain; SRC and Wallen-berg Foundation, Sweden; SERI, SNSF and Cantons of Bern and Geneva, Switzerland; MOST, Taiwan; TAEK, Turkey; STFC, United Kingdom; DOE and NSF, United States of America. In addition, indi-vidual groups and members have received support from BCKDF, the Canada Council, CANARIE, CRC, Compute Canada, FQRNT, and the Ontario Innovation Trust, Canada; EPLANET, ERC, ERDF, FP7, Horizon 2020 and Marie Skłodowska-Curie Actions, European Union; Investissements d’Avenir Labex and Idex, ANR, Région Auvergne and Fondation Partager le Savoir, France; DFG and AvH Foundation, Germany; Herakleitos, Thales and Aristeia programmes co-financed by EU-ESF and the Greek NSRF; BSF, GIF and Minerva, Israel; BRF, Norway; CERCA Programme Generalitat de Catalunya, Generalitat Valenciana, Spain; the Royal Society and Leverhulme Trust, United Kingdom.
The crucial computing support from all WLCG partners is acknowledged gratefully, in particular from CERN, the ATLAS Tier-1 facilities at TRIUMF (Canada), NDGF (Denmark, Norway, Sweden), CC-IN2P3 (France), KIT/GridKA (Germany), INFN-CNAF (Italy), NL-T1 (Netherlands), PIC (Spain), ASGC (Taiwan), RAL (UK) and BNL (USA), the Tier-2 facilities worldwide and large non-WLCG resource pro-viders. Major contributors of computing resources are listed in Ref. [54].
References
[1] G. Roland, K. Safarik and P. Steinberg, Heavy-ion collisions at the LHC,
Prog. Part. Nucl. Phys. 77 (2014) 70.
[2] ATLAS Collaboration, Measurements of the Nuclear Modification Factor for Jets in Pb+Pb Collisions at √sNN = 2.76 TeV with the ATLAS Detector,Phys. Rev. Lett. 114 (2015) 072302,
arXiv:1411.2357 [hep-ex]. [3] CMS Collaboration,
Measurement of inclusive jet cross-sections in pp and PbPb collisions at √sNN=2.76 TeV,
Phys. Rev. C 96 (2017) 015202, arXiv:1609.05383 [nucl-ex].
[4] ATLAS Collaboration, Measurement of inclusive jet charged-particle fragmentation functions in Pb+Pb collisions at √sNN = 2.76 TeV with the ATLAS detector,Phys. Lett. B 739 (2014) 320,
[5] ATLAS Collaboration, Measurement of internal structure of jets in Pb+Pb collisions at √
sNN = 2.76 TeV with the ATLAS detector at the LHC,Eur. Phys. J. C 77 (2017) 379,
arXiv:1702.00674 [hep-ex]. [6] CMS Collaboration,
Measurement of jet fragmentation in PbPb and pp collisions at √sNN = 2.76 TeV,
Phys. Rev. C 90 (2014) 024908, arXiv:1406.0932 [nucl-ex].
[7] C. Salgado, J. Alvarez-Muniz, F. Arleo, N. Armesto, M. Botje et al.,
Proton-Nucleus Collisions at the LHC: Scientific Opportunities and Requirements,
J. Phys. G 39 (2012) 015010, arXiv:1105.3919 [hep-ph].
[8] Z.-B. Kang, I. Vitev and H. Xing,
Effects of cold nuclear matter energy loss on inclusive jet production in p+A collisions at energies available at the BNL Relativistic Heavy Ion Collider and the CERN Large Hadron Collider,
Phys. Rev. C 92 (2015) 054911, arXiv:1507.05987 [hep-ph].
[9] ATLAS Collaboration, Centrality and rapidity dependence of inclusive jet production in √
sNN = 5.02 TeV proton-lead collisions with the ATLAS detector,Phys. Lett. B 748 (2015) 392,
arXiv:1412.4092 [hep-ex].
[10] ALICE Collaboration, Measurement of charged jet production cross sections and nuclear modification in p-Pb collisions at √sNN = 5.02 TeV,Phys. Lett. B 749 (2015) 68,
arXiv:1503.00681 [nucl-ex].
[11] CMS Collaboration, Measurement of inclusive jet production and nuclear modifications in pPb collisions at √sNN = 5.02 TeV,Eur. Phys. J. C 76 (2016) 372, arXiv:1601.02001 [nucl-ex]. [12] A. Adare et al., Centrality-dependent modification of jet-production rates in deuteron-gold
collisions at √sNN=200 GeV,Phys. Rev. Lett. 116 (2016) 122301,
arXiv:1509.04657 [nucl-ex]. [13] CMS Collaboration,
Charged-particle nuclear modification factors in PbPb and pPb collisions at √sNN=5.02 TeV,
JHEP 04 (2017) 039, arXiv:1611.01664 [nucl-ex].
[14] S. Chatrchyan et al.,
Observation of long-range near-side angular correlations in proton-lead collisions at the LHC,
Phys. Lett. B718 (2013) 795, arXiv:1210.5482 [nucl-ex].
[15] B. Abelev et al., Long-range angular correlations on the near and away side in p-Pb collisions at √
sNN = 5.02 TeV,Phys. Lett. B719 (2013) 29, arXiv:1212.2001 [nucl-ex].
[16] G. Aad et al., Observation of Associated Near-Side and Away-Side Long-Range Correlations in √
sNN=5.02 TeV Proton-Lead Collisions with the ATLAS Detector,
Phys. Rev. Lett. 110 (2013) 182302, arXiv:1212.5198 [hep-ex].
[17] A. Adare et al., Quadrupole Anisotropy in Dihadron Azimuthal Correlations in Central d+Au Collisions at √sNN=200 GeV,Phys. Rev. Lett. 111 (2013) 212301,
arXiv:1303.1794 [nucl-ex]. [18] A. Adare et al.,
Nuclear Modification ofΨ0,χc, and J/Ψ Production in d+Au Collisions at
√
sNN=200 GeV,
[19] J. Adam et al.,
Centrality dependence ofψ(2S) suppression in p-Pb collisions at √sNN= 5.02 TeV,
JHEP 06 (2016) 050, arXiv:1603.02816 [nucl-ex].
[20] A. M. Sirunyan et al., Measurement of prompt and nonprompt J/ψ production in pp and pPb collisions at √sNN = 5.02 TeV,Eur. Phys. J. C77 (2017) 269, arXiv:1702.01462 [nucl-ex].
[21] M. Aaboud et al., Measurement of quarkonium production in proton–lead and proton–proton collisions at5.02 TeV with the ATLAS detector, (2017), arXiv:1709.03089 [nucl-ex]. [22] P. Bozek and W. Broniowski, Collective dynamics in high-energy proton-nucleus collisions,
Phys. Rev. C88 (2013) 014903, arXiv:1304.3044 [nucl-th].
[23] K. Dusling and R. Venugopalan, Comparison of the color glass condensate to dihadron correlations in proton-proton and proton-nucleus collisions,Phys. Rev. D87 (2013) 094034, arXiv:1302.7018 [hep-ph].
[24] M. Cacciari, G. P. Salam and G. Soyez, The anti-ktjet clustering algorithm,JHEP 04 (2008) 063,
arXiv:0802.1189 [hep-ph].
[25] ATLAS Collaboration, The ATLAS Experiment at the CERN Large Hadron Collider,
JINST 3 (2008) S08003.
[26] ATLAS Collaboration, ATLAS Insertable B-Layer Technical Design Report, ATLAS-TDR-19, 2010, url:https://cds.cern.ch/record/1291633,
ATLAS Insertable B-Layer Technical Design Report Addendum, ATLAS-TDR-19-ADD-1, 2012,
URL:https://cds.cern.ch/record/1451888.
[27] T. Sjöstrand, S. Mrenna and P. Z. Skands, PYTHIA 6.4 physics and manual,JHEP 05 (2006) 026, arXiv:hep-ph/0603175.
[28] ATLAS Collaboration, ATLAS tunes of PYTHIA 6 and Pythia 8 for MC11, ATL-PHYS-PUB-2011-009, url:https://cds.cern.ch/record/1363300. [29] J. Pumplin, D. Stump, J. Huston, H. Lai, P. M. Nadolsky et al.,
New generation of parton distributions with uncertainties from global QCD analysis,
JHEP 07 (2002) 012, arXiv:hep-ph/0201195.
[30] S. Agostinelli et al., GEANT4: A simulation toolkit,Nucl. Instrum. Meth. A 506 (2003) 250. [31] ATLAS Collaboration, The ATLAS Simulation Infrastructure,Eur. Phys. J. C 70 (2010) 823,
arXiv:1005.4568 [physics.ins-det].
[32] T. Sjöstrand et al., An Introduction to PYTHIA 8.2,Comput. Phys. Commun. 191 (2015) 159, arXiv:1410.3012 [hep-ph].
[33] ATLAS Collaboration, ATLAS Run 1 Pythia8 tunes, ATLAS-PHYS-PUB-2014-021,
url:https://cds.cern.ch/record/1966419.
[34] R. D. Ball et al., Parton distributions with LHC data,Nucl. Phys. B 867 (2013) 244, arXiv:1207.1303 [hep-ph].
[35] M. Bahr et al., Herwig++ physics and manual,Eur. Phys. J. C 58 (2008) 639, arXiv:0803.0883 [hep-ph].
[36] S. Gieseke, C. Rohr and A. Siodmok, Colour reconnections in Herwig++,
[37] ATLAS Collaboration,
Jet energy measurement with the ATLAS detector in proton-proton collisions at √s= 7 TeV,
Eur. Phys. J. C 73 (2013) 2304, arXiv:1112.6426 [hep-ex].
[38] ATLAS Collaboration, Jet calibration and systematic uncertainties for jets reconstructed in the ATLAS detector at √s=13 TeV, ATLAS-PHYS-PUB-2015-015,
url:https://cds.cern.ch/record/2037613.
[39] ATLAS Collaboration, Electron reconstruction and identification efficiency measurements with the ATLAS detector using the 2011 LHC proton-proton collision data,
Eur. Phys. J. C 74 (2014) 2941, arXiv:1404.2240 [hep-ex].
[40] G. D’Agostini, A Multidimensional unfolding method based on Bayes’ theorem,
Nucl. Instrum. Meth. A 362 (1995) 487.
[41] T. Adye, Unfolding algorithms and tests using RooUnfold, (2011), arXiv:1105.1160 [physics.data-an].
[42] ATLAS Collaboration, Jet energy scale and its uncertainty for jets reconstructed using the ATLAS heavy ion jet algorithm, ATLAS-CONF-2015-016,
url:https://cds.cern.ch/record/2008677.
[43] ATLAS Collaboration, Jet energy scale measurements and their systematic uncertainties in proton-proton collisions at √s= 13 TeV with the ATLAS detector,
Phys. Rev. D 96 (2017) 072002, arXiv:1703.09665 [hep-ex].
[44] ATLAS Collaboration, Jet energy measurement and its systematic uncertainty in proton-proton collisions at √s= 7 TeV with the ATLAS detector,Eur. Phys. J. C 75 (2015) 17,
arXiv:1406.0076 [hep-ex].
[45] ATLAS Collaboration, Jet energy resolution in proton-proton collisions at √s= 7 TeV recorded in 2010 with the ATLAS detector,Eur. Phys. J. C 73 (2013) 2306, arXiv:1210.6210 [hep-ex]. [46] ATLAS Collaboration, Data-driven determination of the energy scale and resolution of jets
reconstructed in the ATLAS calorimeters using dijet and multijet events at √s = 8 TeV, ATLAS-CONF-2015-017, url:https://cds.cern.ch/record/2008678.
[47] ATLAS Collaboration,
Early Inner detector Tracking Performance in the 2015 Data at √s= 13 TeV, ATL-PHYS-PUB-2015-051, url:https://cds.cern.ch/record/2110140.
[48] ATLAS Collaboration, Measurement of track reconstruction inefficiencies in the core of jets via pixel dE/dx with the ATLAS experiment using √s= 13 TeV pp collision data,
ATL-PHYS-PUB-2016-007, url:https://cds.cern.ch/record/2140460.
[49] ATLAS Collaboration, Measurement of the jet fragmentation function and transverse profile in proton-proton collisions at a center-of-mass energy of 7 TeV with the ATLAS detector,
Eur. Phys. J. C 71 (2011) 1795, arXiv:1109.5816 [hep-ex].
[50] Z.-B. Kang, F. Ringer and I. Vitev, Jet substructure using semi-inclusive jet functions in SCET,
JHEP 11 (2016) 155, arXiv:1606.07063 [hep-ph].
[51] Y.-T. Chien, Z.-B. Kang, F. Ringer, I. Vitev and H. Xing,
Jet fragmentation functions in proton-proton collisions using soft-collinear effective theory,
[52] T. Kaufmann, A. Mukherjee and W. Vogelsang,
Hadron Fragmentation Inside Jets in Hadronic Collisions,Phys. Rev. D 92 (2015) 054015, arXiv:1506.01415 [hep-ph].
[53] D. de Florian, R. Sassot and M. Stratmann,
Global analysis of fragmentation functions for protons and charged hadrons,
Phys. Rev. D 76 (2007) 074033, arXiv:0707.1506 [hep-ph].
[54] ATLAS Collaboration, ATLAS Computing Acknowledgements 2016-2017, ATL-GEN-PUB-2016-002, url:https://cds.cern.ch/record/2202407.
The ATLAS Collaboration
M. Aaboud34d, G. Aad99, B. Abbott124, J. Abdallah75, O. Abdinov13,*, B. Abeloos128, S.H. Abidi164, O.S. AbouZeid143, N.L. Abraham153, H. Abramowicz158, H. Abreu157, R. Abreu127, Y. Abulaiti43a,43b, B.S. Acharya64a,64b,p, S. Adachi160, L. Adamczyk81a, J. Adelman119, M. Adersberger112, T. Adye141, A.A. Affolder143, T. Agatonovic-Jovin16, C. Agheorghiesei27c, J.A. Aguilar-Saavedra136f,136a,
F. Ahmadov77,ai, G. Aielli71a,71b, S. Akatsuka83, H. Akerstedt43a,43b, T.P.A. Åkesson94, A.V. Akimov108, G.L. Alberghi23b,23a, J. Albert173, M.J. Alconada Verzini86, M. Aleksa35, I.N. Aleksandrov77,
C. Alexa27b, G. Alexander158, T. Alexopoulos10, M. Alhroob124, B. Ali138, G. Alimonti66a, J. Alison36, S.P. Alkire38, B.M.M. Allbrooke153, B.W. Allen127, P.P. Allport21, A. Aloisio67a,67b, A. Alonso39, F. Alonso86, C. Alpigiani145, A.A. Alshehri55, M.I. Alstaty99, B. Alvarez Gonzalez35,
D. Álvarez Piqueras171, M.G. Alviggi67a,67b, B.T. Amadio18, Y. Amaral Coutinho78b, C. Amelung26, D. Amidei103, S.P. Amor Dos Santos136a,136c, A. Amorim136a, S. Amoroso35, G. Amundsen26, C. Anastopoulos146, L.S. Ancu52, N. Andari21, T. Andeen11, C.F. Anders59b, J.K. Anders88,
K.J. Anderson36, A. Andreazza66a,66b, V. Andrei59a, S. Angelidakis9, I. Angelozzi118, A. Angerami38, A.V. Anisenkov120b,120a, N. Anjos14, A. Annovi69a, C. Antel59a, M. Antonelli49, A. Antonov110,*, D.J.A. Antrim168, F. Anulli70a, M. Aoki79, L. Aperio Bella35, G. Arabidze104, Y. Arai79, J.P. Araque136a, V. Araujo Ferraz78b, A.T.H. Arce47, R.E. Ardell91, F.A. Arduh86, J-F. Arguin107, S. Argyropoulos75, M. Arik12c, A.J. Armbruster150, L.J. Armitage90, O. Arnaez164, H. Arnold50, M. Arratia31, O. Arslan24, A. Artamonov109,*, G. Artoni131, S. Artz97, S. Asai160, N. Asbah44, A. Ashkenazi158, L. Asquith153, K. Assamagan29, R. Astalos28a, M. Atkinson170, N.B. Atlay148, K. Augsten138, G. Avolio35, B. Axen18, M.K. Ayoub128, G. Azuelos107,ax, A.E. Baas59a, M.J. Baca21, H. Bachacou142, K. Bachas65a,65b,
M. Backes131, M. Backhaus35, P. Bagiacchi70a,70b, P. Bagnaia70a,70b, H. Bahrasemani149, J.T. Baines141, M. Bajic39, O.K. Baker180, E.M. Baldin120b,120a, P. Balek177, T. Balestri152, F. Balli142, W.K. Balunas133, E. Banas82, S. Banerjee178,m, A.A.E. Bannoura179, L. Barak35, E.L. Barberio102, D. Barberis53b,53a, M. Barbero99, T. Barillari113, M-S. Barisits35, T. Barklow150, N. Barlow31, S.L. Barnes58c,
B.M. Barnett141, R.M. Barnett18, Z. Barnovska-Blenessy58a, A. Baroncelli72a, G. Barone26, A.J. Barr131, L. Barranco Navarro171, F. Barreiro96, J. Barreiro Guimarães da Costa15a, R. Bartoldus150,
A.E. Barton87, P. Bartos28a, A. Basalaev134, A. Bassalat128, R.L. Bates55, S.J. Batista164, J.R. Batley31, M. Battaglia143, M. Bauce70a,70b, F. Bauer142, H.S. Bawa150,n, J.B. Beacham122, M.D. Beattie87, T. Beau132, P.H. Beauchemin167, P. Bechtle24, H.P. Beck20,t, K. Becker131, M. Becker97,
M. Beckingham175, C. Becot121, A. Beddall12d, A.J. Beddall12a, V.A. Bednyakov77, M. Bedognetti118, C.P. Bee152, T.A. Beermann35, M. Begalli78b, M. Begel29, J.K. Behr44, A.S. Bell92, G. Bella158, L. Bellagamba23b, A. Bellerive33, M. Bellomo157, K. Belotskiy110, O. Beltramello35, N.L. Belyaev110, O. Benary158,*, D. Benchekroun34a, M. Bender112, K. Bendtz43a,43b, N. Benekos10, Y. Benhammou158, E. Benhar Noccioli180, J. Benitez75, D.P. Benjamin47, M. Benoit52, J.R. Bensinger26, S. Bentvelsen118, L. Beresford131, M. Beretta49, D. Berge118, E. Bergeaas Kuutmann169, N. Berger5, J. Beringer18, S. Berlendis56, N.R. Bernard100, G. Bernardi132, C. Bernius150, F.U. Bernlochner24, T. Berry91, P. Berta139, C. Bertella15a, G. Bertoli43a,43b, F. Bertolucci69a,69b, I.A. Bertram87, C. Bertsche44, D. Bertsche124, G.J. Besjes39, O. Bessidskaia Bylund43a,43b, M. Bessner44, N. Besson142, C. Betancourt50, A. Bethani98, S. Bethke113, A.J. Bevan90, R.M. Bianchi135, O. Biebel112, D. Biedermann19, R. Bielski98, N.V. Biesuz69a,69b, M. Biglietti72a, J. Bilbao De Mendizabal52,
T.R.V. Billoud107, H. Bilokon49, M. Bindi51, A. Bingul12d, C. Bini70a,70b, S. Biondi23b,23a, T. Bisanz51, C. Bittrich46, D.M. Bjergaard47, C.W. Black154, J.E. Black150, K.M. Black25, D. Blackburn145,
R.E. Blair6, T. Blazek28a, I. Bloch44, C. Blocker26, A. Blue55, W. Blum97,*, U. Blumenschein90, Dr. Blunier144a, G.J. Bobbink118, V.S. Bobrovnikov120b,120a, S.S. Bocchetta94, A. Bocci47, C. Bock112,
M. Boehler50, D. Boerner179, D. Bogavac112, A.G. Bogdanchikov120b,120a, C. Bohm43a, V. Boisvert91,
P. Bokan169, T. Bold81a, A.S. Boldyrev111, A.E. Bolz59b, M. Bomben132, M. Bona90, M. Boonekamp142, A. Borisov140, G. Borissov87, J. Bortfeldt35, D. Bortoletto131, V. Bortolotto61a,61b,61c, D. Boscherini23b, M. Bosman14, J.D. Bossio Sola30, J. Boudreau135, J. Bouffard2, E.V. Bouhova-Thacker87,
D. Boumediene37, C. Bourdarios128, S.K. Boutle55, A. Boveia122, J. Boyd35, I.R. Boyko77, J. Bracinik21, A. Brandt8, G. Brandt51, O. Brandt59a, U. Bratzler161, B. Brau100, J.E. Brau127,
W.D. Breaden Madden55, K. Brendlinger44, A.J. Brennan102, L. Brenner118, R. Brenner169, S. Bressler177, D.L. Briglin21, T.M. Bristow48, D. Britton55, D. Britzger44, I. Brock24, R. Brock104, G. Brooijmans38, T. Brooks91, W.K. Brooks144b, J. Brosamer18, E. Brost119, J.H Broughton21, P.A. Bruckman de Renstrom82, D. Bruncko28b, A. Bruni23b, G. Bruni23b, L.S. Bruni118, B.H. Brunt31, M. Bruschi23b, N. Bruscino24, P. Bryant36, L. Bryngemark94, T. Buanes17, Q. Buat149, P. Buchholz148, A.G. Buckley55, I.A. Budagov77, M.K. Bugge130, F. Bührer50, O. Bulekov110, D. Bullock8,
H. Burckhart35, S. Burdin88, C.D. Burgard50, A.M. Burger5, B. Burghgrave119, K. Burka82, S. Burke141, I. Burmeister45, J.T.P. Burr131, E. Busato37, D. Büscher50, V. Büscher97, P. Bussey55, J.M. Butler25, C.M. Buttar55, J.M. Butterworth92, P. Butti35, W. Buttinger29, A. Buzatu15b, A.R. Buzykaev120b,120a, S. Cabrera Urbán171, D. Caforio138, V.M.M. Cairo40b,40a, O. Cakir4a, N. Calace52, P. Calafiura18, A. Calandri99, G. Calderini132, P. Calfayan63, G. Callea40b,40a, L.P. Caloba78b, S. Calvente Lopez96, D. Calvet37, S. Calvet37, T.P. Calvet99, R. Camacho Toro36, S. Camarda35, P. Camarri71a,71b, D. Cameron130, R. Caminal Armadans170, C. Camincher56, S. Campana35, M. Campanelli92, A. Camplani66a,66b, A. Campoverde148, V. Canale67a,67b, M. Cano Bret58c, J. Cantero125, T. Cao158, M.D.M. Capeans Garrido35, I. Caprini27b, M. Caprini27b, M. Capua40b,40a, R.M. Carbone38, R. Cardarelli71a, F.C. Cardillo50, I. Carli139, T. Carli35, G. Carlino67a, B.T. Carlson135, L. Carminati66a,66b, R.M.D. Carney43a,43b, S. Caron117, E. Carquin144b, S. Carrá66a,66b, G.D. Carrillo-Montoya35, J. Carvalho136a, D. Casadei21, M.P. Casado14,h, M. Casolino14,
D.W. Casper168, R. Castelijn118, A. Castelli118, V. Castillo Gimenez171, N.F. Castro136a, A. Catinaccio35, J.R. Catmore130, A. Cattai35, J. Caudron24, V. Cavaliere170, E. Cavallaro14, D. Cavalli66a,
M. Cavalli-Sforza14, V. Cavasinni69a,69b, E. Celebi12c, F. Ceradini72a,72b, L. Cerda Alberich171,
A.S. Cerqueira78a, A. Cerri153, L. Cerrito71a,71b, F. Cerutti18, A. Cervelli20, S.A. Cetin12b, A. Chafaq34a, D Chakraborty119, S.K. Chan57, W.S. Chan118, Y.L. Chan61a, P. Chang170, J.D. Chapman31,
D.G. Charlton21, A. Chatterjee52, C.C. Chau164, C.A. Chavez Barajas153, S. Che122, S. Cheatham64a,64c, A. Chegwidden104, S. Chekanov6, S.V. Chekulaev165a, G.A. Chelkov77,aw, M.A. Chelstowska35, C.H. Chen76, H. Chen29, S. Chen160, S.J. Chen15c, X. Chen15b,av, Y. Chen80, H.C. Cheng103, H.J. Cheng15d, Y. Cheng36, A. Cheplakov77, E. Cheremushkina140, R. Cherkaoui El Moursli34e, V. Chernyatin29,*, E. Cheu7, L. Chevalier142, V. Chiarella49, G. Chiarelli69a, G. Chiodini65a, A.S. Chisholm35, A. Chitan27b, Y.H. Chiu173, M.V. Chizhov77, K. Choi63, A.R. Chomont37,
S. Chouridou159, B.K.B. Chow112, V. Christodoulou92, D. Chromek-Burckhart35, M.C. Chu61a, J. Chudoba137, A.J. Chuinard101, J.J. Chwastowski82, L. Chytka126, A.K. Ciftci4a, D. Cinca45,
V. Cindro89, I.A. Cioar˘a24, C. Ciocca23b,23a, A. Ciocio18, F. Cirotto67a,67b, Z.H. Citron177, M. Citterio66a, M. Ciubancan27b, A. Clark52, B.L. Clark57, M.R. Clark38, P.J. Clark48, R.N. Clarke18, C. Clement43a,43b, Y. Coadou99, M. Cobal64a,64c, A. Coccaro52, J. Cochran76, L. Colasurdo117, B. Cole38, A.P. Colijn118, J. Collot56, T. Colombo168, P. Conde Muiño136a,136b, E. Coniavitis50, S.H. Connell32b, I.A. Connelly98, V. Consorti50, S. Constantinescu27b, G. Conti35, F. Conventi67a,ay, M. Cooke18, B.D. Cooper92,
A.M. Cooper-Sarkar131, F. Cormier172, K.J.R. Cormier164, M. Corradi70a,70b, F. Corriveau101,ag, A. Cortes-Gonzalez35, G. Cortiana113, G. Costa66a, M.J. Costa171, D. Costanzo146, G. Cottin31, G. Cowan91, B.E. Cox98, K. Cranmer121, S.J. Crawley55, R.A. Creager133, G. Cree33,
S. Crépé-Renaudin56, F. Crescioli132, W.A. Cribbs43a,43b, M. Crispin Ortuzar131, M. Cristinziani24, V. Croft117, G. Crosetti40b,40a, A. Cueto96, T. Cuhadar Donszelmann146, A.R. Cukierman150,