Publisher’s version / Version de l'éditeur:
Thermochimica Acta, 436, October, pp. 96-100, 2005-10-01
READ THESE TERMS AND CONDITIONS CAREFULLY BEFORE USING THIS WEBSITE.
https://nrc-publications.canada.ca/eng/copyright
Vous avez des questions? Nous pouvons vous aider. Pour communiquer directement avec un auteur, consultez la
première page de la revue dans laquelle son article a été publié afin de trouver ses coordonnées. Si vous n’arrivez pas à les repérer, communiquez avec nous à [email protected].
Questions? Contact the NRC Publications Archive team at
[email protected]. If you wish to email the authors directly, please see the first page of the publication for their contact information.
Archives des publications du CNRC
This publication could be one of several versions: author’s original, accepted manuscript or the publisher’s version. / La version de cette publication peut être l’une des suivantes : la version prépublication de l’auteur, la version acceptée du manuscrit ou la version de l’éditeur.
For the publisher’s version, please access the DOI link below./ Pour consulter la version de l’éditeur, utilisez le lien DOI ci-dessous.
https://doi.org/10.1016/j.tca.2005.02.017
Access and use of this website and the material on it are subject to the Terms and Conditions set forth at Glass transitions and amorphous phases in SBS-bitumen blends Masson, J-F.; Polomark, G. M.; Collins, P.
https://publications-cnrc.canada.ca/fra/droits
L’accès à ce site Web et l’utilisation de son contenu sont assujettis aux conditions présentées dans le site LISEZ CES CONDITIONS ATTENTIVEMENT AVANT D’UTILISER CE SITE WEB.
NRC Publications Record / Notice d'Archives des publications de CNRC:
https://nrc-publications.canada.ca/eng/view/object/?id=61e46cf7-92b5-4727-8ff5-b4fd9dccd6d8 https://publications-cnrc.canada.ca/fra/voir/objet/?id=61e46cf7-92b5-4727-8ff5-b4fd9dccd6d8
Glass transitions and amorphous phases in SBS-bitumen blends
Masson, J-F., Polomark, G.; Collins, P.
NRCC-44491
A version of this document is published in / Une version de ce document se trouve dans: Thermochimica Acta, v. 436, nos. 1-2, Oct. 2005, pp. 96-100
Doi: 10.1016/j.tca.2005.02.017
Glass transitions and amorphous phases in SBS-bitumen blends
J-F. Masson*, Gary Polomark, and Peter CollinsInstitute for Research in Construction, National Research Council of Canada *To whom correspondence should be addressed. Phone: (613) 993-2144.
Fax: (613) 952-8102. E-mail: [email protected]
Abstract
Blends of bitumen with 3-10% of a styrene-butadiene-styrene (SBS) block copolymer were investigated by means of modulated differential scanning calorimetry (MDSC) in an effort to better understand the miscibility and structure of the blends, along with the composition of the mixed phase(s). This relied on the measurements of the glass transition temperatures (Tg) in bitumen and SBS in their blended and unblended states.
In the unblended state, bitumen showed four Tgs, and SBS showed two. In the blends, a
new Tg arose from a phase of mixed composition, which contained polybutadiene (PB)
segments and about 30% of the maltenes. The blends also showed anti-plasticization as a shift of the Tgs from the paraffins in bitumen and the PB block in SBS moved away from
each other. The results indicate that the PB block has good interactions with bitumen, but that the polystyrene (PS) block does not.
1. Introduction
Polymers-polymer and polymer-diluent systems of have been of interest for several decades and the thermodynamics that govern their stability is well established [1-5]. The same thermodynamic framework can be applied to blends of polymers and bitumen, but
with added complexity in that the temperature-composition phase diagram is three-dimensional because bitumen is not a single component diluent [6].
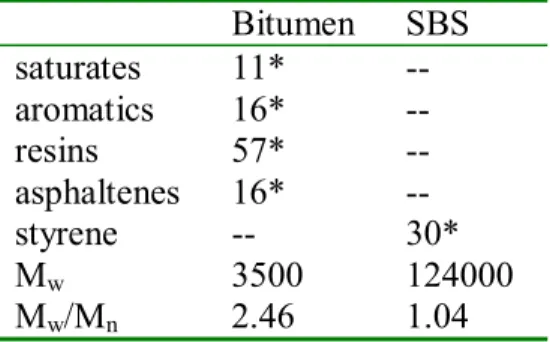
Bitumen is a complex viscoelastic mixture of oligomeric hydrocarbons, the average degree of polymerization being about 10 [7]. The chemical complexity of bitumen precludes any precise molecular identification. As a result, bitumen is often conveniently characterized by its chromatographic fractions, the maltenes and the asphaltenes (As), which are respectively soluble and insoluble in n-heptane. The maltenes can be fractionated further in classes of compounds called saturates (S), aromatics (A) and resins (R) [8,9]. The SARAs fractions increase in molecular weight, aromaticity, and heteroatomic content in the order S<A<R<As [10]. The SARAs terminology can be confusing, however, because the aromatics fraction (A) most often contains little conjugated ring structures [10]. Table 1 provides the composition of the fractions in more classical terms.
SBS and bitumen are regarded as compatible in that their mixtures show enhanced physical properties over the lone constituents [11]. However, this says little about the compatibility and interactions of the components or the phases in the blends. Brion and Brûlé [12] showed that SBS is swollen with saturates and aromatics, which implies an interaction of the copolymer with these bitumen fractions. More recently, Masson et al. [6] demonstrated that pi-electrons in the polybutadiene (PB) unit of SBS were responsible for much of the interactions between SBS and bitumen. In spite of these findings, the understanding of the phase structure of SBS-bitumen blends remains incomplete. This paper addresses the issue of mixing and the composition of the amorphous domains in homogeneous SBS-bitumen blends rich in bitumen. This may help to understand the
phase behavior and the stability of these blends [6], and may provide a fresh perspective on blend characteristics, the low temperature behavior being an important one.
In general, mixing can be assessed from the glass transition temperature (Tg) of the
materials in their blended and unblended states. A shift in Tg between the pure and the
blended states signals mixing, and this is conveniently measured by differential scanning calorimetry (DSC) [2]. With SBS-bitumen blends, however, DSC lacks the capability of resolving overlapping Tgs and only the Tg of the predominant bitumen-rich phase is
reported [13,14]. In contrast, Tgs for bitumen-rich, polybutadiene-rich and
polystyrene-rich phases were reported with dynamic mechanical analysis [15-17 ].
In recent work on bitumen and its fractions [7,18], it was shown that modulated DSC (MDSC) allows for the deconvolution of signals [19,20] from amorphous and ordered phases. The method thus has a much greater resolution than standard DSC. Typically, the amorphous phase gives rise to a reversing heat flow, which is readily converted to the apparent specific heat capacity (cp) and its derivative (dcp/dT), which highlights the Tgs.
In this paper, the derivative of the apparent heat capacity, obtained from the reversing heat flow, is used to better define the composition of the phases in SBS-bitumen blends. The results from the ordered and partially ordered phases (mesophases), as obtained from the non-reversing heat flow, will be reported later.
2. Experimental
2.1 Materials and blends.
A bitumen labelled ABA was obtained from the Strategic Highway Research Program in the USA. A linear SBS was obtained from Enichem (SOL T166). The bitumen and copolymer characteristics are shown in Table 2. The bitumen composition
was obtained by thin-layer chromatography-flame ionization detection [8] and the molecular weight of SBS by gel permeation chromatography as described before [6].
Blends of bitumen with 3%, 6%, and 10% by weight SBS were prepared. The lower concentration is typical of that in paving applications, whereas the higher concentrations are more typical of waterproofing and sealing applications. The blends were prepared at 165°C by stirring 1h, after which time a homogeneous mixture was obtained as observed by epi-fluorescence microscopy [6]. The stability of these blends and the related thermodynamics, including the effect of composition and molecular weight was treated in detail before [6]: the blend with 3% SBS is stable during hot storage, but the blends with 6% and 10% SBS segregate at 140°C and 120°C, respectively. Here the blends were studied in their homogeneous state, prior to segregation. For this purpose, the blends were cooled to 22°C after their preparation, and maintained there for at least one week before analysis
The MDSC instrumentation and data analyses were described in detail earlier [7,18]. Blends were heated from –120°C to 100°C at 3°C/min, a modulation period of 60 s and an amplitude of ±0.47°C. The total heat flow obtained from MDSC was deconvoluted into the reversing and non-reversing heat flows. The apparent cp and its derivative,
dcp/dT, were calculated from the reversing heat flow [7,18]. 3. Results and Discussion
3.1 Unblended materials
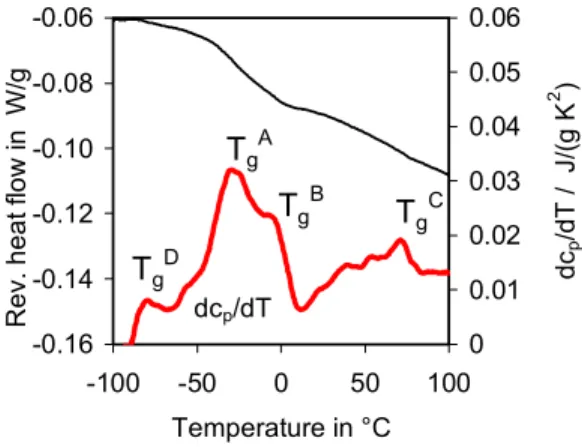
The reversing heat flow and dcp/dT curves for bitumen are shown in Fig. 1. The
derivative allows for improved analysis of the Tgs over the reversing heat flow or cp
curves alone. The dcp/dT curve highlights four Tgs, TgA to TgD, that arise from different
aromaticity, and molecular weight of the repeat molecular structure within the amorphous phase [21]. Three Tgs were observed in bitumen before [7], in agreement with those
shown in Fig. 1: TgA arises from the maltene phase and it is the most intense transition;
TgB arises from a maltene-asphaltene interfacial region of mixed composition likely rich
in resins and which for convenience can be called an interphase, although it may not be a strictly separate phase; TgC is from the asphaltenes. TgD was not observed before, but
given the Tg of the saturates extracted from bitumen [18], and the relationship between Tg
and molecular structure [21] TgD must arise from a phase rich in flexible paraffinic
segments.
For SBS, two Tgs are identified on the dcp/dT curve (Fig. 2). The PB block gives rise
to the sharp Tg at –90°C (TgPB). A mixed PS-PB phase gives rise to the broad Tg with a
maximum at 68°C (TgPS-PB). This maximum arises from a PS-rich phase that contains
about 20% PB [22]. 3.2 Bitumen-SBS Blends.
The cp curves for the blends with 0%, 3%, 6%, and 10% SBS are shown in Fig. 3A.
The increase in apparent cp between –100°C and 120°C is 1.1 J/(g K) for bitumen, but it
is lower for the blends, the decrease being proportional to the SBS content. The cp curves
show a most noticeable increase between about –50°C and 10°C, along with much less noticeable increases at –70°C and 70°C. From Fig. 3A, it is difficult to draw conclusions about phases less important than the main phase; dcp/dT curves are essential to highlight
secondary phases (Fig. 3B). The general profile of the dcp/dT curves for bitumen-SBS
blends is much like that for bitumen. There are important changes that provide information on the miscibility of bitumen and SBS, however. Between –50°C and
120°C, three Tgs in bitumen (TgA,B,C) lose intensity in slightly greater proportion than
expected based on the SBS content, and as will be discussed later, this indicates a loss of amorphous material in the phases responsible for TgA,B,C.
With each increment in SBS, there is a decrease in the ratio dcpB/dcpA measured from
the height of the derivative peaks at TgA and TgB (Fig. 3B). It is 0.7 for bitumen and it
gradually decreases to 0.5 for the blend with 10% SBS. Given that TgA and TgB arise
from the maltenes and the maltenes-asphaltenes interphase, respectively, the decrease in dcpB/dcpA indicates that SBS hinders interactions between maltenes and asphaltenes and
prevents to some extent the formation of a maltene-asphaltene interface. In other words, SBS hinders the dissolution of asphaltenes into maltenes. This can occur either because of steric exclusion of asphaltenes from the interphase, or because of preferential interactions of SBS and asphaltenes. However, SBS was shown to mix preferentially with saturates and aromatics, and not with the asphaltenes [6,12]. The change in cpB/cpA
thus indicates that asphaltenes become increasingly excluded from a mixed phase when the SBS concentration increases. As a result, the bitumen phase becomes enriched in asphaltenes, which is consistent with previous findings [6,12 ].
The decrease in cp at TgA,B,C related to the increase in SBS in the blend arises partly
due to a loss of amorphous material in the phases responsible for TgA,B,C. This material
ends up in a new phase with a transition around –70°C (Figs 3 and 4). As expected from a mixed maltenes-PB phase, the Tg of the new phase is between TgPB and TgA, and
increases in intensity with an increase in SBS, as highlighted by the dotted line for TgNEW
in Fig. 4. However, given a TgPB of –90°C, a TgA of –30°C, and the rule of mixtures
–34°C for blends with 3 to 10% SBS (PB content of 2 to 7%). A TgNEW around –70°C
indicates that PB blends only with a small weight fraction of the maltenes. With the rule of mixtures, it is calculated that only about 30 wt% of the maltenes blend with PB. Given that SBS is swollen by the saturates and aromatics fractions from bitumen [12] it is likely that the maltenes portion that blends with PB is rich in alkanes and cyclo-alkanes (Table 1).
Fig. 4 also shows that TgPB and TgD move away from each other, rather than towards
each other. In general, the partial mixing of two phases with independent Tgs leads to a
shift in Tgs, with the Tgs moving towards each other due to mixing [2]. Plasticization
occurs when the Tg of a polymer is depressed by the action of a small molecule with a
lower Tg [23]. In contrast, anti-plasticization occurs in SBS-bitumen mixtures as Tgs
more away from each other: when PB is swollen by saturates, TgPB is shifted down from
–90°C to –93°C, whereas TgD is shifted up from –81°C to –76°C, this shift being
indicated by TgD* in Fig. 4. This anti-plasticization can be explained by a loss of the
lightest oils from the saturate fraction towards the PB domain. The result is a stiffer saturate fraction and hence a TgD higher by 5°C (TgD*), and a softer PB fraction with a Tg
lower by 3°C. Table 3 lists the various Tgs in SBS-modified bitumen.
Fig. 5 shows the temperature range where TgPS-PB from PS-rich domains overlaps with
the TgC region from the bitumen asphaltenes. At an SBS concentration of 10% or less,
TgPS-PB does not contribute to the dcp/dT response from the blends, which show a
decrease and a shift in the bitumen maxima. An important decrease in the maximum at 55°C concurs with a shift of the maxima at 40°C and 70°C towards lower temperatures as shown by the arrows in Fig. 5. This temperature shift indicates that the asphaltenes are
affected by SBS and it suggests that mixing occurs mainly with flexible PB segments. The mixing of the asphaltenes with pure PS segments (Tg at 100°C), or with the
plasticized PS of the mixed PS-PB phase (Tg at 68°C), would cause an upshift in the
temperature of the maxima in the TgC region, which would be especially visible below
68°C, e.g., with the transition at 40°C.
4. Conclusion
The reversing heat-flow signals from MDSC were used to investigate the extent of mixing in SBS-bitumen blends with 3%, 6%, and 10% SBS by weight. Bitumen and SBS respectively show four and two Tgs. Based on the shifting of the Tgs in the blends, there
was no evidence of blending of bitumen with the PS block, but there was evidence that bitumen blended with the PB block at all the SBS concentrations investigated. The blends contained a new phase of mixed composition with a Tg close to –70°C. This
phase contained some PB and an estimated 30% of the lighter maltenes, namely, the alkanes and cyclo-alkanes. Not all the PB was in the mixed phase, however, as the remainder was found in a PB-rich phase swollen with the lighter alkanes. Hence, the miscibility of SBS-bitumen blends is controlled in great part by the PB block in SBS, and by the lighter maltenes in bitumen.
References
[1] P. J. Flory, Principles of Polymer Chemistry, Cornell University Press: Ithaca, 1953.
[2] O. Olabisi, L.M.Robeson, M.T. Shaw, Polymer-Polymer Miscibility; Academic Press: New York, 1979.
[3] L.A. Utracki, Polymer Alloys and Blends: Thermodynamics and Rheology, Hanser Publisher, New York, 1989.
[4] D.R. Paul, C.B.Bicknall Ed., Polymer Blends, Wiley-Interscience, New York, 2000.
[5] M.M.Coleman, J.F. Graf, P.C. Painter, Specific Interactions and Miscibility of Polymer Blends, Technomic Pub. Co., Lancaster, 1991.
[6] J-F. Masson, P. Collins, G. Robertson, J.R. Woods, J. Margeson, Energy Fuels 17 (2003), 714.
[7] J-F Masson, G. Polomark, Thermochim. Acta 374 (2001) 105. [8] J-F.Masson, T. Price, P. Collins, Energy Fuels 15 (2001) 955. [9] L.Raki, J-F. Masson, Energy Fuels 14 (2000) 160.
[10] J.G. Speight, The Chemistry and Technology of Petroleum, 3rd Ed., Marcel Dekker, New York, 1999.
[11] C.P. Valkering, D.J.L Lancon,. E. deHilster, D.A. Stoker, Asphalt Pav. Technol. 59 (1990) 590.
[12] Y. Brion, B.Brûlé, Étude des mélanges bitumes-polymères: composition, structure, propriétés, Report PC-6, French Central Laboratory for Roads and Bridges [LCPC], Paris, France, 1986 [in French].
[13] D. Lesueur, J.-F.Gérard, P. Claudy, J.-M Létoffé, D. Martin, J.-P. Planche, J. Rheol. 42 (1998) 1059.
[14] J.-M. Létoffé, L. Champion-Lapalu, D. Martin, J.-P. Planche, J.-F.Gérard, P. Claudy, Bull. Labo. Ponts Chaussées 229 (2000) 13.
[15] U. Isacsson,; X. Lu, Mater. Struct. 28 (1995) 139. [16] K.G. Woodly, J. Inst. Asph. Technol. 38 (1986) 44. [17] J.H. Collins, Asph. Pav. Technol. 60 (1991) 43.
[18] J-F. Masson, G.Polomark, P.Collins, Energy Fuels, 16 (2002) 470. [19] M. Reading, Trends Polym. Sci. 1 (1993) 248.
[20] P.S. Gill, S.R Sauerbrunn, M J. Reading, Therm. Anal. 40 (1993) 931. [21] M. C Shen,. A. Eisenberg, Rubber Chem. Technol. 43 (1970) 95.
[22] J-F. Masson, S. Bundalo-Perc, A. Delgado, J. Polym. Sci. B, 43 (2005) 276.
[23] F.W. Billmeyer, Textbook of Polymer Science; Wiley-Interscience, New York, 3rd Ed. 1984.
Table 1. Typical composition of SARAs fractions Fraction Composition
saturates n- and iso-alkanes
aromatics Alkylated cyclopentanes and cyclohexanes resins Alkylated and cycloalkylated aromatic rings asphaltenes Alkylated condensed aromatic rings
Table 2. Material characteristics
Bitumen SBS saturates 11* -- aromatics 16* -- resins 57* -- asphaltenes 16* -- styrene -- 30* Mw 3500 124000 Mw/Mn 2.46 1.04 * wt %
Table 3. Sub-zero Tgs in SBS-bitumen blends
Tg, °C Composition
–93 PB-rich phase plasticized by the light oils –90 unblended PB block
–81 light oils in bitumen (TgD)
–76 light oils anti-plasticized by the loss of the lightest fraction (TgD*)
–73 to –71 PB-rich phase swollen with maltenes (TgNEW)
–30 Maltenes (TgA)
Fig. 1. Reversing heat flow curves for bitumen ABA. Exo is up.
Fig. 2. Reversing heat flow and dcp/dT curves for SBS. Exo is up. -0.12 -0.10 -0.08 -0.06 -0.04 -0.02 -100 -50 0 50 100 150 Temperature in °C R e v. heat f low i n W /g -0.01 0.00 0.01 0.02 0.03 0.04 0.05 dc p /d T , J /(g K 2 ) dcp/dT −90°C 68°C -0.16 -0.14 -0.12 -0.10 -0.08 -0.06 -100 -50 0 50 100 Temperature in °C Rev. heat f low i n W /g 0 0.01 0.02 0.03 0.04 0.05 0.06 dc p /d T / J /(g K 2 ) dcp/dT TgD Tg A TgB T g C
Fig. 3. cp (A) and dcp/dT (B) curves for bitumen-SBS blends with 0 – 10% SBS. 0.5 1 1.5 2 2.5 -100 -50 0 50 100 Temperature/ °C cp/ J/ (g K ) 0% 3% 6% 10% A 0 0.01 0.02 0.03 -100 -50 0 50 100 Temperature/°C dc p/d T / J /( g K 2 ) 0% 3% 6% 10% B
Fig. 4. Low temperature region for SBS and its blends with bitumen. The curve for SBS is 3% of its true intensity to allow for its comparison with the blends.
Fig. 5. High temperature region for SBS and its blends with bitumen. The curve for SBS is 3% of its true intensity and shifted up 0.005 units to allow for its comparison with the blends. 0.005 0.01 0.015 0.02 20 40 60 80 100 Temperature/ °C dc p /d T / J /(g K 2 ) 0% 3% 6% 10% SBS -0.0025 0.0025 0.0075 0.0125 -100 -90 -80 -70 -60 -50 Temperature/ °C dc p/d T / J /(g K 2 ) SBS Tg PB TgD TgD * TgNEW 10% 0% 3% 6%