Publisher’s version / Version de l'éditeur:
Vous avez des questions? Nous pouvons vous aider. Pour communiquer directement avec un auteur, consultez la première page de la revue dans laquelle son article a été publié afin de trouver ses coordonnées. Si vous n’arrivez pas à les repérer, communiquez avec nous à [email protected].
Questions? Contact the NRC Publications Archive team at
[email protected]. If you wish to email the authors directly, please see the first page of the publication for their contact information.
https://publications-cnrc.canada.ca/fra/droits
L’accès à ce site Web et l’utilisation de son contenu sont assujettis aux conditions présentées dans le site LISEZ CES CONDITIONS ATTENTIVEMENT AVANT D’UTILISER CE SITE WEB.
International ISAP Symposium on Asphalt Pavements and Environment
[Proceedings], 2008-08-18
READ THESE TERMS AND CONDITIONS CAREFULLY BEFORE USING THIS WEBSITE. https://nrc-publications.canada.ca/eng/copyright
NRC Publications Archive Record / Notice des Archives des publications du CNRC :
https://nrc-publications.canada.ca/eng/view/object/?id=6dfe1ec0-f4cc-4937-ab4f-25105c0df37e https://publications-cnrc.canada.ca/fra/voir/objet/?id=6dfe1ec0-f4cc-4937-ab4f-25105c0df37e
This publication could be one of several versions: author’s original, accepted manuscript or the publisher’s version. / La version de cette publication peut être l’une des suivantes : la version prépublication de l’auteur, la version acceptée du manuscrit ou la version de l’éditeur.
Access and use of this website and the material on it are subject to the Terms and Conditions set forth at
Towards performance-based selection guidelines for roadway crack
sealants
T o w a r d s p e r f o r m a n c e - b a s e d s e l e c t i o n
g u i d e l i n e s f o r r o a d w a y c r a c k s e a l a n t s
N R C C - 5 0 8 3 5
A l - Q a d i , I ; Y a n g , W . ; F i n i , E . H . ; M a s s o n , J - F .
2 0 0 8 - 0 8 - 1 8
A version of this document is published in / Une version de ce document se trouve dans:
International ISAP Symposium on Asphalt Pavements and Environment, Zurich, Switzerland, August 18, 2008
The material in this document is covered by the provisions of the Copyright Act, by Canadian laws, policies, regulations and international agreements. Such provisions serve to identify the information source and, in specific instances, to prohibit reproduction of materials without written permission. For more information visit http://laws.justice.gc.ca/en/showtdm/cs/C-42
Les renseignements dans ce document sont protégés par la Loi sur le droit d'auteur, par les lois, les politiques et les règlements du Canada et des accords internationaux. Ces dispositions permettent d'identifier la source de l'information et, dans certains cas, d'interdire la copie de documents sans permission écrite. Pour obtenir de plus amples renseignements : http://lois.justice.gc.ca/fr/showtdm/cs/C-42
Towards Performance-Based Selection Guidelines
for Roadway Crack Sealant
Imad L. Al-Qadi, Department of Civil and Environmental Engineering, University of Illinois at Urbana-Champaign, USA
J-F. Masson, Institute for Research in Construction, National Research Council of Canada, CA Shih-Hsien Yang, Department of Civil and Environmental Engineering, University of Illinois at Urbana-Champaign, USA
Elham Fini, Department of Civil and Environmental Engineering, University of Illinois at Urbana-Champaign, USA
Abstract
The long-term performance of pavements depends in good part on the quality and frequency of maintenance. Good maintenance protects the pavement from deterioration, corrects deficiencies, and ensures safe and smooth riding. Crack sealing is practiced on a routine basis as preventive maintenance and as part of corrective maintenance prior to an overlay or a large rehabilitation project. A timely and properly installed sealant adds several years of service life to the pavement at a relatively low cost. As a consequence, the selection of an appropriate sealant in a maintenance project becomes an important issue. Current sealant selection is based on ASTM standards that consist of quality control tests, not of performance indicators. These standards do not consider the changes in mechanical properties due to aging or the differences in local service temperatures. Given the breadth of temperatures in North America and its yearly variation, there is an urgent need for performance-based indicators of sealant performance. In this paper, a series of test that provides a systematic approach to help highway agencies select proper sealants is proposed. These include an accelerated aging test, a viscosity test performed at installation temperatures, a dynamic shear rheometer (DSR) tests to assess flow in summer temperature, a bending beam rheometer (BBR) and a direct tension test (DTT) for cohesive properties at sub-zero temperature, and a blister test for adhesive properties.
1. Introduction
ASTM standard D5535 defines a sealant as an adhesive and cohesive material that reduces, and in the best case prevents, the penetration of water, brine, grit, stones and other incompressible materials into the pavement structure. Crack sealing is widely used in routine preventive
maintenance. After proper installation, the sealant must withstand crack movement, degradation, and weathering.
Over the past two decades, polymer-rich crack sealants have been used. These sealants exhibit quite complex behavior compared to the earlier sealants rich in bitumen (1). Despite this evolution, current sealant selection relies on a standard with its basis in World-War II quality control tests: ASTM D6690, Specification for Joint and Crack Sealants, Hot Applied, for Concrete and Asphalt Pavements. This specification provides lilttle or no correlation to the field behavior of the sealants (2) because the test conditions are not closely related to the expected in-service conditions (3).
Sealants with the best and the worst field performance fail to meet the specification, with only the average sealants passing the specification (3). The inconsistency between field performance and the current specification system has been widely reported in the literature (4). Therefore, there is a great need for a performance-based specification to select sealants.
After acknowledging the deficiencies of the current specification, North-American stakeholders (State and Province departments of transportation, manufacturers, cities, and research agencies) partnered to develop performance-based guidelines for selecting bituminous hot-poured crack sealants (5). One aim of the study was to make use of the existing methods and equipment developed during the five-year Strategic Highway Research Program (SHRP) as part of the Performance Grade (PG) system for asphalt binders. This paper provides an insight on the tests adapted or developed for sealants.
2. Materials
In general, sealants are composed of bitumen, butadiene copolymer, and filler. The styrene-butadiene (SB) copolymer consists of linked blocks of polystyrene (PS) and polystyrene-butadiene (PB). The fillers may include ground tire rubber or mineral filler, or both (5). The variety of chemical
compositions for crack sealants can significantly influence their rheological properties. Therefore, thirty-one sealants with varying compositions were used. These sealants represent the wide North American array of rheological behaviors. Variations in the rheological properties can be attributed to different factors including the source of bitumen, its refining process, and the content of polymer, filler, and additives.
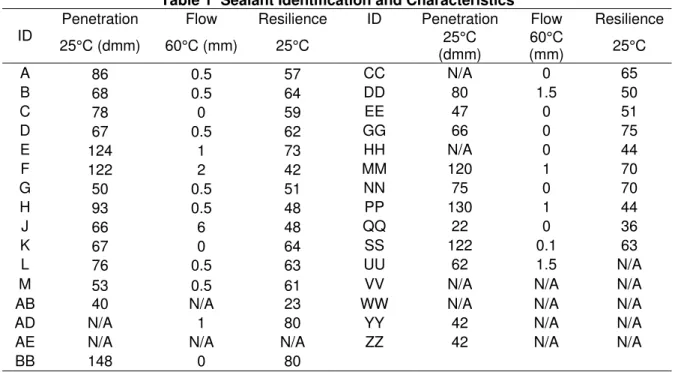
The characteristics of the thirty one sealants are shown in Table 1 along with the tests results according to ASTM D5535. Sealants with a one character code were studied in a field trial
conducted in Canada. They were used to study weathering and accelerated aging. Sealants with a two character code were used to study of sealants at low and application temperatures.
Table 1 Sealant Identification and Characteristics
Penetration Flow Resilience ID Penetration Flow Resilience
ID 25°C (dmm) 60°C (mm) 25°C (dmm) 25°C (mm) 60°C 25°C A 86 0.5 57 CC N/A 0 65 B 68 0.5 64 DD 80 1.5 50 C 78 0 59 EE 47 0 51 D 67 0.5 62 GG 66 0 75 E 124 1 73 HH N/A 0 44 F 122 2 42 MM 120 1 70 G 50 0.5 51 NN 75 0 70 H 93 0.5 48 PP 130 1 44 J 66 6 48 QQ 22 0 36 K 67 0 64 SS 122 0.1 63 L 76 0.5 63 UU 62 1.5 N/A
M 53 0.5 61 VV N/A N/A N/A
AB 40 N/A 23 WW N/A N/A N/A
AD N/A 1 80 YY 42 N/A N/A
AE N/A N/A N/A ZZ 42 N/A N/A
BB 148 0 80
3. Performance-Based Specification
3.1 Weathering and Accelerated aging
Sealants weather in the field. It is therefore an important task to develop an effective accelerated aging test. For an aging test to be effective, it must quickly provide an aging as close as possible to reality. Figure 1 shows how this can be done. To this effect, true aging was determined from the
physico-chemical analysis of twelve sealants, A to M, weathered in Montreal, Canada, for nine years (Table 2).
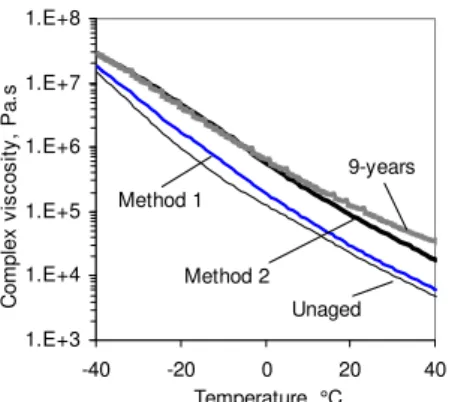
To mimic the effect of weathering on sealants, several accelerated aging methods were compared (alone or in combination) after various aging times and temperatures, including, small-kettle aging, microwave aging, pressure aging, oven aging, and vacuum oven aging. The results of physico-chemical analysis of sealants weathered in the field were compared to those for sealants aged quickly in the laboratory. The oxidation of the sealant bitumen, the change in the polymer molecular weight, and the change is sealant viscosity between –40°C and 40°C served to validate the aging methods (Figure 2).
It was found that microwave heating could mimic the aging of sealants that contain mineral filler, but not the others. The method thus lacked general application. Pressure aging was also found to be inappropriate as it often led to insufficient bitumen oxidation, but excessive thermo-degradation of the polymer. Vacuum oven aging was found to be the most appropriate method to simulate sealant weathering. Details will be provided in a series of publications.
Determine aging rate and mechanism for weathered sealants
Simulate aging on un-aged sealants
Validate aging test
Figure 1 Development of an aging procedure Table 2 Physico-chemical method to characterize aging
Method Output Use
GPC Separation of bitumen and polymer Quantify polymer; degradation rates and mechanisms
FTIR Fingerprint of composition Oxidation; identification of polymer and filler; semi-quantitative analysis; degradation mechanism
TG Weight loss upon heating Contents of filler and light, medium, and heavy hydrocarbon components
DSR Stiffness, relaxation Effect of temperature and aging on mechanical properties
Note: Gel permeation chromatography (GPC), Fourier transform infrared spectroscopy (FTIR), thermogravimetric analysis (TG), dynamic shear rheometry (DSR).
1.E+3 1.E+4 1.E+5 1.E+6 1.E+7 1.E+8 -40 -20 0 20 4 Temperature, °C C o m p le x vi s c o s it y, P a .s 0 9-years Unaged Method 2 Method 1
3.2 Sealant Viscosity During Application
Sealant flow increases with temperature. During installation, sealants are heated to a liquid so that they can be poured into cracks or routs. They must be heated to a viscosity low enough to provide a good bond with the asphalt concrete but high enough for the sealant not to flow deep into the pavement or out of the bottom end of a sloping crack.
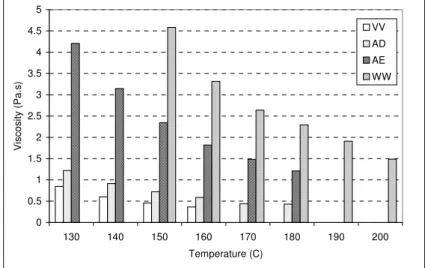
A viscosity test was devised to reproducibly measure sealant flow at installation temperatures. This test uses a Brookfield viscometer with an SC4-27spindle rotated at 60 rpm. A 20min sealant melting time followed by 30-s lag before data collection ensures consistent results (7). Precision was
established through a round-robin test amongst seven laboratories. The viscosity of several sealants at different temperatures is shown in Figure 3.
To provide appropriate sealant flow, upper and lower viscosity limits are recommended. An upper limit of 3.5Pa·s ensures that sealant is liquid enough to pour, whereas a lower limit of 1 Pa·s prevents the application of an excessively fluid sealant. Application temperatures should thus provide viscosities of 1.0 to 3.5 Pa·s, which also helps provide good adhesion between sealant and pavement. 0 0.5 1 1.5 2 2.5 3 3.5 4 4.5 5 130 140 150 160 170 180 190 200 Temperature (C) Vis co s ity (Pa.s) VV AD AE WW
Figure 3 Viscosity of sealant at different temperature
3.3 Sealant Flow in Summer Temperatures
Bituminous sealants applied to cracked pavements sometimes fail due to deformation under the combined action of shear stresses and summer temperatures (5, 8). In an attempt to define performance parameters, a dynamic shear rheometer (DSR) was used and subjected to increasing stresses at temperatures increasing between 46°C and 82°C. These conditions were meant to mimic the effect of various traffic levels and temperature maxima in the field. Plots of low shear viscosity (ηL) versus shear rate ( ) indicated that many sealants were susceptible to shear thinning.
Their apparent viscosity decreased with an increase in shear rate, or temperature, or both (
•
γ
Figure 4). This indicated that in summer temperatures, high traffic loads or volumes would affect the extent of sealant flow when it is under stress.
Sealant C
100 1000 10000 100000
1.E-4 1.E-3 1.E-2 1.E-1 1.E+0 1.E+1
Shear rate, 1/s L SV, Pa .s 46°C 52°C 58°C 64°C 70°C, 76°C 82°C Sealant AD 100 1000 10000 100000
1.E-4 1.E-3 1.E-2 1.E-1 1.E+0 1.E+1
Shear rate, 1/s L S V, Pa .s 46C 52C 58C 64C 70C 76C 82C
Figure 4 Examples of low shear viscosity as a function of shear rate. For each curve, the stress doubles for each point from left to right, starting at 25 Pa.
Plots of ηL vs were interpreted based on the Ostwald power law model. This model provided two
parameters: a flow coefficient (C) and a shear-thinning coefficient (P). These coefficients correlated well with sealant pseudo-field performance as measured by tracking (7).
•
γ
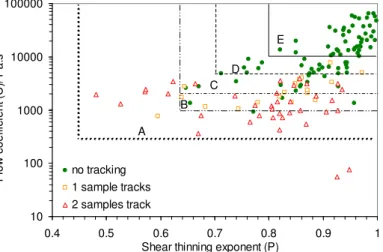
Figure 5 shows the relationship between these factors and performance during the pseudo-field test. The solid markers indicate the sealants that did not fail during the pseudo-field test and the open markers show those that failed. The semi-log scale in Figure 5 serves to highlight the high-failure regions (open
markers). Limiting values for P and C can be established to limit the risk of sealant failure. Each pair of C and P represents possible performance criteria.
10 100 1000 10000 100000 0.4 0.5 0.6 0.7 0.8 0.9 1 Shear thinning exponent (P)
F lo w c o e ffi c ie n t ( C )/ P a .s no tracking 1 sample tracks 2 samples track A B C E D
Figure 5 Semi-log plot of the Ostwald parameters and possible performance limits, areas A to D.
In the absence of effective limiting criteria (area A in Figure 5), the sealant failure rate due to tracking is 39% (Table 3). As C and P limits are raised, the risk of tracking failure is reduced. Area E defines the limits within which no tracking failure was observed. With such demanding criteria, 33% of the sealants are above the pass limits. Any limits in C and P can be used to define the level of sealant performance, but the most interesting performance criteria may be that defined by area D, where limits of C = 4000 Pa.s and P = 0.70 provide for a failure risk of only 3% and a sealant acceptance rate greater than 50%. The other limits have greater acceptance rates, but the risk of failure is disproportionately higher (Table 3).
Table 3 Lower limits in C and P and their relationship with tracking performance
A 300 0.46 145 (99%) 39 % failure B 1000 0.64 123 (84%) 24 % failure C 2500 0.64 98 (66%) 14% failure D 4000 0.70 76 (52%) 3 % failures E 10000 0.80 49 (33%) No failures a Area in Figure 5. b
From DSR: Number of samples above C and P limits. Total number of samples is 147.
c
From the pseudo-field test (5): ratio empty/all marker within the given plot area.
3.4 Low Temperature Test
3.4.1 Modified Bending Beam Rheometer
Bituminous crack sealants are viscoelastic. As such, they can become brittle at low temperature, and they may fail when they are subject to rapid shear loads associated to traffic or to tensile loads related to pavement contraction and crack opening. Therefore, sealants must be flexible enough to deform at low temperatures. To measure sealant flexibility, the bending beam rheometer (BBR) was adapted to sealants (9). A constant creep loading is applied to a thick rectangular beam for 240s and the 60s flexural stiffness is determined. To decide on test conditions, temperature history at several locations in the US was reviewed; it showed that upon cooling, sealants can be under tensile strain for 6 to 10h and that internal stresses had 3 to 7 hours to dissipate by stress relaxation when temperatures become constant and cracks and joints are static. From time-temperature
superposition, the 240s stiffness at a given temperature can be used to predict the stiffness after 5 hours of loading. Given the variation in sealant response to temperature changes, a 6°C shift was deemed appropriate (10).
With a BBR method adapted to sealants, several products were loaded between +2°C and –40°C, and two performance parameters were selected to evaluate sealant softness: the flexural stiffness at 240s and the average creep rate (ACR). The ACR was used to assess the rate of sealant
deformation upon loading. These parameters can distinguish between sealants (11). Figure 6 shows sealant stiffness at 240s for fifteen tested sealants. The dash line shows the recommended thresholds of 25MPa. Figure 7 shows the ACR and the suggested threshold of 0.31. The thresholds were determined after a correlation with results from sealants of known field performance, as
measured in Montreal, Canada (2).
0 10 20 30 40 50 60 70 80 90 QQ EE ZZ YY AB VV UU DD AE MM WW NN AD PP BB Sealant S ti ff n es s (MPa ) 2°C -4°C -10°C -16°C -22°C -28°C -34°C -40°C
0 0.1 0.2 0.3 0.4 0.5 QQ EE ZZ YY AB VV UU DD AE MM WW NN AD PP BB Sealant Av er ag e Rate o f Cr ee p 2°C -4°C -10°C -16°C -22°C -28°C -34°C -40°C
Figure 7 Average Creep Rate for Sealants at Various Temperatures 3.4.2 Direct Tension Test (DTT)
As indicated earlier, sealants are in tension during winter. Therefore, a direct tension test, a slow isothermal pull of the sealant, was considered a suitable test to simulate sealant movement in the field at low temperature. A dog-bone shaped specimen was fixed at one end and pulled from the other end at a constant strain rate of 6%/min. Sealant extensibility is also important as crack
opening can beach 100% (12-15). Unfortunately, the standard sample size and set-up only allow for a 33% extension of the sample. To circumvent this difficulty, specimens of 24mm by 6mm by 3mm (length, width, thickness) were used. This change in sample geometry and size allows for
extensions up to 95% (16).
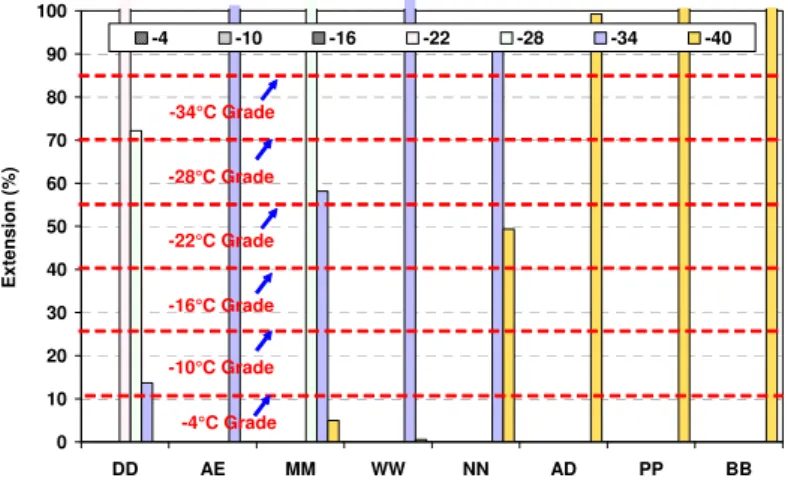
Two performance parameters can be obtained from DTT: the extensibility and the percent modulus decay. The extensibility is obtained as the percent strain at the peak load, or as the strain reaches 95% of its extension (Figure 8). The percent modulus decay is calculated as the rate of modulus change after 10s of loading. This gives an indication of how fast the sealant can release the imposed load (Figure 9). The suggested extensibility criteria at 4°C, 10°C, 16°C, 22°C, 28°C, -34°C, and -40°C are 10%, 25%, 40%, 55%, 70%, 85% and 85%+, respectively, as shown by the red dash in Figure 8. For instance, if the extensibility is greater than 10% but less than 25% at -4°C, a sealant will pass the extensibility criteria at a -4°C grade.
0 10 20 30 40 50 60 70 80 90 100 DD AE MM WW NN AD PP BB Sealant E x tension (%) -4 -10 -16 -22 -28 -34 -40 -4°C Grade -10°C Grade -16°C Grade -22°C Grade -28°C Grade -34°C Grade
0 10 20 30 40 50 60 DD AE MM WW NN AD PP BB Sealant Perce n t Modulus D e cay (%) -22 -28 -34 -40
Figure 9 Percent Modulus Decay of Sealant at Various Temperatures.
3.4.3 Adhesion Test
Adhesive failure is a most common failure mode (17). It refers to the separation of sealant from the crack wall. For the sealant to perform well, it must develop and maintain a strong bond with crack walls. Considering that aggregates make 95% (by weight) of the asphalt concrete, sealant
performance is governed by its interaction with aggregates. In the development of a standard test, aluminium found to be an appropriate substitute for aggregates (18). A 3-level approach was used for characterize sealant adhesion, a) compatibility with aggregates, which aims to help sealant producers with formulation, b) tensile adhesion, which aims to help with sealant selection, and c) blister test, which helps to study the effects of various factors on interfacial bonding.
The compatibility with aggregates is based on the calculation of the surface energy and the work of adhesion for each sealant-aggregate pair. To calculate the work of adhesion, the surface energy of each sealant and the angle between a droplet of sealant and the substrate (aggregate or aluminium) is measured (19). The work of adhesion between aluminium and seven sealants is shown in Figure 10. As can be seen, this method can differentiate between various pairs.
0 5 10 15 20 25 30 35 40 45 UU BB AE PP AD WW MM Work o f Ad hesio n ( m J/m 2) Aluminum
Figure 10 Work of Adhesion between Sealants and Aluminum
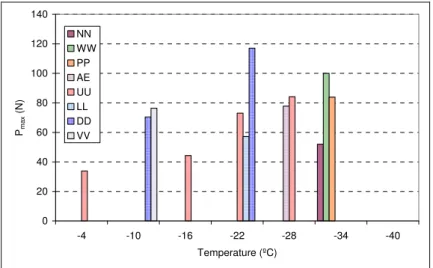
In the tensile adhesion test a sealant-aggregate pair is brought apart in the DTT, for which a test fixture was developed (19). An assembly consists of two half-cylinders of aluminium and a half
cylinder, open at the upper end. The mold is placed between the two aggregates and it is filled with hot sealant. Before pouring the sealant, a 12.5x2mm notch is placed on the edge of one of the aluminium pieces to ensure that adhesive failure occurs. The sealant is cured at room temperature for 1h before it is trimmed. It is then immersed in the DTT cooling bath for 15min. before it is
demolded and placed back to the bath for an additional 45min before testing. During the test, the end pieces are moved apart at 0.05mm/s, until sealant debonds from an aluminium end piece. The maximum load to failure, Pmax is recorded as an indication of bond strength. The load to failure for
several sealant-aluminum pairs is shown in Figure 3.
0 20 40 60 80 100 120 140 -4 -10 -16 -22 -28 -34 -40 Temperature (ºC) Pma x (N ) NN WW PP AE UU LL DD VV
Figure 11 Maximum Load to failure, Pmax for Sealant-Aluminum Assemblies
The blister test is used to measure a fundamental parameter, the interfacial fracture energy (IFE), for each pair of sealant-aluminium. To prepare the specimen, sealant is cast on an annular aluminium plate and cured for 1 hour in room temperature and trimmed, after which it is placed in cooling bath for 15 minutes, demolded and placed back to the bath for 20 minutes before testing (18). To run the test, a servohydraoulic pump injects alcohol at sealant-aluminm interface through the opening in the aluminum plate. Alcohol pressure creates a blister on top of opening, the blister keeps growing until sealant completely debonds from the aluminium plate. Pressure and blister height are recorded during the test. The peak pressure and the corresponding blister height is used to calculate the IFE. Figure 4 shows IFE value for sealant- aluminium pairs.
0 200 400 600 800 1000 1200 -22 -34 -40 IF E (J /m 2) AD BB PP NN LL AE MM
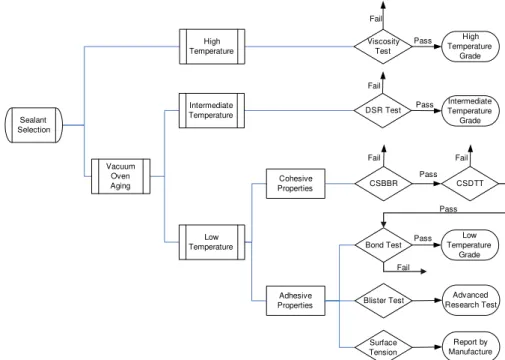
4. Procedure of Performance-Based Specification Guideline
A goal of this work was to provide a systematic screening process to help users select bituminous hot-poured crack sealants. Such a process is shown in Figure 13 where the viscosity of a sealant is first obtained at the suggested application temperature. Viscosity limits are 1.0 to 3.5 Pa.s. Other tests are conducted on aged sealant. Resistance to tracking in summer temperatures is measured with the DSR, the performance criteria being the flow and shear thinning coefficients. If a sealant does not meet the performance criteria at a selected temperature, the test is repeated at a lower temperature until it does. This sets the sealant grade for summer temperatures. The process is similar for the low temperature grade. The sealant is tested in the BBR for flexural stiffness and average creep rate followed by the assessment of extensibility in the DTT. The sealant low
temperature grade is obtained if bond strength is sufficient. If it does not, but the extension is greater than 10%, the low temperature grade is determined from the BBR cohesive test. Otherwise, the sealant is rejected for use at the test temperature and grade.
Cohesive Properties Adhesive Properties Viscosity Test DSR Test CSBBR CSDTT Surface Tension Bond Test Blister Test Pass Fail Sealant Selection High Temperature Intermediate Temperature Low Temperature Vacuum Oven Aging High Temperature Grade Intermediate Temperature Grade Fail Pass Pass Pass Pass Low Temperature Grade Report by Manufacture Advanced Research Test Fail Fail Fail
Figure 13 Screening process for the selection of bituminous roadway sealants.
5. Conclusion
Crack sealants are used in the preventive and corrective maintenance of roadways. Sealants are currently selected with an ASTM specification whose results do not allow for the selection of the better performing sealants. New sealant tests were developed based on the performance and aging of twelve sealants tested in the field and on the characterization of nineteen other sealants used in North America. These test provide fundamental sealant properties. They include a viscosity test to evaluate the workability of a sealant at its suggested pouring temperature, a vacuum oven aging test to simulate sealant weathering, a DSR test to assess tracking resistance in summer temperatures, a BBR test to measure stiffness in low temperatures, a DTT test to evaluate extensibility, also in low temperatures, and finally surface tension measurements, tensile bond strength, and blister testing to measure sealant adhesion. These test are used in cascade to assess the suitability of sealants for use in the diverse climatic regions of North America.
6. References
1. Belangie, M. C., and D. I. Anderson. Crack Sealing Methods and Materials for Flexible Pavements. Final Report, No. FHWA-UT-85-1, Utah Department of Transportation, Salt Lake City, 1985.
2. Masson, J-F., Collins, P., and Légaré, P. P., Crack Sealant Performance in Cold Urban Conditions, Canadian Journal of Civil Engineering 26, 1999, 395-401.
3. Masson, J-F and Lacasse, M. A. Considerations for a Performance-Bases Specification for Bituminous Crack Sealants, Flexible Pavement Rehabilitation and Maintenance, ASTM STP 1348, American Society for Testing and Materials, 1998.
4. Smith, K. L., and A. R. Romine. Innovative Materials Development and Testing. Volume 3: Treatment of Cracks in Asphalt Concrete-Surfaced Pavements. SHRP-H-354, 1993.
5. Collins, P., Veitch, M., Masson, J-F., Al-Qadi, I., Deformation and tracking of bituminous sealants in summer temperatures: pseudo-field behaviour. International Journal of Pavement Engineering, in print.
6. Masson, J-F., Collins, P., Margeson, J., Polomark, G., Analysis of Bituminous Crack Sealants by Physicochemical Methods: Relationship to Field Performance, Transportation Research Record 1795, 2002, 33-39.
7. Al-Qadi, I. L., E. Fini, M. A. Elseifi, and J.-F. Masson. Procedure for Viscosity Determination of Hot-Poured Bituminous Sealants. Transportation Research Record: Journal of the Transportation Research Board, TRR No. 1958, National Research Council, Washington, D.C., 2006, pp. 74-81.
8. Masson, J-F., Collins, P., Perraton, D., Al-Qadi, I., Rapid assessment of the tracking resistance of bituminous crack sealants. Canadian Journal of Civil Engineering 34 (2007) 126-131.
9. Al-Qadi, I.L., Loulizi, A., Aref, S., Masson, J-F., and McGhee, K. Modification of bending beam rheometer specimen for low-temperature evaluation of bituminous crack sealants. In Transportation Research Record 1933, Transportation Research Board, Washington, DC, 2005, pp. 97-106.
10. Al-Qadi, I.L., Yang, S.H., Elseifi, M., Masson, J-F., and McGhee, K. Specifications of bituminous-based crack sealants using modified bending beam rheometer. Paper presented at the 85th Annual Meeting of the Transportation Research Board, Washington, DC, 2006.
11. Al-Qadi, I. L., Yang, S-H, Dessouky, S., and Masson, J-F. Development of Crack Sealant Bending Beam Rheometer (CSBBR) Testing to Characterize Hot-Poured Bituminous Crack Sealant at Low Temperature, Journal of Association of Asphalt Paving Technologists Vol.76, 2007.
12. Smith, K. L., and Romine, A. R. Innovative Materials Development and Testing Volume 3: Treatment of Cracks in Asphalt Concrete-Surfaced Pavements. SHRP-H-354. Strategic Highway Research Program, National Research Council, Washington, DC, 1993.
13. Masson, J.-F., and Lacasse, M. A. Effect of Hot-Air Lance on Crack Sealant Adhesion. Journal of Transportation Engineering, ASCE, Vol. 125, No. 4, 1999, pp. 357-363.
14. Linde, S. Investigations on the Cracking Behavior of Joints in Airfields and Roads: Field Investigations and Laboratory Simulation. SP Report 1988:23. Swedish National Testing Institute, Borås, Sweden, 1988.
15. Cook, J. P., Weisgerber, F. E., and Minkarah, I. A. Evaluation of Joint and Crack Sealants. FHWA/OH-91/007, University of Cincinnati, Cincinnati, OH, 1990.
16. Al-Qadi, I. L., Yang, S. H., Dessouky, S. H., and Masson, J-F., Low Temperature Characterization of Hot-Poured Crack Sealant Using Modified SHRP Direct Tensile Tester, In print Transportation Research Record, 2007..
17. Masson, J. F., and Lacasse, M. A. (2000), “A Review of Adhesion Mechanisms at the Crack Sealant/Asphalt Concrete Interface,” Proceedings of the 3rd International Symposium on Durability of Building and Construction Sealants, Fort Lauderdale, FL.
18. Fini, E., Al-Qadi, I. L. and Masson, J-F. “A New Blister Test to Measure Bond Strength of Asphaltic Materials” Journal of Association of Asphalt Paving Technologists Vol.76, 2007. 19. Fini, E., Al-Qadi, I. L. and Dessouky, S. H. “Adhesion of Hot-Poured Crack Sealant to