Publisher’s version / Version de l'éditeur:
Cold Regions Science and Technology, 65, 3, pp. 314-325, 2010-11-24
READ THESE TERMS AND CONDITIONS CAREFULLY BEFORE USING THIS WEBSITE. https://nrc-publications.canada.ca/eng/copyright
Vous avez des questions? Nous pouvons vous aider. Pour communiquer directement avec un auteur, consultez la première page de la revue dans laquelle son article a été publié afin de trouver ses coordonnées. Si vous n’arrivez pas à les repérer, communiquez avec nous à [email protected].
Questions? Contact the NRC Publications Archive team at
[email protected]. If you wish to email the authors directly, please see the first page of the publication for their contact information.
NRC Publications Archive
Archives des publications du CNRC
This publication could be one of several versions: author’s original, accepted manuscript or the publisher’s version. / La version de cette publication peut être l’une des suivantes : la version prépublication de l’auteur, la version acceptée du manuscrit ou la version de l’éditeur.
For the publisher’s version, please access the DOI link below./ Pour consulter la version de l’éditeur, utilisez le lien DOI ci-dessous.
https://doi.org/10.1016/j.coldregions.2010.11.002
Access and use of this website and the material on it are subject to the Terms and Conditions set forth at
Small-scale laboratory experiments on the indentation failure of
polycrystalline ice in compression: Main results and pressure
distribution
Wells, J.; Jordaan, I.; Derradji-Aouat, A.; Taylor, R.
https://publications-cnrc.canada.ca/fra/droits
L’accès à ce site Web et l’utilisation de son contenu sont assujettis aux conditions présentées dans le site LISEZ CES CONDITIONS ATTENTIVEMENT AVANT D’UTILISER CE SITE WEB.
NRC Publications Record / Notice d'Archives des publications de CNRC:
https://nrc-publications.canada.ca/eng/view/object/?id=ade1d06c-2be1-4b1c-ad13-c9ea59b1ad0b
https://publications-cnrc.canada.ca/fra/voir/objet/?id=ade1d06c-2be1-4b1c-ad13-c9ea59b1ad0b
Small-scale laboratory experiments on the indentation failure of polycrystalline ice in
compression: Main results and pressure distribution
J. Wells
a,1, I. Jordaan
a,b,1, A. Derradji-Aouat
c,2, R. Taylor
a,⁎
a
Memorial University of Newfoundland, Faculty of Engineering and Applied Science, St. John's, NL, Canada A1B 3X5
bC-CORE, Morrissey Road, St. John's, NL, Canada A1B 3X5 c
NRC-IOT, Arctic Avenue, St. John's, NL Canada A1B 3T5
a b s t r a c t
a r t i c l e
i n f o
Article history: Received 13 January 2010 Accepted 16 November 2010 Available online xxxx Keywords:Compressive ice failure Fracture
Damage Crushing High-pressure zone
Laboratory indentation tests were performed with the objective of studying processes of ice failure during indentation and the pressure distribution at the ice-indenter interface. The tests were performed using a 20-mm indenter on ice specimens with dimensions of 20 × 20 × 10 cm. Specimens were made of polycrystalline ice with a grain size of ~ 4 mm. The test setup included the use of a tactile pressure sensor to measure the local pressure distribution at the indentation site. This area was found to consist of isolated zones of very high pressure compared to the average pressures found during the tests. These peaks in pressure were often seen to vary in intensity throughout the test, analogous to the behavior seen during medium and full-scale interactions. The pressure distribution showed that the release of localized spalls are preceded by a build-up of pressure and followed by a decrease in total pressure as well as contact area. Isolated periods of cyclic-load crushing were accompanied by periodic load drops and regular decreases in contact area. In this case, the pressure distribution showed a centralized area of pressure that remained relatively constant throughout the crushing event, which supports the idea of dynamics associated with activity in the damaged layer.
© 2010 Elsevier B.V. All rights reserved.
1. Introduction
Increased activity in the offshore industry as well as shipping in arctic and subarctic regions has underscored the need for improved methods for the design of engineered structures, such as ships and offshore platforms, under ice conditions. During full-scale interactions with ice in compression, most of the load is transmitted to a structure through high-pressure zones (hpzs) that are distributed in the interaction area. These hpzs are entities formed due to localization of contact resulting primarily from local fracture processes; highly confined ice near the center of a hpz allows for the transmission of concentrated pressures to the structure. These zones are often concentrated near the center of the ice-structure interface and will vary in time and space. Dynamic processes associated with individual
hpzs are a direct result of physical mechanisms within the ice, and
occur even for rigid structures. Since each hpz varies in intensity and location with time, random averaging of the loads across the interaction area will result from localized non-simultaneous failure events. These are important considerations for design, and require
detailed knowledge of ice failure processes. To improve understand-ing of the mechanics of ice failure, emphasis here has been placed on the behavior of a single hpz.
Mackey et al. (2007)demonstrated that the interplay between the different ice failure processes associated with an individual high-pressure zone could be well studied using high-speed video syn-chronized with data from load cells and tactile pressure sensors. From this work, it was evident that the effects of microstructural modi-fication (damage) and fracture processes largely govern the behavior of hpzs. It is well known from fracture mechanics that flaws play a critical role in brittle crack propagation. The relative influence of damage and fracture in determining the failure behavior of an hpz has not been clearly established and the present program is aimed in part at clarifying this issue. Another aspect considered in the present program was the study of the role of large grain boundaries as flaws that trigger compressive ice failure; this topic will be explored in a later paper.
1.1. Fracture and damage: Two distinct processes
As discussed byJordaan (2001), brittle behavior is observed in the medium scale (order of a square meter) for rates higher than a few millimeters per second. The compressive ice failure mode commonly referred to as “crushing” is a complex process involving localization of load into high-pressure zones. The behavior of hpzs is influenced largely by fracture and damage processes in the ice. Fracture refers to the process of material separation associated with brittle crack
Cold Regions Science and Technology xxx (2010) xxx–xxx
⁎ Corresponding author. Captain Robert Bartlett Building, Morrissey Road, St. John's, NL, Canada, A1B 3X5. Tel.: +1 709 864 4370.
E-mail addresses:[email protected](J. Wells),[email protected](I. Jordaan),
[email protected](A. Derradji-Aouat),[email protected](R. Taylor). 1
Tel.: +1 709 864 6787. 2
Tel.: +1 709 772 7960.
COLTEC-01583; No of Pages 12
0165-232X/$ – see front matter © 2010 Elsevier B.V. All rights reserved. doi:10.1016/j.coldregions.2010.11.002
Contents lists available atScienceDirect
Cold Regions Science and Technology
propagation. The main driving mechanism for brittle fracture is the release of energy from the highly stressed crack-tip region through the creation of new crack surfaces. Damage refers to the effects of microstructural modification on the constitutive behavior of the material. Damage mechanisms (described below) are largely dissipa-tive internal processes that occur in the ice, though some processes (e.g., localized pressure melting) are reversible. Central to this work is the distinction that fracture and damage are two different types of
processes. This differentiation is essential, since these two types of
processes are associated with different physical mechanisms, they have different consequences for ice pressure behavior, and they must be modeled using different subsets of mechanics. Further, both pro-cesses are essential to the understanding of ice crushing behavior.
Spalling failures are local fracture events, which result in the removal of a discrete piece of ice (i.e., a spall) from the contact zone as local cracks propagate to a nearby free surface.Croasdale (1975)and
Croasdale et al. (1977)were first to highlight the tendency of fractures to run to free edges during spalling failure. In this early work, an initial ice load model was developed using plasticity theory to provide an upper-bound estimate of ice loads.Croasdale et al. (1977) used a Tresca yield criterion and assumed failure occurred on slip planes as a result of plastic yielding. This model was applied to a series of failures along parallel shear planes and was developed to provide an estimate of maximum quasi-static load during an interaction. The tendency of fractures to run to free edges during spalling has important implica-tions in the formation of high-pressure zones.
Spalls are observed to occur frequently near the edges of the ice-structure contact zone; seeFig. 1. For interactions involving sheet ice this tendency is particularly evident, as hpzs tend to be concentrated near the center of the ice sheet. This concept of ‘line-load’ contact geometry was first introduced by Joensuu and Riska (1989) and explored further byFransson et al. (1991)andTuhkuri (1993). The occurrence of a spall contributes to the formation of hpzs and is often accompanied by a sudden decrease in contact area and a drop in load. At the same time, fractures will occur, destroying all or part of other
hpzs in the contact region. As the interaction progresses, spalls occur
intermittently, resulting in the birth, evolution and death of hpzs throughout the interaction zone.
The occurrence of spalling is also observed to correspond to the pressure-area scale effect, whereby average pressure is observed to decrease for increasing area. Unlike classical mechanics, fracture mechanics theory exhibits inherent scale dependence. For fracturing materials failure strength is linked to flaw size. Failure occurs at a
given stress level only if the material contains a flaw larger than some critical size (i.e., the specimen contains a ‘critical’ flaw). Natural ice contains many flaws such as grain boundaries, brine pockets, pores and other pre-existing cracks. Since larger specimens likely contain more critical flaws than a smaller sample, a statistical scale effect is expected. Probabilistic models of the weakest-link variety are seen as the most promising approach to capture these effects, though adaptations are necessary to account for compressive loading (Jordaan et al., 2007a). Since ice is a viscoelastic material, it is also important that velocity scale with geometry to maintain strain rate similitude; seeTaylor (2010)for further treatment of scale effects in compressive ice failure.
Previous work by the present group of researchers has shown that the hpzs have a failure mechanism that does not include large fractures (see for exampleMeglis et al., 1999; Melanson et al., 1999; Xiao, 1997). Within hpzs, the state of stress is triaxial. Profound microstructural changes are observed to take place, particularly in the zones of intense shear in the layer of ice adjacent to the indenter. In regions of low confinement and high shear, near the edges of an hpz, microcracking is prevalent. Nearer to the center of the hpz, higher confining pressures tend to suppress fracture and promote dynamic recrystallization and local pressure melting. The microstructural changes associated with microcracking, dynamic recrystallization and local pressure melting result in softening of the ice at the ice-indenter interface so as to form a ‘layer’ (Jordaan, 2001). These processes are often collectively referred to as ‘damage’ processes, since they are the cause underpinning measurable changes (soften-ing) of the macroscopic constitutive behavior of the ice.
The observation of a crushed layer of ice in the indentation zone was first reported by Kheisin and his co-workers (Kheisin and
Cherepanov, 1973; Kurdyumov and Kheisin, 1976). In 1967, they
conducted dropped ball tests using a 300 kg steel ball to impact the surface of an ice sheet at velocities in the range 1–6 m s− 1. In these
tests, microcracking along the basal plane was observed to be an important mechanism and the indentation zone was characterized by a “finely dispersed crushed layer behaving as a layer of viscous liquid.” Attention was drawn to the effect of pressure melting and frictional heating and the extrusion process was modeled by treating the crushed layer as a viscous fluid, using essentially lubrication theory.
During medium-scale indentation tests at Hobson's Choice Ice Island (Frederking et al., 1990), an extensive white layer of crushed material with occasional ‘blue’ recrystallized zones was observed (Jordaan, 2001). In these tests, a distinct boundary between the damaged ice and parent ice was visible at some depth from the contact interface, with evidence of lateral grain motion along the boundary.Muggeridge and Jordaan (1999)also reported observations of a layer of fine-grained and microcracked ice in thin sections of ice samples collected from full-scale iceberg impact tests conducted on Grappling Island, Labrador (Crocker et al., 1997). Muggeridge and Jordaan (1999)describe the “crack-like” layer boundary as being similar to an extrusion plane, where grains within the zone are forced toward the free surface. Similar results for brittle tests during the Rae Point experiments were reported (Masterson et al., 1999). From these tests it was determined that the flow of energy into and out of the indenter is an important consideration during dynamic ice crushing
(Jordaan and Timco, 1988). These early field observations also
highlighted the important role of damage processes during an ice-structure interaction, and guided laboratory tests (see for example
Meglis et al., 1999; Melanson et al., 1999) aimed at understanding the relationship between confining pressure and damage.
In ice under conditions of high shear and low confinement microcracks form. These small fractures propagate in zones where local tensile stresses occur, and then arrest nearby in zones of higher compression. Recrystallization is found near and surrounding these microcracks; this recrystallization process increases with time and strain. Increased confining pressure suppresses the formation of Fig. 1. Schematic representation of the spalling and crushing processes.
microcracks. Microcracking generally does not lead to failure of the specimen, except under very low confinement (for example ‘slabbing’ under uniaxial conditions).
Dynamic recrystallization is a dissipative process of material reorganization that occurs through severe grain modification under conditions of high confinement and shear, resulting in the formation of finely grained ice. Unlike brittle processes, recrystallization is not a process that can be observed with high-speed video camera—thin sections are required. Recrystallized ice has often been identified incorrectly as intact ice, particularly in ‘blue zones’ observed at medium scale. These blue zones are often contained within an interaction area and appear to be much clearer than the surrounding crushed ice, which is white in appearance due to the entrainment of air. Thin-sectioning of blue zones has revealed that these regions often contain highly recrystallized ice. These zones are believed to be the center of individual hpzs, in which pressures have been measured to be as high as 70 MPa (Jordaan, 2001).
Reproduction of these highly confined stress states during triaxial tests has very clearly shown that ice becomes highly recrystallized under controlled laboratory conditions, as well as under the natural conditions present during an ice-structure interaction (Meglis et al.,
1999; Melanson et al., 1999). For further discussion of dynamic
recrystallization, see for example,Sinha and Cai, 1992; Barrette et al., 2002; Barrette et al., 2003.
Under sufficiently high hydrostatic pressures, ice will melt; see for instance Nordell, 1990. Localized pressure melting is a thermody-namically reversible process, and is expected to occur preferentially in regions of higher energy state (e.g., grain boundaries) prior to the onset of bulk melting. This localized pressure melting contributes to the loss of bearing capacity of the layer that ultimately leads to an extrusion event. Since this is a reversible process, softening associated with this mechanism is reversed (i.e., ice hardens) once the local pressure drops below the melting pressure. While a detailed treat-ment of the individual mechanisms is beyond the scope of the present work, the softening effects associated with these damage mechanisms are believed to be essential in understanding dynamic ice crushing behavior. The interplay between damage and fracture processes is also an important aspect of compressive ice failure (Jordaan and Xiao, 1992).
1.2. Extrusion and cyclic loading
During crushing, it has been observed that damage localizes into a band of highly damaged ice adjacent to the indenter, commonly referred to as the ‘damaged layer’; seeFig. 2. The formation of this layer is associated with damage localization due to progressive softening. As the indenter deforms the ice, damage processes become activated as a means to dissipate the imposed mechanical energy. The occurrence of these processes results in softening of the ice. The more the ice softens, the more the strain becomes localized into the layer, since the softened layer will deform much more readily than the much stiffer competent ice behind it. Increased local strain in the layer
means more energy flows into the damaged ice, which triggers further damage to dissipate the energy. This tendency for progressive damage and softening in the layer ultimately results in a sudden loss of bearing capacity of the damaged ice, resulting in extrusion of crushed ice particles from the layer.
Extrusion is the ejection of disintegrated ice particles from the edges of high-pressure zones resulting from exceedance of the internal shear resistance (viscous and frictional) in the damaged layer. The occurrence of an extrusion event may also be referred to as a ‘damage failure’ or a ‘layer failure’ event, since it corresponds to the ice in the layer reaching a critical state of damage. A crushing–extrusion event can occur either as a single event, multiple intermittent events or as a continuous cycle of events. The occurrence of periodic extrusions is also accompanied by cyclic loading conditions. Cyclic loading has been observed for structures with nominal interaction areas ranging from a few square centimeters in the laboratory, to areas on the order of tens of square meters in the field (see for instance,Jordaan 2001for discussion).
It has been suggested by some authors that fluctuations in load are entirely due to brittle failure (for exampleDaley, 1992 and Gagnon, 1999). While spalling fracture is an important part of compressive ice failure, experimental evidence indicates that fracture processes are only partly responsible for the crushing mode of failure. While the nature and source of cyclic ice crushing behavior have yet to be fully ascertained, research presented in this paper suggests that a key part of the answer lies in the behavior of ice in the damaged layer. Here we explore the link between the pressure distribution at the ice-indenter interface and the damage behavior occurring in the ice. The effect of large grain boundaries on the fracture behavior of the ice will be examined in a later paper.
2. Approach to laboratory testing
The overall objective of the research is to improve understanding of ice-structure interaction from the standpoint of the mechanics associated with observed ice failure. The understanding has been derived from experimental observation. The present research group has analyzed a considerable amount of data from field and medium-scale tests (see for instance, Jordaan et al., 2005, 2007b). These analyses have provided empirical information for use in design. While many aspects of the mechanics have been successfully unravelled (Meglis et al., 1999; Melanson et al., 1999; Jordaan, 2001), much remains to be understood and modelled.
The present series of laboratory tests was formulated to answer questions regarding failure processes as related to the behavior of high-pressure zones in ice-structure interaction. An idealization of a
hpz is shown inFig. 1. Although the laboratory tests are intrinsically of interest in terms of ice mechanics, the question naturally arises as to the relationship of observed phenomena to those at larger scale. Identification of the principles is an important part of making asso-ciation at different scales.
The first association of importance is the close relationship of hpz behavior at different scales.Barrette et al. (2002, 2003) and Li et al.
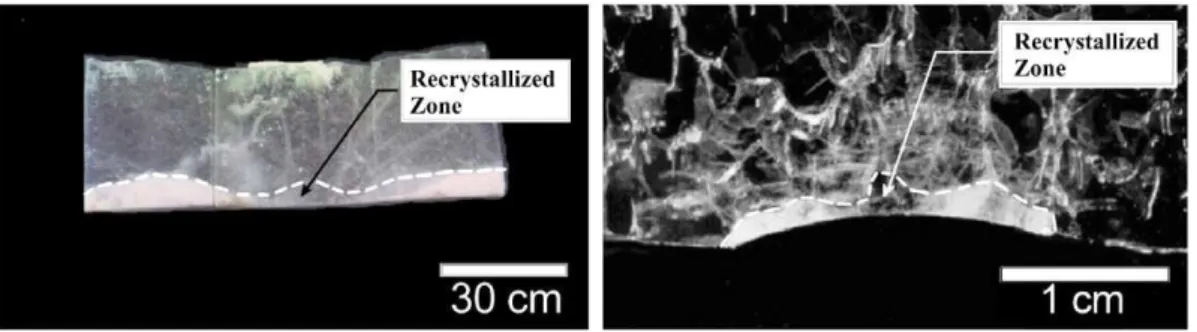
Fig. 2. Ice sections taken perpendicular to ice-structure interface for medium-scale field indentation tests (left) and small-scale laboratory tests (right); seeBarrette et al., 2003. The dashed white line outlines the approximate boundary of the ‘damaged layer’ that forms near the indentation zone.
(2004)conducted tests using a small (20 mm diameter) indenter that was a scaled-down version of a medium-scale indenter used in the field; seeFig. 2. Treating just the formation of the damaged layer, damage mechanics may be employed (see for instance,Xiao, 1997; also see Fig. 3). Damage mechanics, like elasticity, plasticity and viscoelasticity theory, is a theory of continuum mechanics. These materials exhibit scale-independent behavior.
It has been observed in medium-scale field experiments at rates less than a few millimetres per second, damage processes occur, but local spalling does not occur (Frederking et al., 1990). Damage is distributed over a larger region below the indenter and does not localize into a layer. This has also been found in small-scale experiments (Barrette et al., 2003; Li et al., 2004). Analysis of data for slow interaction events byLi et al. (2004)and byJordaan et al. (2009)indicates that there will be little scale effect associated with this failure mechanism. The transition of ice behavior from continuum (damage) processes to behavior in which spalling is widespread explains the transition from scale-independent to scale-dependent behavior (Taylor, 2010).
In the present series, the scaling of hpzs was exploited as a means to understand the processes of ice-structure interaction. Since the mechanics of hpzs apply at any scale (Jordaan, 2001), studying ice mechanics using laboratory tests is seen as a cost-effective means of studying some fundamental aspects of ice failure behavior. In the experiments reported in this paper, a 20-mm spherical indenter was used to model a single, stationary hpz. In studying the mechanics associated with processes in the immediate vicinity of a single hpz, insights into processes associated with hpzs at full-scale will be gained. 3. Experiments
3.1. Sample preparation
Results presented in this paper represent work completed as part of four test series that were performed over a period of 4 years. In order to prepare the specimens, large blocks of bubble-free ice were purchased commercially and then crushed using a commercial ice crusher. The crushed ice was sieved to obtain seed ice with sizes in the range of 3.75–4.25 mm. The seed ice was vacuum moulded using a Fiberglas mould. First, the mould was filled with seed ice and then sealed using a rubber membrane. Next, a vacuum was applied in order to evacuate air from the inter-seed voids. Distilled, deaerated water with a temperature of approximately 0 °C was then drawn into the mould under a vacuum. The ice was allowed to freeze at −10 °C for at least 3 days. Finally, the mould was then left to release at room temperature and the moulded specimens were returned to approx-imately −18 °C for storage. A few days prior to testing, the specimens
were moved to the test room, which was held at the test temperature of −10 °C. At that time, a milling machine was used to machine each moulded sample into two finished test specimens. The finished test specimens of bubble-free, polycrystalline ice had an average grain size of 4 mm and overall dimensions of 20 × 20 × 10 cm. Note: to study the relationship between fracture behavior and large grain boundaries, some specimens in this research program were embedded with a single, large monocrystal. The presence or absence of such crystals was not found to affect the processes of interest in the present paper. Fracture behavior associated with these tests will be discussed in a later paper.
3.2. Test parameters/test matrix
A total of 46 tests were performed using a combination of differing indenter speeds and indentation locations. The parameters used for each test are given inTable 1. The tests were completed using a 20 mm, spherical indenter with a radius of curvature of 25.6 cm. The indenter used was made from solid steel and was orders of magnitude stiffer than the ice (i.e., rigid indenter). The indenter geometry corresponded to that of a spherical indenter used in field tests (Frederking et al., 1990), that was scaled down by a factor of 50. The choice of indenter was based on work done byBarrette et al. (2003)
andMackey et al. (2007). Unlike the tests of Barrette and his co-workers, in which the test specimens were enclosed within a steel mould during the indentation event, in the present setup the ice was not confined, thereby allowing fracture in the ice. Multiple indenter speeds were used depending on the test; see Table 1. The dis-placement rates for the slow (0.2 mm/s) and medium (2–5 mm/s) velocities were chosen to be consistent with those used byBarrette et al. (2003). The medium speeds used in this study represent a transition between ductile and brittle material behavior of the ice. The higher rates (8–10 mm/s) used in this series were chosen to investigate the brittle material behavior beyond the transition range.
3.3. Experimental setup and instrumentation
The tests were conducted using a Materials Testing System (MTS) located in a room held at −10 °C. The basic test setup is shown in
Fig. 4. The test setup involved placing an ice specimen on the test platform so that the indenter would make contact at the desired distance from the edge of the specimen. The samples were not confined during the tests and the maximum actuator displacement for each test ranged from 3 mm to 20 mm. For most tests, the penetration depth used was enough to cause a large-scale fracture of the speci-men, whereby the crack ran all the way to a free edge terminating the test. In a few cases, the load was removed before the specimen could achieve this fracture. Information regarding whether the block fractured before the test completed is given inTable 2. The tested specimens were photographed immediately after each indentation.
The tests were controlled and recorded using the MTS controller and recording equipment. A 250 kN MTS load cell was used with a sampling frequency of 20 kHz. During each test, the total force from
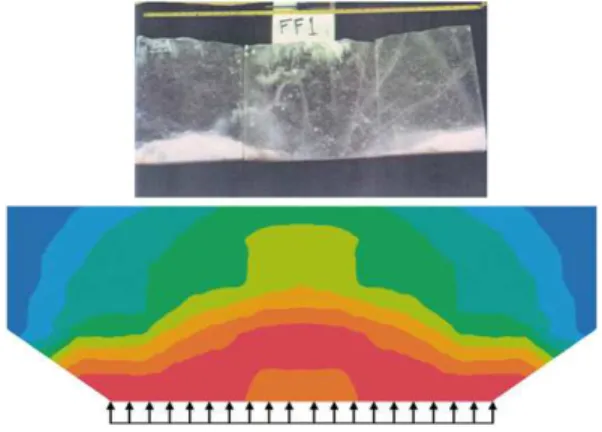
Fig. 3. Illustration of damage processes. Top: field observation in a thick section; thin sections of the ice indicate that the center portion is highly recrystallized (Jordaan, 2001). Bottom: computer simulation of damage development using state-variable approach (afterXiao, 1997).
Table 1 Test matrix.
Speed (mm/s)
Indentation location
Center Intermediate Edge
0.2 2 5 2 2 3 7 3 3 1 - -4 5 - -5 2 - -8 1 - -10 9 3 2
the MTS load cell and the LVDT displacement were recorded. These traces were synchronized using a one shot synchronizing electrical pulse that was generated at the start of each test. The tests were videotaped using a high-speed black and white video camera that recorded at frame rates ranging from 500 to 6000 fps depending on the length of the test in question. This camera was used to help find a correlation between fluctuations in the load traces and visual events
such as crushing, spalling and fracture. The videos clearly show the formation and propagation of cracks as well as crushing and spalling behavior in the area of the indenter.
The experimental setup also incorporated a Tekscan I-Scan® pressure measurement system, which is comprised of a thin, flexible, resistance based sensor that is connected to an external PC via a USB handle (seeFig. 4). A model 5051 sensor was used, which consisted of Fig. 4. Photograph of experimental apparatus used during test program (right) and a sketch showing main features of apparatus (left).
Table 2
Summary of results found for each test. Test no. Indentation location Speed (mm/s)
Peak maximum pressure (MPa)
Peak average pressure (MPa) Peak force (kN) Test duration (s) Test terminated by large-scale fracture 14 Edge 10.0 31.9 25.4 1.45 0.2 Yes 15 Edge 2.0 92.6 38.1 2.18 1.0 Yes 16 Edge 0.2 108.4 41.7 2.19 12.2 Yes 17 Intermediate 2.0 98.8 39.0 9.70 1.3 Yes 18 Intermediate 0.2 111.7 43.5 6.46 3.9 Yes 19 Center 0.2 97.0 37.0 9.84 11.3 Yes 25 Intermediate 2.0 118.7 36.3 7.84 1.1 Yes 26 Center 2.0 122.0 43.6 9.56 2.1 Yes 27 Intermediate 0.2 99.7 54.1 5.03 3.2 Yes 28 Intermediate 0.2 84.9 59.1 7.64 4.8 Yes 29 Intermediate 2.0 99.7 42.9 7.40 1.4 Yes 30 Center 10.0 81.4 36.6 9.50 0.4 Yes 31 Intermediate 10.0 109.0 36.5 8.60 0.3 Yes 32 Center 10.0 96.7 34.8 8.61 0.2 Yes 34 Center 0.2 90.7 54.4 7.47 7.2 Yes 35 Edge 2.0 68.4 38.1 2.90 0.3 Yes 36 Edge 0.2 84.9 44.9 1.30 4.3 Yes 37 Edge 10.0 68.4 32.1 2.12 0.1 Yes 38 Edge 2.0 76.4 45.2 1.64 0.3 Yes 39 Center 2.0 56.7 20.9 8.98 1.8 Yes 40 Center 2.0 55.7 22.7 9.70 2.0 Yes 41 Center 10.0 60.0 19.9 9.73 1.0 No fracture 42 Center 10.0 61.7 19.3 9.40 0.4 Yes 43 Intermediate 2.0 62.2 22.3 8.17 1.5 Yes 44 Intermediate 2.0 79.0 22.4 8.30 1.3 Yes 45 Intermediate 10.0 65.1 20.0 7.94 0.5 Yes 46 Intermediate 10.0 57.0 17.7 7.45 0.3 Yes 47 Center 10.0 72.1 17.5 8.41 0.5 Yes 48 Intermediate 2.0 62.0 18.5 5.98 0.8 Yes 49 Center 10.0 119.9 20.8 9.50 0.3 Yes 50 Center 10.0 98.0 21.5 10.52 1.0 No fracture 51 Center 10.0 79.1 20.4 8.64 0.4 Yes 52 Intermediate 0.2 49.4 21.7 4.93 3.9 Yes 53 Intermediate 2.0 66.8 25.7 8.77 1.7 Yes 54 Intermediate 0.2 47.5 21.2 4.14 3.8 Yes 55 Center 10.0 78.1 19.4 9.92 0.4 Yes 56 Center 4.0 79.6 23.1 11.04 1.6 No fracture 57 Center 4.0 71.8 19.6 10.08 1.3 Yes 58 Center 4.0 54.2 17.5 9.43 1.3 No fracture 59 Center 4.0 53.7 17.2 9.56 0.9 Yes 60 Center 4.0 61.9 21.3 10.60 1.0 Yes 61 Center 5.0 65.9 17.1 9.50 0.6 Yes 62 Center 5.0 52.0 18.8 7.74 0.7 No fracture 63 Center 3.0 51.3 18.8 7.22 1.1 No fracture 65 Center 10.0 49.3 16.9 9.76 0.5 Yes 66 Center 8.0 52.9 15.3 8.55 0.5 Yes
a 31.25 cm2
array of 44 × 44 ‘sensels.’ These sensels represent the intersection of lines of semi-conductive ink that are drawn onto the sensors in a grid pattern. The pressure sensor used in these tests had a pressure rating of 172.4 MPa (25,000 PSI), with the exception of the sensor used in tests 14–19, which had a pressure rating of 34.5 MPa (5,000 PSI). The sensor had a thickness of 0.10 mm (0.004") where there is ink present and a thickness of 0.05 mm (0.002") where there is no ink. Measurements were taken by recording the changes in current flow at each sensel giving the applied force distribution and contact area. Using the data acquisition system for the tactile sensors it was possible to record the force distribution at a rate of up to 100 frames per second. The pressure distribution was then calculated using the applied force and total contact area for each time.
4. Results and discussion
4.1. Localization of pressure into hpzs
An example of the total force data recorded by the pressure sensor and the load cell is shown inFig. 5. In most of the tests there is excellent agreement between the load traces recorded by the pressure sensor and load cell (for example in Fig. 5a). In a few plots it is apparent that towards the end of the tests the total force recorded by the sensor is higher than that recorded by the load cell (for example in
Fig. 5b). Improved calibration procedures are presently being
developed to correct for this discrepancy.
The pressure data that was acquired from the pressure sensor was plotted to show the maximum pressures and average pressures recorded for each time during each experiment. The maximum pressure was found to be higher than the average pressure in any given test. As may be seen fromTable 1, the peak average pressures were in the range of approximately 15–60 MPa, while peak maximum pressures are routinely found to be in the range of approximately 32– 122 MPa. By plotting the three-dimensional pressure distributions over the course of a test it is apparent that these peaks in pressure are highly localized and do not remain stationary throughout a test. For example,Fig. 6gives a series of plots showing the evolution of one of these pressure peaks. This observation is an important one since similar high, localized pressures are also seen in medium-scale tests. For exampleFig. 7shows a series of pressure measurements that were recorded during the medium-scale test series at Grappling Island (Ralph et al., 2004).
4.2. Classification and criteria
Each test result was reviewed individually. Particular attention was paid to comparing the evolution of the total force recorded by the load cell to the corresponding pressure distributions measured by the Tekscan sensor. Synchronized high-speed videos were used to provide further confirmation of the events where possible. For every test, each individual failure behavior was classified. The severity of each behavior was then ranked according to whether the behavior was found to occur frequently, moderately often, or infrequently (Table 3). The overall trends were then summarized by averaging the severity over all the tests at each speed.
Given the tactile sensor's relatively low sampling rate (100 fps), caution had to be exercised when interpolating the observations in order to classify observed behaviors. But, many clear cases of each behavior could be observed, which allowed for confidence in the overall results. In the case of tests performed at edge locations, the failure behavior was very heavily influenced by the proximity of the indenter to the edge of the specimen. The failure in these cases was mostly dominated by the development of one large radial crack. Therefore, the present analysis is mainly based on tests performed at intermediate and center locations.
Fig. 5. Total force versus time for two experiments recorded by the load cell and the pressure sensitive film.
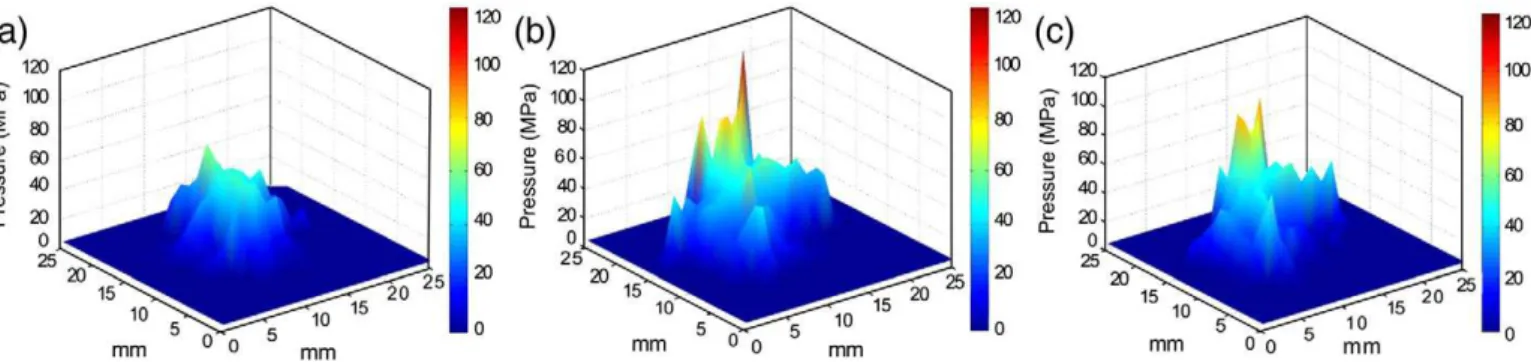
Fig. 6. Three-dimensional plot of pressure distribution over the indenter during a laboratory test: (a) before peak maximum local pressure (build-up), (b) at the instant of peak maximum local pressure, and (c) after peak maximum local pressure peak (decay).
The observed failure behavior was categorized into the following failure types, which are further illustrated inFig. 8:
• Ductile behavior: Ductile behavior corresponds to a steady rise in the total force and contact area with time (due to the spherical shape of the indenter). The most obvious examples of this type of behavior occur at slow rates (0.2 mm/s). During slow rate tests, very little
localized spalling or crushing occur, but occasional isolated crushing events have been observed. Permanent deformation results from creep enhanced by distributed damage processes in the ice around the indentation zone. When rates are increased past 2 mm/s, ductile behavior starts to become frequently disrupted by other failure processes, usually isolated crushing events but also localized spalls and mixed mode. Overall, the amount of ductile behavior observed decreases as the indentation rate increases.
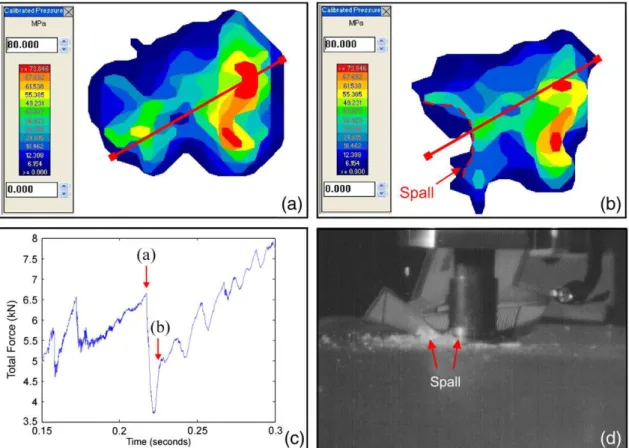
• Localized spall: A localized spall occurs when a single flake of ice breaks away from the periphery of the damaged layer, leading to a sharp drop in load. In the case of a spall, the pressure distribution often shows that prior to the release of a spall, there will be a localized increase in pressure. This is followed by a decrease in contact area as the spall is released. This leads to a decrease in the total pressure corresponding to the reduction in contact area and load drop.Fig. 9shows an example of the time immediately prior to and immediately after the release of a spall. It is obvious that the decrease in total load corresponds to a decrease in contact area on the pressure sensor, and the extrusion of material from under the indenter as seen in the high-speed videos. It is also observed that the frequency and severity of localized spalling increases with increas-ing indentation rates.
• Isolated crushing events: This type of crushing event is represented by a drop in total force combined with the reduction of pressure from the center of the hpz, with little change in contact area (Fig. 10). The loss of pressure in this case is due to the sudden failure of the damaged layer, which results in the extrusion of crushed ice particles from the periphery of the hpz. This is distinctly different from a spall, in which the pressure drops in response to the loss of a large, asymmetric area due to the removal of a flake of ice from one side of the hpz. Tests at both center and intermediate locations show isolated crushing events at all speeds, with a peak in frequency of this behavior at rates of 2–5 mm/s.
Fig. 7. Three-dimensional pressure distribution showing a localized peak in pressure from the Grappling Island tests (reproduced fromRalph et al., 2004).
Table 3
Summary of failure behaviors found for each test. Test no. Number of local spalls Ductile⁎ Isolated crushing⁎ Mixed mode⁎ Cyclic-load crushing events Duration (s) Freq. (Hz) 14 1 1 0 3 0 0 15 4 1 0 2 0 0 16 0 3 1 0 0 0 17 3 2 2 1 0 0 18 0 3 1 0 0 0 19 0 3 1 0 0 0 25 4 2 1 1 0 0 26 6 2 2 2 0.23 44 27 0 3 1 0 0 0 28 0 3 1 0 0 0 29 4 2 1 1 0 0 30 6 2 2 2 0 0 31 6 2 1 3 0.09 89 32 3 2 2 1 0 0 34 0 3 1 0 0 0 35 2 2 0 1 0 0 36 0 3 1 0 0 0 37 1 2 0 3 0 0 38 4 2 0 2 0 0 39 0 2 2 1 0 0 40 4 2 1 1 0.22 55 41 9 1 0 3 0 0 42 1 2 1 2 0 0 43 3 2 2 1 0 0 44 4 2 2 1 0 0 45 5 1 1 2 0 0 46 4 1 1 2 0 0 47 9 1 0 3 0 0 48 0 2 1 1 0 0 49 1 2 1 3 0 0 50 11 1 0 3 0.05 80 0.04 100 51 4 1 1 3 0 0 52 0 3 1 0 0 0 53 4 2 2 1 0 0 54 0 3 1 0 0 0 55 3 1 1 3 0 0 56 7 1 1 2 0 0 57 9 1 1 2 0.13 80 58 7 1 1 3 0 0 59 6 2 1 1 0.09 67 60 4 2 2 1 0.23 70 61 6 2 2 2 0.12 59 62 6 2 2 1 0 0 63 2 2 2 1 0 0 65 10 1 0 3 0 0 66 8 1 1 3 0 0
⁎ Never (0), infrequent (1), moderate (2), and frequent (3).
Fig. 8. Total force from MTS load cell as a function of time for Test 26,Table 2. Load trace shows examples of the multiple failure behaviors described in this paper. In the case of behaviors that have multiple repetitions in this test (for example localized spalls), only one representative example of each behavior has been highlighted.
Fig. 9. Plots for a sample spalling event showing: a color map of the pressure distribution (a) prior to the release of a spall (t = 0.218 s) and (b) after the spalling event (t = 0.226 s). The solid red line in (a–b) shows the maximum extent of the contact zone before and after the spall occurs, the dashed red line represents the boundary of the spall, (c) time trace of the total MTS load cell force, and (d) representative frame from the high-speed video.
Fig. 10. Plots for isolated crushing event showing: color map of the pressure distribution (a) prior to the isolated crushing event and (b) after the isolated crushing event. (c) Time trace plot of total MTS load cell force and (d) representative frame from the high-speed video at the time of the event.
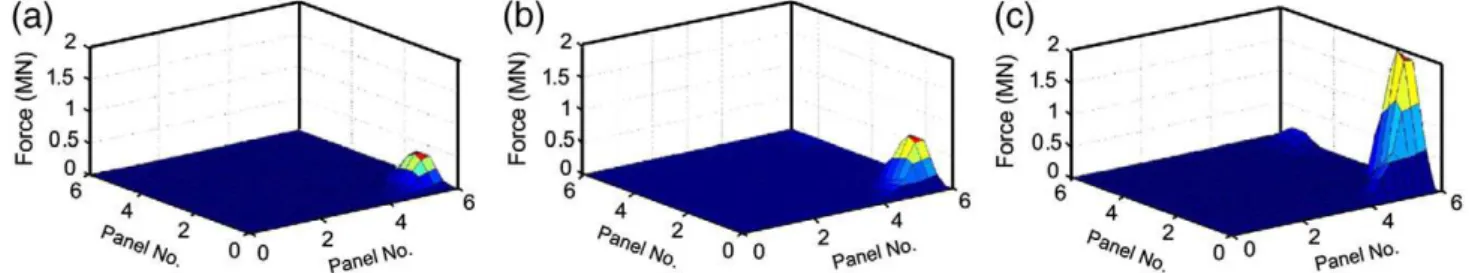
• Cyclic-load crushing events: Cyclic-load crushing events were only observed in 8 of the 46 tests performed in this series and account for only 0.9% of the total duration for all the tests. They represent isolated and distinct regions of crushing that can be seen most frequently in tests performed at rates of 2–5 mm/s. At medium rates, these events are visually distinct from spalling events. In the fast rate tests, the events are less obvious and are very infrequently observed. High-speed video footage of the tests shows clearly the continuous extrusion of material from under the indenter. These cyclic-load crushing events are characterized by dynamic activity that is apparent on the synchronized load traces. The total force data shows an increasing trend during the events and the load cycling is not interrupted by any other failure behavior (e.g., no localized spalls occur during the crushing event). These events are sometimes immediately preceded by a localized spall. Two representative examples of isolated crushing events are given inFigs. 11 and 12. Each successive drop in load is accompanied by the ejection of material from the indentation area. This extrusion is apparent on the pressure distribution as the periodic reductions in contact area from the periphery of the loaded area. The peaks in pressure in this case are mainly concentrated in the central regions of the indented zone and remain relatively constant throughout the entire crushing event.
• Mixed mode: This failure behavior represents a combination of crushing and small, localized spalls. In this case, the total force and pressure distribution is observed to be irregular, with multiple drops in load corresponding to crushing and spalling events. This behavioral mode was used to classify observed results that did not clearly fit into any of the above four cases. Mixed mode behavior was observed in all tests with speeds above 2 mm/s. The behavior showed an increasing trend as rates were increased.
4.3. Rate dependence and the local pressure distribution during ice failure processes
The failure behavior was found to be very rate dependent. This trend is illustrated inFig. 13, which shows examples of representative load traces from tests at three rates. For the slow speed tests (0.2 mm/ s) ductile behavior was dominant and no spalling events or cyclic-load crushing was observed. For these tests, a few isolated crushing events did occur, but were very infrequent.
For tests with rates in the medium to fast range, the behavior became much less predictable and was comprised of a complicated mix of behaviors. In medium rate tests (2–5 mm/s), the dominant behavior appeared to be a mix of ductile and crushing behavior, with some localized spalling. Isolated crushing events were at their most Fig. 11. Crushing event observed during a test with an indenter speed of 2 mm/s. (a–d) Pressure distribution recorded during a crushing event. The red outlines in (a–d) represent equal areas resulting from drawing a circle around the contact area in (c). (e) Load cycling observed in the total force (MTS load cell) time trace. (f) Frame taken from a high-speed video recording of the event.
prevalent in this range as were cyclic-load crushing events. Some localized spalling and mixed mode behavior were observed in this range, but these behaviors did not occur with the same frequency or severity that they did in faster rate tests.
In higher rate tests (8–10 mm/s) the behavior showed a tendency for brittle behavior dominated by frequent localized spalls and mixed mode behavior. Only one example of cyclic-load crushing was seen in this test series at this rate and very little ductile behavior was observed. Isolated crushing events were observed in this range, but not to the same extent as is observed in medium rate tests.
5. Conclusion
A series of laboratory-scale indentation tests have been studied to gain insights into the failure processes associated with the behavior of
a single hpz during an ice-structure interaction. An instrumentation package comprised of an inline load cell, a tactile pressure sensor and a synchronized high-speed video camera has been used to obtain detailed information about the local pressure distributions and associated physical processes that occur during ice failure events.
The experiments described show the local failure behavior of ice to be quite rate dependent. At low rates, ductile behavior (including distributed damage) dominates. Crushing becomes dominant in the medium rate tests, while spalling becomes more prevalent at the fastest rates. In the medium and fast rate tests, the situation is complicated by the fact that it is often difficult to separate the crushing events from the spalling events, particularly in the fast rate tests. Overlap exists between the failure modes in these cases, which is represented by the mixed mode failure behavior. In full-scale interactions, compressive ice failure involves a complex interplay Fig. 12. Another example of a crushing event observed during a test with an indenter speed of 2 mm/s. (a–d) Pressure distribution recorded during the crushing event. The red outlines in (a–d) represent equal areas resulting from drawing a circle around the contact area in (c). (e) Load cycling observed in the synchronized load trace during the event. (f) Frame taken from a high-speed video recording of the event.
between localized spalling and crushing. While localized spalls play a role in the compressive failure of ice, it is important to recognize that damage is also an important part of the process.
Failure behavior has been classified into five categories: ductile behavior, isolated crushing events, cyclic-load crushing events, localized spalling and mixed mode behavior. While it was challenging to differentiate between small fractures and damage processes for some events, many clear examples of distinct spalling and crushing events were identified. Physical observations and pressure distribu-tions measured during the experiments clearly support the distinction of fracture and damage as two different types of processes.
Localized peaks in pressure that were much higher than the average pressure, were seen to grow and decay during an interaction. This behavior is similar to the peaks in pressure that occur during full-scale interactions. In some cases, these peaks in pressure preceded the formation of a localized spall from the area around the indenter. Immediately after the spall, there was a drop in pressure owing to the corresponding load drop and a reduction in contact area.
In other instances, the locations of the pressure peaks remained constant as crushed ice was extruded in a repeated manner from the area surrounding the contact zone. Drops in pressure that did not correspond to a reduction in contact area were also observed. These were found to correspond to isolated crushing events that repre-sented a single extrusion of crushed ice from the center of the hpz.
An understanding of the underlying principles behind the localized failure of ice is necessary in order to understand the role that these processes play in the scale effect. The pressure-area scale effect has important engineering implications for the design of ships and structures for ice environments. Improving our understanding of local failure processes is critical to advancing our knowledge of the scale-effect and developing methods to estimate ice loads for design. In general, failure processes observed were found to be remarkably consistent with theoretical descriptions and models based on damage mechanics; see for instanceXiao, 1997; Li, 2007.
Acknowledgements
The authors would like to acknowledge Mr. Austin Bugden for his assistance during the testing phase of this project as well as the NRC-IOT for use of their cold room facilities. We would like to thank Dr. Chuanke Li for many useful discussions during the analysis of the results. We also thank Dr. Paul Barrette for the valuable comments and suggestions resulting from his review of this manuscript. Financial contributions by NSERC, PRAC and the Link Foundation are gratefully acknowledged.
References
Barrette, P., Pond, J., Jordaan, I., 2002. Ice damage and layer formation: in small-scale indentation experiments. Ice in the Environment, Proceedings 16th International Symposium on Ice, IAHR, Dunedin, New Zealand, pp. 246–253.
Barrette, P., Pond, J., Li, C., Jordaan, I., 2003. Laboratory-scale indentation of Ice. PERD/ CHC report 4-81.
Croasdale, K.R., 1975. Ice forces on marine structures. Proceedings 3rd Symposium on Ice, IAHR. Hanover, NH, pp. 317–337.
Croasdale, K.R., Morgenstern, N.R., Nuttal, J.B., 1977. Indentation tests to investigate ice pressures on vertical piers. Journal of Glaciology 19 (81), 301–312.
Crocker, G.B., Croasdale, K.R., McKenna, R.F., English, G.M., Guzzwell, J., Bruneau, S.J., 1997. C-CORE iceberg impact experiment-phase 2, final report. C-CORE, Memorial University of Newfoundland, Newfoundland.
Daley, C.G., 1992. Ice edge contact and failure. Cold Regions Science and Technology 21, 1–23.
Fransson, L., Olofsson, T., Sandkvist, J., 1991. Observations of the failure process in ice blocks crushed by a flat indenter. Proceedings of 11th International Conference on Port and Ocean Engineering under Arctic Conditions, St. John's, Canada 1, 510–514. Frederking, R., Jordaan, I., McCallum, J., 1990. Field tests of ice indentation tests at medium scale, Hobson's Choice Ice Island. Proceedings 10th International Symposium on Ice, IAHR, Espoo, Finland, pp. 931–944.
Gagnon, R.E., 1999. Consistent observations of ice crushing in laboratory tests and field experiments covering three orders of magnitude in scale. Final Proceedings of 15th International Conference on Port and Ocean Engineering Under Arctic Conditions, POAC 1999. Helsinki, Finland, pp. 858–869.
Joensuu, A., Riska, K., 1989. Contact between ice and structure (in Finnish). Laboratory of Naval Architecture and Marine Engineering. Helsinki University of Technology, Espoo, Finland. Report M-88.
Jordaan, I.J., 2001. Mechanics of ice-structure interaction. Engineering Fracture Mechanics 68, 1923–1960.
Jordaan, I.J., Timco, G.W., 1988. The dynamics of the ice crushing process. Journal of Glaciology 34 (118), 318–326.
Jordaan, I.J., Xiao, J., 1992. Interplay between damage and fracture in ice-structure interaction. Proceedings 11th International Symposium on Ice, IAHR, Banff, Alberta, pp. 1448–1467.
Jordaan, I., Li, C., Mackey, T., Nobahar, A., 2005. Design ice pressure-area relationships: Molikpag data. Technical Report prepared for the National Research Council of Canada, PERD/CHC 14-121.
Fig. 13. Representative examples of time traces for total MTS load cell force for slow, medium and fast rate tests: (a) 0.2 mm/s, (b) 2.0 mm/s, and (c) 10.0 mm/s.
Jordaan, I.J., Taylor, R., Reid, S., 2007a. Fracture, probabilistic averaging and the scale effect in ice-structure interaction. Proceedings Conference on Port and Ocean Engineering Under Arctic Conditions, POAC 2007. Dalian, China, pp. 296–304. Jordaan, I.J., Li, C., Mackey, T., Stuckey, P., Sudom, D., Taylor, R., 2007b. Ice data analysis and
mechanics for design load estimation, final report. Prepared for NSERC, C-CORE, Chevron Canada Resources, National Research Council of Canada, Petro-Canada, Husky Energy.
Jordaan, I.J., Taylor, R.S., Wells, J., 2009. Ice crushing, damaged layers and pressure-area relationships. Proceedings Conference on Port and Ocean Engineering Under Arctic Conditions, POAC 2009. Lulea, Sweden.
Kheisin, D.E., Cherepanov, N.V., 1973. Change of ice structure in the zone of impact of a solid body against the ice cover surface. In: Treshnikov, A.F. (Ed.), Problems of the Arctic and Antarctic, 1970, Issues 33-35. Israel Program for Scientific Translation, pp. 239–245.
Kurdyumov, V.A., Kheisin, D.E., 1979. Hydrodynamic model of the impact of a solid on ice. Prikladnaya Mekhanika. 1976; 12(10):103-9 [Transl.].
Li, C., 2007. Probability and fracture mechanics applied to ice load estimation and associated mechanics. Ph.D. Thesis. Memorial University, St. John's, NL, Canada. Li, C., Barrette, P., Jordaan, I., 2004. High-pressure zones at different scales during
ice-structure indentation. Proceedings 23rd International Conference on Offshore Mechanics and Arctic Engineering, OMAE 2004, Vancouver, British Columbia. Mackey, T., Wells, J., Jordaan, I., Derradji-Aouat, A., 2007. Experiments on the fracture of
polycrystalline ice. Proceedings Conference on Port and Ocean Engineering Under Arctic Conditions, POAC 2007. Dalian, China, pp. 339–349.
Masterson, D.M., Spencer, P.A., Nevel, D.E., Nordgren, R.P., 1999. Velocity effects from multiyear ice tests. Proceedings 18th International Conference on Offshore Mechanics and Arctic Engineering, OMAE 1999. S. John's, Canada, 1999. Meglis, I., Melanson, P. and Jordaan, I.J., 1999. Microstructural change in ice: II. Creep
behavior under triaxial stress conditions. Journal of Glaciology, 45(151): 438–448 Colour Plates 423–437.
Melanson, P.M., Meglis, I.L., Jordaan, I.J., Stone, B.M., 1999. Microstructural change in ice: I. Constant-deformation-rate tests under triaxial stress conditions. Journal of Glaciology 45 (151), 417–424.
Muggeridge, K., Jordaan, I., 1999. Microstructural change in ice: III. Observations from an iceberg impact zone. Journal of Glaciology 45 (151), 449–455.
Nordell, B., 1990. Measurement of a P-T coexistence curve for ice-water mixture. Cold Regions Science and Technology 19, 83–88.
Ralph, F., McKenna, R., Crocker, G., Croasdale, K., 2004. Pressure-area measurements from the Grappling Island iceberg impacts. Proceedings 17th International Symposium on Ice, IAHR, St. Petersburg, Russia, pp. 171–178.
Sinha, N.K., Cai, B., 1992. Analysis of Ice from medium-scale indentation tests. NRC Laboratory Memorandum IME-CRE-LM-002. 63 pp.
Taylor, R.S., 2010. Analysis of scale effect in compressive ice failure and implications for design. Ph.D. Thesis, Memorial University, St. John's, NL, Canada.
Tuhkuri, J., 1993. Laboratory tests of ship structures under ice loading, Vol. 1. Helsinki University of Technology Ship Laboratory, p. 171. Report M-166. Otaniemi. Xiao, J., 1997. Damage and fracture of brittle viscoelastic solids with application to ice