https://doi.org/10.4224/40001833
Vous avez des questions? Nous pouvons vous aider. Pour communiquer directement avec un auteur, consultez la première page de la revue dans laquelle son article a été publié afin de trouver ses coordonnées. Si vous n’arrivez pas à les repérer, communiquez avec nous à PublicationsArchive-ArchivesPublications@nrc-cnrc.gc.ca. Questions? Contact the NRC Publications Archive team at
PublicationsArchive-ArchivesPublications@nrc-cnrc.gc.ca. If you wish to email the authors directly, please see the first page of the publication for their contact information.
https://publications-cnrc.canada.ca/fra/droits
L’accès à ce site Web et l’utilisation de son contenu sont assujettis aux conditions présentées dans le site
LISEZ CES CONDITIONS ATTENTIVEMENT AVANT D’UTILISER CE SITE WEB.
READ THESE TERMS AND CONDITIONS CAREFULLY BEFORE USING THIS WEBSITE. https://nrc-publications.canada.ca/eng/copyright
NRC Publications Archive Record / Notice des Archives des publications du CNRC :
https://nrc-publications.canada.ca/eng/view/object/?id=5c38ed85-541c-4b7b-8b41-a97f544ce637 https://publications-cnrc.canada.ca/fra/voir/objet/?id=5c38ed85-541c-4b7b-8b41-a97f544ce637
NRC Publications Archive
Archives des publications du CNRC
For the publisher’s version, please access the DOI link below./ Pour consulter la version de l’éditeur, utilisez le lien DOI ci-dessous.
Access and use of this website and the material on it are subject to the Terms and Conditions set forth at
Canadian Energy Storage Report: 2019 Case Study for the Ontario
Market
Shi, Steven; Yang, Jianjun; Gonzales-Calienes, Giovanna; Baker, Ryan;
Malek, Kourosh; Skrivan, Will
Canadian Energy Storage Report:
2019 Case Study for the Ontario Market
Prepared by:Steven Shi, Jianjun Yang, Giovanna Gonzales-Calienes, Ryan Baker, Kourosh Malek, Will Skrivan
Document #: NRC-EME-56170 Date: October 6, 2020
© 2020 National Research Council of Canada, All rights reserved. No part of its contents may be used, copied, disclosed or conveyed to any party in any manner, in whole or in part, whatsoever without prior written permission from NRC. Elements of this document, or information used in the analysis contained in this report, were provided by collaborators who are part of the contributing partners committee. Their contributions to this report are greatly appreciated and include data or content from Acelerex.
Review of this document was provided by the advisory board. Their contributions are greatly appreciated. IESO provided publically available data. Ontario Ministry of Energy, Northern Development and Mines provided insights regarding the LTEP and publically available data from IESO and OEB.
Note that this report reflects the beliefs and opinions of the NRC authors based on best available information at the time of writing. This report does not necessarily represent the views of the advisory board members, their affiliated organization, or any other stakeholder groups.
ii
Preface
Since the time the analyses described in this Ontario Chapter study were performed, several changes to energy policy and environmental regulations in Ontario have been implemented. The specific
policies/regulations and their anticipated impacts on the inputs and results of these analyses are listed in the table below.
Table 1. Policy Changes and their Impacts on this Study since the Time of the Analysis
Policy Key Change Since Time of This Analysis
Estimated Impacts of Change to Analysis Results
Global Adjustment The Industrial
Conservative Initiative (ICI) under which registered Class-A customers will pay Global Adjustment in a specified way might be replaced in the future since Ontario government has decided to cancel many Electricity Conservation Programs.
Due to the uncertainty related to the ICI, the change in the Global Adjustment payment method by registered Class-A customers is not yet clear. According to the existing policy, savings on the Global Adjustment payment for a Class-A customer is a significant portion of the installed ES system’s benefit. The worst-case scenario of the impact of the policy change would be assumed to be the entire removal of the ICI that is equivalent to the case without inclusion of the Global Adjustment savings. The cases with and without the ICI are represented by Use Cases #2 and #1, respectively. Other scenarios for the replacement of the ICI would have to be studied separately in the future.
Release of Annual Planning Outlook 2020
The 2020 APO has a lower demand growth forecast compared to 2017 LTEP report data. “Installed Capacity” values have also been updated by generation type as well as by the nuclear generation facility refurbishment schedule.
The changes in demand forecasts are lower but the differences are minor and do not impact the overall results of the study. Also, this uncertainty in
demand forecasts is covered with the high sensitivity case. Effects of additional installed capacity requirements are also analyzed in the high-case scenario in this study. The changes in the nuclear refurbishment dates are minor and will not impact the study outputs.
It should be noted that the Ontario Energy Board (OEB) is taking steps to enable distributed energy resources (DERs), and the IESO is working to enable energy storage in Ontario's market, both of which are positive steps for the future business case for storage.
The following figure and tables demonstrate the differences between the IESO 2017 Long-term Energy Plan and 2020 Annual Planning Outlook datasets. A comparative analysis was done to ensure the analysis in this report aligns with stakeholder vision for the future Ontario grid.
iii
Figure 1. Demand forecast comparison of 2020 APO and 2017 LTEP
iv
v
Executive Summary
Canada is in the enviable position of being relatively rich in natural resources and having one of the cleanest, least expensive and most reliable electricity grids in the world. However, a decrease in infrastructure
investments in the 1990’s along with an increase in the integration of renewables, a rise in smart grid
technologies, and changes in demand and policies at a national and provincial level have created an increased awareness that fundamental changes in the way we build, own and operate our electricity systems may be required. Many studies, organizations and experts worldwide have concluded that these changes provide a perfect opportunity for energy storage (ES) technologies to demonstrate their value in supporting energy security and climate change goals, as well as creating a more integrated and optimized energy system. However, few comprehensive studies exist at a national or provincial level that comprehensively address the market potential and costs and benefits, as well as economic and environmental impacts of significant ES utilization given the complexities of the analysis and the marketplace.
Understanding the potential value of ES may help provide cost effective solutions for secure and reliable electric grids, and may also provide opportunities as an economic engine to drive the global competitiveness of
Canadian energy products and home-grown expertise. However, most studies undertaken to date have reviewed ES on a project-by-project basis, which makes it difficult to ascertain the full value and costs of implementing the technology. It is within this context that the NRC, through its Energy Storage for Grid Security and Modernization Program, has undertaken the development of a Canadian Energy Storage Study, with support and input from NRCan’s Office of Energy Research and Development (OERD), strategic partners and consultants, stakeholders across the value chain, and an expert advisory board. This study, comprised of three pillars of analysis, is intended to provide a neutral and independent analysis jurisdiction by jurisdiction across Canada that outlines the potential costs and benefits of the adoption of ES technologies.
This version of the study contains the framework for the entire study as well as the detailed analysis for Ontario. It is expected that the framework and the Ontario chapter will be updated in the future to take into account further refinements based on stakeholder feedback as other jurisdictions proceed, as well as reflect any specific regulatory or technical changes that occur over the duration of the project. Other provinces will be completed independently, due to the varied nature of the markets, generation and supply mix, and providers/technologies used in each market. However, the overall framework will be consistent, and will leverage learning across Canadian jurisdictions and from other early ES markets.
Pillar 1 - Grid Needs and ES
Market Opportunity
•Identify ES use cases •Define specific applicationrequirements
•Identify the impacts on grid power planning and
operations
•Review the current market structure
Pillar 2 - Technology
Assessment and Valuation
•Assess ES Technologies andtrends
•Match technology and application requirements •Propose valuation and
performance frameworks •Evaluate individual ES
profitability and dispatch on the electricity grid.
Pillar 3 - Environmental and
Socio Economic Assessment
•Assess environmental andsocio-economic metrics •Assess GHG emissions at the
grid level
•Compare life cycle GHG emissions of ES technologies
vi
Pillar 1 - Grid Needs and ES Market Opportunity
The Pillar 1 analysis involved quantifying the indicative size, location, and timing of ES systems deployment that would maximize the benefits to the electricity ratepayers in the province of Ontario through a technology-agnostic approach with transparent assumptions on the business-as-usual status of the Ontario bulk electric system. Various scenarios were modelled and sensitivities were built up from the Independent Electric System Operator’s (IESO) Annual Planning Outlook with ES systems expansion. With these results, locations for potential ES systems’ deployments throughout Ontario were found using best practice power system operational analyses to minimize capital and operational costs across generation, transmission, distribution and demand. Along with ES systems’ locations, the analysis determined optimum ratios of power and energy for potential ES systems’ sizes in MW/MWh. These potential ES systems’ deployments would achieve maximum benefits to consumers (all electricity grid users) as well as the optimum ES systems’ deployment timings of the modelled scenarios.
The methodology involved a multi-phased approach in which sizing and location analysis were examined with respect to various policy futures and uncertainties in the Ontario grid. The first phase involved an economic cost benefit analysis for individual cases. The second phase examined three cases from the first phase which resulted in: a) the highest amount of ES built, b) the least amount of ES built, and c) a base case model representing the median build for all case results. Study results for sizing and location are presented below for each case examined.
Load growth cases examined the impact of high growth and low growth forecasts on ES builds. The high load growth scenario used the IESO 2020 Annual Planning Outlook data and the low load growth scenario used the IESO 2017 LTEP Outlook A for demand and energy forecast per year. Results from the load growth model show that ES builds scale with demand and energy growth as indicated by the 1,108 MW increase in ES built in the high load growth scenario and 1,412 MW decrease in the low load growth scenario.
Fuel price cases examined the fluctuation in fuel prices of Natural Gas, Oil, Biomass, and Landfill Gas (LFG). The high scenario assumed a 140% multiplier and the low scenario assumed a 60% multiplier on fuel prices. Results from the fuel price model show that ES builds were similar to the base case for the high scenario and decreased to 1,095 MW in the low scenario.
Technology cost cases examined the uncertainty of ES build costs using high and low scenarios. The high scenario assumed a 140% multiplier and the low scenario assumed a 60% multiplier for ES build costs compiled
Key Findings in Pillar 1
• The analysis identified the economic benefits of adding ES systems into the Ontario
footprint for a base-case scenario, a low-case scenario, and a high-case scenario, each analyzed against a “business-as-usual” scenario in which ES was not built into the Ontario footprint:
o Low Case - 745 MW built resulting in $50 million of gross lifetime benefits to the grid
o Base Case – 2,636 MW built resulting in $200 million of gross lifetime benefits
o High Case – 5,743 MW built resulting in $900 million of gross lifetime benefits. • The sensitivity analysis identified that ES
technology cost has the most significant impact on the amount of ES built.
• Results showed that ES systems can increase the overall benefits of the Ontario system by improving efficiency, providing resiliency and reliability, and increasing system flexibility. Value stacking through participation in a combination of wholesale market services and distribution services (DS) (which are evaluated even though Ontario does not have a DS market) is critical for maximizing system benefits and economic benefits.
vii
from mixed industry benchmarking data. Results from the technology cost model show that ES builds inversely scale with technology costs as indicated by the 1,892 MW reduction in ES built in the high technology cost scenario and 3,106 MW increase in low technology cost scenario.
The Carbon Tax case examined the fluctuation of the carbon tax on CO2 emissions. The high scenario assumed a 125% multiplier and the low scenario assumed a 75% multiplier for the carbon tax rate. Results from the carbon tax model show that ES builds were similar to the base case for the high scenario and decreased to 1,041 MW in the low scenario.
The economic benefits of ES were analyzed as the combined value of the storage capacity value, ancillary services value, energy arbitrage value, and the difference in fixed operation and maintenance costs (FOM) and generation cost between the “business-as-usual” case and storage case. The present value of benefits was determined by summing all benefits from 2020 through 2039 and applying a 7% discount factor. Net Present Value (NPV) is the difference between total present value benefits and total present value costs. The cost and benefits for each case are summarized in Table 4 below.
Table 4. Total Cost, and Net Present Value for the Low, Base, and High Cases Case Total Benefit PV
('$MM') Total Cost PV ('$MM') NPV ('$MM') Low Case 771 642 46 Base Case 2,859 2,460 200 High Case 6,096 4,074 903
Pillar 2 – Technology Assessment and Valuation
The Energy Storage (ES) valuation analysis performed in Pillar 2 evaluated the economic benefits that were available for classes of ES technologies and individual project-level examples operating on the Ontario electric system, as well as the potential for each individual ES project to be dispatched to meet grid needs. This was accomplished using an evaluation framework that included a two-stage, top-down funnel approach. The first stage used Ontario-specific grid data, technology data from a survey completed by the NRC, and
assumptions from Pillar 1. The second stage used actual hourly, public price and load data in addition to
assumptions from Pillar 1 to perform a more detailed dispatch and profitability analysis. This approach, from general to specific, provided a more granular snapshot of ES potential at a technology-specific and individual project level.
In the first stage, 19 ES technology classes were simulated at the generation and transmission levels, using pricing for each market and service from a survey of Ontario electric system stakeholders as well as
Ontario-Key Findings in Pillar 2
• A two-step ES valuation analysis was used for general ES classes as well as specific ES projects. The top ES classes in terms of potential profit were CAES-c, NaS, and Li-ion, out of 19 ES technology classes simulated. • A 15-year 10MW 2Hr Li-ion battery was
simulated for three use cases according to IESO rules and regulations using actual data, resulting in benefit-to-cost ratios of 0.6 to 0.98.
• The benefit-to-cost results are likely a lower bound due to current market participation restrictions, existing market products, and a lack of publicly available data.
viii
specific financial ownership structures. Use cases relied on load following (not presently part of IESO’s markets or services) as the top or anchor service to maximize potential profitability or potential net present value (NPV). The top three ES technology classes were compressed air energy storage in salt caverns (CAES-c), sodium sulfur battery ES (NaS) and lithium-ion battery energy storage (Li-ion).
In the second stage, a more granular analysis focused on simulating a specific example of a 15-year 10MW 2Hr Li-ion battery ES as a single IPP-owned system in three Ontario-specific use cases. The three use cases were: a) real-time energy and operating reserves, b) global adjustment (GA) Class-A in addition to real-time energy and operating reserves, and c) demand reduction / capacity auction in addition to real-time energy and operating reserves. Whereas the first stage of the valuation analysis included all potential services from the survey at the generation and transmission levels, the second stage only included those in which ES is allowed to participate according to IESO market rules and regulations and using actual historical IESO data. An intensive time series dispatch simulation with an hourly resolution was performed for an individual Li-ion ES project to model operation over its lifetime along with bidding results into the Ontario markets according to a generic North American ISO dispatch order or hierarchy.
Combining both ES valuation stages, CAES-c, NaS and Li-ion ES technology classes show the potential for benefit-to-cost ratios (applicable to the ES owner) greater than 1. The hypothetical use case with GA, Class-A, and with real-time energy and operating reserves, showed a benefit-to-cost ratio of 0.98. A more detailed analysis of a single 10MW 2Hr Li-ion battery participating in actual IESO markets and services in three specific use cases showed benefit-to-cost ratios of between 0.6 and 1. With potential IESO policy changes on GA payment methods for Class-A customers, the benefit of ES from providing GA payment savings could be altered or even completely removed, resulting in the same profit values as for the studied case in which only real-time energy and operating reserves are served.
It is noted that these benefit-to-cost ratios are likely a lower bound. Currently ES benefits or revenue streams in Ontario are constrained, which decreases benefit-to-cost ratios. ES is presently not allowed to participate in all IESO markets and services (IESO's ESAG 2020); in particular, benefits from regulation service and frequency regulation could increase benefit-to-cost ratios. If a new IESO market for load following or ramping is needed and ES is allowed to participate, then ES profitability or benefit-to-cost ratio would increase further. Finally, some Ontario data sets were unavailable at the time of this report so a use case with regulation service could not be simulated.
Pillar 3 - Environmental and Socio-Economic Assessment
Many industry reports predict ES costs to decrease significantly over the next five years, driven by scale and related cost savings, improved standardization and technological improvements, and supported in turn by increased demand. This rise in demand would be a result of regulatory / pricing innovation, high renewables penetration, interests in system operators to seek non-wires solutions, and the needs of an aging and changing power grid in the context of a modern society.
In this study, the socio-economic impact for ES deployment was evaluated through the number of jobs created and GDP added by ES deployment in Ontario during ES projects’ stages. The results of the analysis showed that most economic impacts are projected to be generated during the construction and operation phases in a similar way to renewable energy projects. By 2030, the total direct impact GDP added to Ontario’s economy is
ix
estimated to be $768M and the number of jobs created due to the construction and operation stages is 5,781. However, the economic impact is likely to be lower than the economic impact in, for example, solar PV projects, as ES systems are usually modular and imported with lower construction-phase costs.
Energy storage deployment in the Ontario electricity system could significantly reduce the projected GHG emissions of the Ontario electricity grid from 2020 to 2030. Storage operation could reduce grid-level CO2-eq
emissions by 11% by 2030 with a grid-level GHG emissions reduction of 4.5 MtCO2-eq.
The comparative life cycle GHG impact between Li-ion battery systems and VRFB systems indicates that VRFB systems are more environmentally friendly than Li-ion battery systems, and VRFBs generate approximately 76% less life cycle GHG emissions than Li-ion battery systems. The life cycle GHG emissions of Li-ion battery ES and VRFB systems are mostly due to the emissions during manufacturing (cradle-to-gate stage) of their ES systems components.
The contribution of the operations stage to the overall life cycle impact depends upon hourly grid marginal emissions factors that reflect the changes to the power-grid mix and the round-trip efficiency. VRFB systems were projected to displace less emissions per MWhdispatched during the operations phase, originating from the
time-of-day marginal emissions factors when dispatched, exacerbated by low system round-trip efficiency. However, varying operation patterns for ES could achieve higher carbon reductions.
Further study is recommended to perform a comparative analysis of life cycle GHG impacts of ES systems for different stationary grid applications, as the cradle-to-gate and operation phase GHG impacts would be affected by lifetime utilization of a specific application.
Résumé
Le Canada occupe une situation enviable : pays relativement riche en ressources naturelles, son réseau d’électricité est l’un des moins polluants, des moins onéreux et des plus fiables de la planète. Toutefois, la diminution des investissements dans les infrastructures dans les années 1990, l’intégration accrue des énergies renouvelables, l’essor des technologies de réseaux intelligents, ainsi que l’évolution de la demande et des politiques nationales et provinciales, nous ont fait reconnaître la nécessité d’apporter des changements fondamentaux à la manière dont nous bâtissons, possédons et exploitons nos réseaux d’électricité. De plus, un grand nombre d’études, d’organisations et d’experts dans le monde ont conclu que de tels changements constituent une occasion rêvée de montrer que les technologies de stockage de l’énergie (SE) ont leur utilité dans la réalisation des objectifs associés à la sécurité énergétique et aux changements climatiques, et que le SE pourrait conduire à un réseau énergétique mieux intégré et optimisé. Malgré cela, peu d’études ont examiné de manière exhaustive les possibilités commerciales, la rentabilité ainsi que les retombées économiques et
Key Findings in Pillar 3
• Energy storage deployment is estimated to increase Ontario’s GDP by $768M and add 5,781 jobs.
• ES deployment would provide the incremental environmental benefit of reducing GHG emissions from the Ontario electricity system by 11% by 2030 (a reduction of 4.5 MtCO2-eq).
• The life cycle GHG impacts of Li-ion battery ES and VRFB systems are mostly due to the emissions during manufacturing (cradle-to-gate stage) of their ES system components. • The life cycle GHG emissions of Li-ion battery
ES and VRFB systems indicate that the overall contribution of the use stage to the overall life cycle impact depends upon the time-of-day grid marginal emissions factors when they are dispatched and the round-trip efficiency.
x
environnementales du SE aux paliers national et provincial, en raison des complexités d’une telle analyse et de la nature du marché.
Une meilleure compréhension de la valeur potentielle des énergies renouvelables peut contribuer à fournir des solutions rentables pour des réseaux électriques sûrs et fiables, et peut également offrir des possibilités en tant que moteur économique pour stimuler la compétitivité mondiale des produits énergétiques canadiens et l’expertise nationale. Cependant, la plupart des études réalisées jusqu’à présent n’ont examiné le stockage d’énergie qu’un projet à la fois, ce qui complique l’évaluation de la valeur générale de la technologie et du coût de sa mise en œuvre. C’est dans ce contexte que le CNRC, par l’entremise de son programme « Stockage d’énergie pour la modernisation et la sécurisation des réseaux », a entrepris une étude canadienne sur le stockage d’énergie. Pour la réaliser, le CNRC peut compter sur l’appui et la contribution du Bureau de recherche et de développement énergétiques (BRDE) de RNCan, de partenaires stratégiques et d’experts-conseils,
d’intervenants de toute la chaîne de valeur et d’une commission consultative d’experts. Cette étude, composée de trois axes d’analyse, vise à fournir une analyse neutre et indépendante, province par province, d’un bout à l’autre du pays, qui souligne les coûts et les avantages potentiels de l’adoption des technologies de SE.
Ce document présente le cadre général de l’étude mentionnée plus haut et les résultats de l’analyse détaillée de la situation en Ontario. Le cadre de l’étude et l’analyse de l’Ontario seront sans doute actualisés par la suite, en fonction des perfectionnements suggérés par les intervenants, à mesure que l’on s’attaque aux autres régions, ou des amendements apportés à la réglementation, voire des changements techniques qui surviendront tout au long du projet. Face à la variété des marchés, de la composition du mélange énergétique (production et
approvisionnement), et des fournisseurs/technologies propres à chaque marché, on analysera la situation dans les autres provinces séparément. Cependant, l’exercice gardera le même cadre et on tirera parti de ce qu’on a appris dans les différentes régions du pays ainsi que sur d’autres marchés où l’on a rapidement adopté le SE.
1er axe – Besoins du réseau et possibilités du SE sur le marché
Le premier axe d’analyse supposait une quantification de l’envergure des systèmes de SE, de leur emplacement et du moment de leur déploiement qui s’avéreraient les plus profitables pour ceux qui achètent de l’électricité en Ontario. On a recouru pour cela à une approche technologiquement agnostique qui s’appuie sur des
hypothèses transparentes concernant le statu quo sur le marché de l’électricité ontarien. Plusieurs scénarios ont été modélisés et l’on a pris en compte diverses particularités concernant l’expansion du SE en Ontario, tirées de l’Annual Planning Outlook (perspectives annuelles d’aménagement) de la Société indépendante d’exploitation du réseau d’électricité (SIERE). De là, on a déterminé les endroits où les systèmes de SE pourraient être déployés en Ontario, après analyse des pratiques exemplaires en matière d’exploitation du réseau de façon à minimiser
1eraxe – Besoins du réseau et
possibilités du SE sur le marché
•Déterminer les cas d'utilisation du SE •Établir les exigences spécifiques de
l'application
•Préciser les répercussions du SE sur l'aménagement et l'exploitation du réseau •Passer en revue la structure actuelle du
marché
2eaxe – Évaluation de la
technologie
•Évaluer les technologies de SE et les tendances qui s'y associent
•Apparier la technologie aux contraintes de l'application
•Proposer un cadre pour l'évaluation et le rendement
•Évaluer la rentabilité de chaque technologie de SE et lui trouver une place dans sur le réseau
3eaxe – Évaluation
environnementale et socioéconomique
•Chiffrer les retombées environnemtales et socioéconomiques du SE
•Évaluer les émissions de GES à la grandeur du réseau
•Comparer le volume de GES émis par les technologies de SE durant leur cycle de vie
xi
les coûts d’immobilisation et de fonctionnement au niveau de la production, du transport, de la distribution et de la demande. Parallèlement à l’emplacement des systèmes de SE, l’analyse a permis d’établir le rapport optimal entre la puissance des systèmes de SE éventuels et la quantité d’énergie stockée en MW/MWh. Un tel déploiement des systèmes de SE potentiels aboutirait aux plus grands avantages pour le consommateur (tous les abonnés au réseau confondus) et surviendrait au meilleur moment, selon les scénarios modélisés.
La méthode employée comprenait une approche en plusieurs phases en vertu de laquelle on a analysé l’importance et l’emplacement des systèmes de SE selon diverses possibilités sur le plan des politiques publiques et des incertitudes concernant le réseau d’électricité ontarien. Dans un premier temps, on a procédé à une analyse de rentabilité des différents cas. Ensuite, trois cas de la phase précédente ont fait l’objet d’une analyse plus poussée : a) celui où l’on érigeait le plus grand nombre d’installations de SE, b) celui où on en construisait le moins et c) le modèle de base
correspondant à la médiane des résultats de la première phase.
Les résultats de l’analyse sur l’envergure et l’emplacement des systèmes de SE pour ces trois scénarios apparaissent ci-dessous.
L’analyse de la croissance de la charge examinait l’impact d’une forte et d’une faible croissance sur le nombre de systèmes de SE aménagés. Le scénario supposant une forte croissance de la charge s’appuyait sur les données de l’Annual Planning Outlook de 2020 de la SIERE, tandis que celui présumant une faible croissance reposait sur le document LTEP Outlook de 2017 de l’organisme, qui prévoit la demande et la production annuelles d’énergie. L’analyse qui repose sur la croissance de la charge indique que le nombre
d’installations de SE aménagées augmente avec la demande et la production d’électricité, comme l’indique la hausse de 1 108 MW de la capacité des systèmes de SE obtenue avec le scénario de forte croissance et la baisse de 1 412 MW découlant du scénario de faible croissance de la charge.
L’analyse du prix des combustibles portait sur la fluctuation du prix du gaz naturel, du pétrole, de la biomasse et du méthane capté dans les décharges. Le scénario élevé supposait un effet multiplicateur de 140 %
Principales constatations du 1eraxe d’analyse • L’analyse a établi les avantages économiques
de l’addition de systèmes de SE à l’empreinte du réseau ontarien pour trois scénarios (intégration de base, faible intégration et intégration élevée des systèmes). Dans chaque cas, les résultats ont été comparés au scénario du statu quo, c’est-à-dire un scénario selon lequel le stockage d’énergie ne
trouverait pas sa place dans le réseau ontarien.
o Faible intégration – 745 MW d’ajoutés avec des retombées brutes de
50 millions de dollars pour la vie utile de la technologie
o Intégration de base – 2 636 MW d’ajoutés avec des retombées brutes de 200 millions de dollars pour la vie utile de la technologie
o Intégration élevée – 5 743 MW d’ajoutés avec des retombées brutes de 900 millions de dollars pour la vie utile de la technologie.
• Selon l’analyse de sensibilité, c’est le coût de la technologie de SE qui exerce le plus d’impact sur le nombre de systèmes mis en place.
• Les résultats indiquent que les systèmes de stockage d’énergie peuvent avoir des avantages globaux plus importants pour le réseau ontarien en améliorant son efficacité, en le rendant plus résilient et fiable, et lui donnant plus de souplesse. Afin de maximiser leurs avantages pour le réseau et leurs retombées économiques, il est capital qu’il y ait empilement de valeurs par la participation à un mélange de services de vente en gros et de distribution (ce que l’on a évalué, bien que l’Ontario n’ait aucun marché de distribution de l’électricité).
xii
et le scénario faible, un effet multiplicateur de 60 %. Les résultats du modèle indiquent qu’on bâtirait autant d’installations de SE dans le scénario de base que le scénario élevé, mais que la capacité de stockage baisserait à 1 095 MW dans le scénario de faible intégration.
L’analyse du coût technologique portait sur l’incertitude liée au coût de construction des installations de SE pour le scénario élevé et le scénario faible. Dans le premier cas, on a supposé un effet multiplicateur de 140 % et dans le second, un effet multiplicateur de 60 %, établis à partir de diverses données comparatives de l’industrie. Selon les résultats du modèle, le nombre de systèmes de stockage d’énergie aménagés varierait inversement avec le coût de la technologie, comme le révèle la plus faible capacité de stockage de 1 892 MW qui a été obtenue avec l’hypothèse d’un coût élevé de la technologie et la capacité de stockage de 3 106 MW résultant d’une
technologie peu coûteuse.
L’analyse de la taxe carbone portait sur la fluctuation de ladite taxe en fonction des émissions de CO2. Dans le
scénario élevé, on présumait un effet multiplicateur de 125 % et, dans le scénario faible, un effet multiplicateur de 75 %. Les résultats indiquent que le nombre d’installations de SE érigées est le même pour le scénario de base et le scénario à intégration élevée, mais que la capacité de stockage diminue à 1 041 MW pour le scénario à faible intégration.
Les retombées économiques du SE ont été analysées d’après la valeur combinée de la capacité de stockage, des services auxiliaires, de l’arbitrage de l’énergie ainsi que l’écart entre les coûts d’exploitation et de maintenance fixes, et le coût de production quand il y a statu quo ou stockage de l’énergie. On a établi la valeur actualisée des retombées par totalisation des retombées de 2020 à 2039, suivi de l’application d’un facteur d’actualisation de 7 %. La valeur nette actualisée (VNA) correspond à la différence entre la valeur totale actualisée des retombées et les coûts totaux actualisés. Le tableau 4 résume le coût et les retombées de chaque cas.
Table 4. Coût total et valeur nette actualisée des trois scénarios
Scénario VA retombées (en M$) VA coût (en M$) VNA (en M$) Faible 771 642 46 Base 2 859 2 460 200 Élevé 6 096 4 074 903
xiii
2e axe – Évaluation de la technologie
L’évaluation du stockage de l’énergie (SE) réalisée dans le cadre du deuxième axe portait sur les retombées économiques liées à divers types de technologies de SE avec, pour illustration, quelques projets en cours sur le réseau d’électricité ontarien. L’analyse a aussi examiné la possibilité d’adapter chaque projet de SE en fonction des besoins du réseau. Pour effectuer une telle
évaluation, on a utilisé pour cadre une approche en entonnoir en deux temps, allant du haut vers le bas. En un premier temps, on s’est servi des données
spécifiques au réseau ontarien, des données sur les technologies issues d’un sondage du CNRC et des hypothèses découlant du premier axe d’analyse.
Ensuite, on a utilisé le prix horaire réel de l’électricité, le prix public et les hypothèses du premier axe d’analyse pour analyser plus en profondeur l’intégration du SE et sa rentabilité. Cette approche, qui va du plus général au plus spécifique, a permis de brosser un tableau plus granulaire des possibilités du SE, selon la nature de la technologie et des projets.
Lors de la première étape, on a simulé 19 technologies de SE au niveau de la production et du transport de l’électricité, en appliquant les prix en vigueur sur chaque marché et pour chaque service, établis d’après une enquête auprès des intervenants du réseau de l’électricité ontarien et la façon dont la propriété financière est structurée en Ontario. Les cas d’utilisation s’appuyaient sur la supervision de la charge (ce qui n’est pas le cas pour l’instant, sur les marchés ou pour les services de la SIERE) en tant que principal service permettant d’optimiser la rentabilité de l’électricité ou sa valeur nette actualisée (VNA) potentielle. Les trois meilleures technologies de SE étaient le stockage d’énergie sous forme d’air comprimé dans des cavernes de sel (CAES-c), le stockage au moyen de batteries au sulfure de sodium (NaS) et le stockage avec des batteries au lithium ionique. La deuxième étape consistait en une analyse plus granulaire reposant sur une simulation, en l’occurrence le stockage de 10 MW sur 15 ans dans des batteries au lithium ionique de deux heures appartenant à des producteurs indépendants d’énergie pour trois cas d’utilisation typiquement ontariens, à savoir a) le stockage d’énergie en temps réel et les réserves d’exploitation, b) le rajustement global (RG) pour les abonnés de la classe A en plus du stockage d’énergie en temps réel et des réserves d’exploitation, et c) la réduction de la demande/la mise aux enchères de l’offre, en plus du stockage en temps réel et des réserves d’exploitation. Alors que l’analyse réalisée à la première étape englobait la totalité des services éventuels mentionnés lors du
sondage sur la production et le transport de l’énergie, celle de l’étape suivante ne portait que sur les services autorisant le SE, selon les règles de la SIERE applicables au marché, et s’appuyait sur les données historiques réelles de la SIERE. Pour modéliser l’exploitation pendant la durée entière d’un projet de SE à batteries au lithium ionique, on a simulé la répartition horaire de l’électricité au moyen d’une longue série de données chronologique en y intégrant les résultats des enchères sur les marchés ontariens selon un ordre de répartition ou une hiérarchie génériques pour les exploitants indépendants d’Amérique du Nord.
Principales constatations
• Une analyse en deux temps a servi à évaluer les types généraux de technologies de SE et des projets particuliers. Les meilleures technologies de SE sur les 19 simulées, en ce qui concerne les profits potentiels, sont le stockage sous forme d’air comprimé (CAES-c), le stockage dans des batteries au sulfure de sodium (NaS) et le stockage dans des batteries au lithium ionique.
• On a simulé le stockage de 10 MW dans des batteries au lithium ionique de deux heures sur une période de 15 ans pour trois cas d’utilisation selon les règles et la réglementation de la SIERE à partir des données réelles et obtenu un rapport avantages/coût allant de 0,6 à 0,98. • En réalité, ce rapport est sans doute plus
faible à cause des restrictions qui s’appliquent à la participation au marché, des produits déjà disponibles sur le marché et du manque de données publiques disponibles.
xiv
Lorsque l’on combine les résultats des deux étapes, on constate que le rapport avantages/coût potentiel (pour le propriétaire du système de SE) est supérieur à un pour les technologies CAES-c, NaS et lithium ionique. Dans le cas d’utilisation hypothétique (RG, classe A avec stockage de l’énergie en temps réel et réserves
d’exploitation), le rapport est de 0,98. L’analyse plus poussée du système de stockage de 10 MW avec des batteries au lithium ionique de deux heures sur les marchés et avec les services réels de la SIERE pour les trois cas d’utilisation spécifiques révèle un rapport avantage/coût situé entre 0,6 et 1. Comme la SIERE pourrait modifier sa politique sur les méthodes de paiement avec RG pour ses abonnés de la classe A, les économies que permettrait le SE au niveau du RG pourraient être différentes, voire disparaître complètement, si bien que les bénéfices seraient identiques à ceux du cas d’utilisation n’incluant que le stockage en temps réel et les réserves d’exploitation.
Notons que ces rapports avantages/coût ne devraient constituer qu’une valeur plancher. Les avantages ou revenus actuels tirés du SE en Ontario sont régis pour l’instant, d’où le rapport avantages/coût plus faible. À l’heure actuelle, la SIERE n’autorise pas le SE sur tous ses marchés ni pour tous ses services (Groupe consultatif de la SIERE sur le stockage de l’énergie, 2020). Ainsi, les profits issus du service de régulation et de la régulation de la fréquence pourraient augmenter le rapport avantages/coût. Si la SIERE créait un nouveau marché pour la supervision ou la hausse graduelle de la charge, il se pourrait qu’on assiste à une plus forte augmentation de la rentabilité ou du rapport avantages/coût du SE. Enfin, certains jeux de données ontariennes n’étaient pas disponibles au moment où le présent document a été rédigé, ce qui a interdit la simulation d’un cas d’utilisation incluant le service de régulation.
Troisième axe – Évaluation environnementale et socioéconomique
Beaucoup de rapports de l’industrie prévoient que des économies d’échelle, une plus grande normalisation et le perfectionnement des technologies devraient sensiblement réduire le coût du SE au cours des cinq prochaines années, puis que la hausse de la demande maintiendra cette tendance. La plus forte demande découlerait des innovations au niveau de la réglementation et des prix, d’une meilleure pénétration des énergies renouvelables, de l’engouement des exploitants pour les solutions sans fil et des contraintes liées à un réseau d’électricité vieillissant, qui doit s’adapter aux besoins de la société contemporaine.
Dans cette analyse, on a évalué les retombées socioéconomiques d’un plus vaste déploiement du SE en fonction du nombre d’emplois créés et du montant que le SE ajouterait au PIB ontarien, aux diverses étapes des projets. Les résultats montrent que la majorité des retombées économiques devraient survenir aux étapes de la
construction et de l’exploitation, un peu comme c’est le cas pour les projets sur l’énergie renouvelable. D’ici à 2030, le montant global ajouté directement au PIB de l’Ontario devrait être de 768 MS et le nombre d’emplois créés aux deux étapes précitées devrait s’établir à 5 781. Néanmoins, les retombées devraient être plus faibles que celles, par exemple, des projets d’énergie solaire photovoltaïque, car les systèmes de SE sont souvent modulaires et tributaires de l’importation, ce qui réduit les coûts durant l’étape de la construction.
xv
Déployer le stockage d’énergie à la grandeur du réseau d’électricité ontarien pourrait réduire sensiblement les émissions de GES que le réseau devrait libérer de 2020 à 2030. En recourant au stockage, on pourrait diminuer les émissions de CO2-eq du réseau complet de 11 % d’ici à
2030, pour un total de 4,5 Mt en CO2-eq.
Quand on compare l’impact des batteries au lithium ionique et celui des batteries à oxydoréduction au vanadium (VRFB) sur les émissions de GES, on constate que les systèmes de SE à VRFB sont plus écologiques que ceux à batteries au lithium ionique, car les
premières libèrent environ 76 % moins de GES pendant leur cycle de vie. Les GES dégagés par les systèmes à batteries au lithium ionique et à batteries VRFB durant leur cycle de vie le sont principalement lors de la
fabrication des composants (jusqu’à la mise en marché). La part que le stade de l’exploitation ajoute à l’impact du cycle de vie dépend des émissions marginales horaires du réseau, lesquelles reposent sur la variation de la composition de la charge et de l’efficacité globale. On estime que les systèmes VRFB déplaceraient moins d’émissions par mégawatt distribué pendant la phase d’exploitation, à cause des émissions marginales au moment de la journée où l’électricité est consommée, ce qu’exacerbe la faible efficacité globale du système. Toutefois, la variabilité des modalités d’exploitation du système de stockage d’énergie pourrait mener à une plus grande réduction des émissions de carbone.
On préconise une analyse comparative plus poussée sur l’impact des systèmes de SE sur les émissions de GES pendant leur cycle de vie, pour les différentes applications stationnaires du réseau d’électricité, car la vie utile d’une application donnée pourrait modifier l’effet de sa fabrication et de son exploitation sur le volume de GES.
Principales constatations
• On estime que le stockage de l’énergie devrait augmenter le PIB de l’Ontario de 768 M$ et créer 5 781 emplois.
• Le déploiement de systèmes de SE aurait l’avantage supplémentaire, sur le plan de l’environnement, de réduire le volume de GES libérés par le réseau d’électricité ontarien de 11 % d’ici à 2030 (baisse de 4,5 Mt en CO2-eq).
• L’impact global du SE (batteries au lithium ionique ou VRFB) sur les GES viendrait principalement des émissions dégagées durant la fabrication des composants du système de SE (jusqu’à sa mise en marché). • Les émissions totales de GES pendant la vie utile des batteries au lithium ionique et VRFB indiquent que la fraction de l’impact global attribuable à la phase d’utilisation dépend des émissions marginales au moment où
l’électricité est consommée durant la journée, et aussi de l’efficacité générale du système de SE.
xvi
Table of Contents
Preface ii
Executive Summary v
List of Figures xiv
List of Tables xv
1 Introduction 1
2 Grid Needs and Market Opportunity Pillar 3
2.1 Introduction to Pillar 1 ... 3
2.2 Energy Storage Study Review ... 4
2.3 Ontario Energy Planning Review ... 7
2.3.1 Long-Term Energy Plan ... 7
2.3.2 Ontario Planning Outlook ... 7
2.4 Ontario Electricity Markets ... 8
2.4.1 Real-Time Market ... 8
2.4.2 Day-Ahead Commitment Process ... 8
2.4.3 Real-Time Operating Reserve Markets ... 8
2.4.4 Global Adjustment ... 8
2.4.5 Demand Response... 9
2.4.6 Ancillary Services Market ... 10
2.4.7 Transmission Rights Market ... 10
2.5 Energy Storage Use Cases... 11
2.5.1 Energy Arbitrage ... 11
2.5.2 Economic Renewable Shifting ... 11
2.5.3 Spinning Reserve ... 11
2.5.4 Frequency Regulation ... 11
2.5.5 Frequency Response ... 11
2.5.6 Black Start ... 12
2.5.7 Capacity Deferral... 12
2.5.8 Transmission and Distribution Upgrade Deferral ... 12
2.5.9 Load Following ... 12
2.5.10 Stacked Services ... 12
2.6 Methodology ... 13
2.6.1 Methodology Overview ... 13
xvii
2.6.3 Capacity Optimization Phase ... 14
2.6.4 Production Cost Phase ... 15
2.6.5 Valuation Metrics ... 16
2.7 Input Data and Forecast ... 18
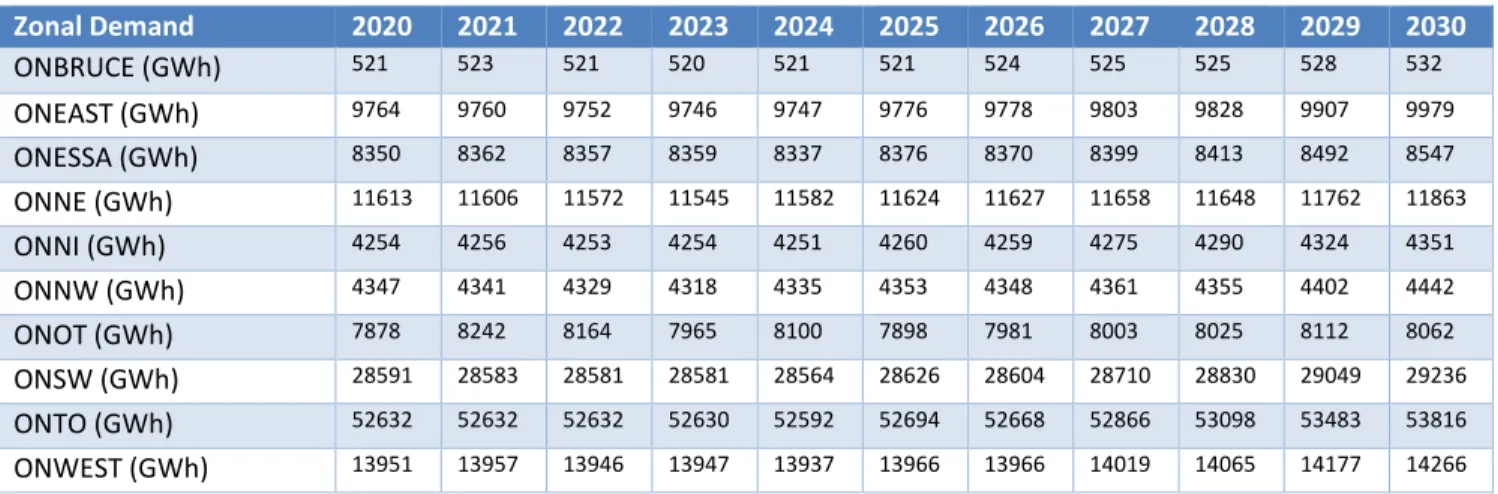
2.7.1 Demand ... 18
2.7.2 Load Profile and Forecast ... 18
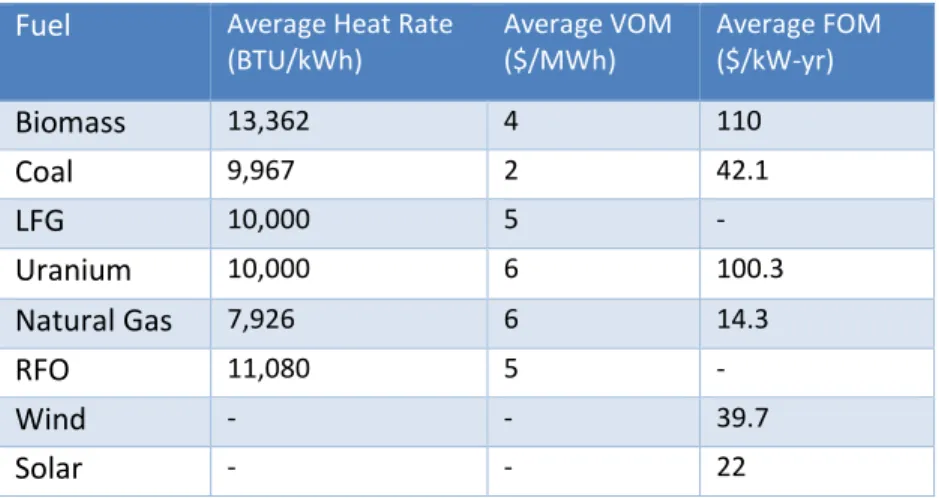
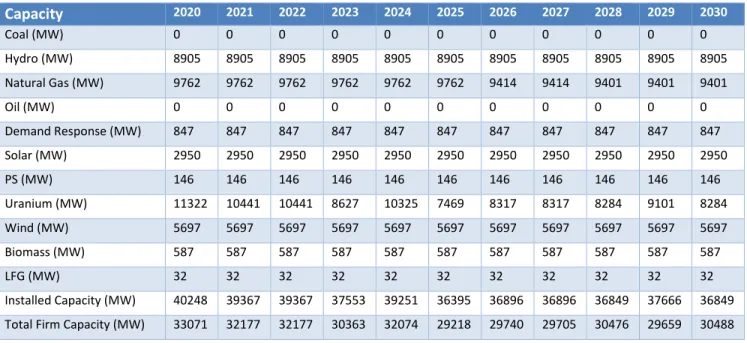
2.7.3 Generation and Capacity by Fuel ... 24
2.7.4 Fuel Price Forecasts ... 26
2.7.5 Emission Price Forecast ... 30
2.8 Technology Assumptions ... 33
2.8.1 General Assumptions ... 33
2.8.2 Energy Storage ... 33
2.8.3 Energy Storage Build Cost ... 34
2.8.4 Energy Storage Technical Life and Economic Life... 36
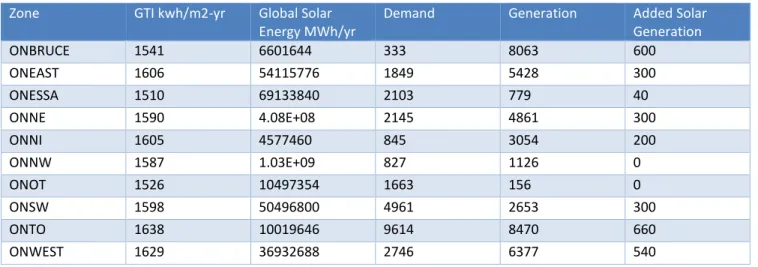
2.8.5 Wind and Solar Installation Assumptions ... 37
2.8.6 Natural Gas Expansion... 39
2.8.7 Ancillary Service Assumptions ... 39
2.8.8 Demand Response... 40
2.9 Case and Sensitivity Descriptions ... 41
2.9.1 Load Growth Sensitivity ... 41
2.9.2 Fuel Price Sensitivity ... 41
2.9.3 Carbon Tax Sensitivity ... 42
2.9.4 Energy Storage Cost Sensitivity ... 42
2.9.5 Energy Storage Fixed Operating and Maintenance Cost Sensitivity ... 43
2.10 Benchmark ... 44
2.10.1 Benchmark Energy Prices ... 44
2.10.2 Zonal Price Benchmark ... 44
2.10.3 Benchmark Capacity by Fuel Type ... 44
2.10.4 Benchmark Wind and Solar Firm Capacity ... 45
2.10.5 Benchmark Generator Capacities ... 46
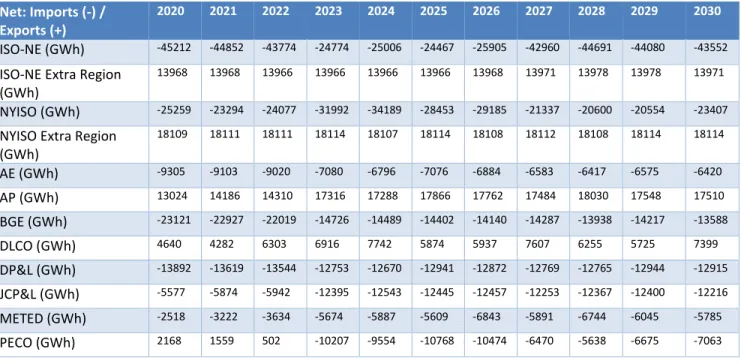
2.10.6 Net Export Energy Benchmark ... 47
2.10.7 Benchmark CO2 Emission ... 47
2.11 Simulation Results ... 48
2.11.1 Generation by Fuel Type ... 48
xviii
2.11.3 Ontario Pillar 2 Metrics ... 49
2.11.4 Acelerex Stacked Services Emulator Results ... 49
2.11.5 Base Case Results ... 50
2.11.6 Production Cost Results ... 55
2.11.7 Base Case with Storage Results ... 61
2.11.8 Production Cost Results ... 67
2.11.9 Sensitivity Case Summary ... 73
2.11.10 Energy Storage Deferral Value ... 82
2.12 Cost Benefit Analysis ... 88
2.12.1 Benefits ... 88
2.12.2 Storage Costs ... 91
2.12.3 Free Cash Flow ... 92
2.12.4 Net Present Value ... 93
2.13 Pillar 1 Conclusions ... 93
3 Technology Assessment and Valuation Pillar 95 3.1 Introduction to Pillar 2 ... 95
3.1.1 Relation to Pillar 1 ... 96
3.2 Background: Analysis, Market, and Technical Considerations ... 96
3.2.1 Overview of Analysis Objective ... 96
3.2.2 Market Considerations ... 96
3.2.3 Technical Considerations ... 98
3.3 Methodologies and Analytical Tools ... 99
3.3.1 Analysis Methodologies ... 100
3.3.2 Analysis Tools ... 102
3.4 Model Inputs and Assumptions ... 103
3.4.1 General Assumptions ... 103
3.4.2 Current Market Inputs ... 103
3.4.3 Technology Inputs ... 106
3.4.4 Financial Inputs ... 108
3.5 ES Technologies Ranking and Selection ... 109
3.5.1 Model Assumptions and Implications ... 109
3.5.2 Modelling Details ... 110
3.5.3 Modeling Results ... 111
3.6 Case Studies ... 113
xix
3.6.2 Use Case #2: IPP Owned, Customer-Sited ES, Shared Control by Customer and Utility for GA
Reduction (Class-A) and Grid Market Services ... 117
3.6.3 Use Case #3: IPP Owned ES for Demand Response Auction (to be replaced by Capacity Auction) and Grid Market Services ... 121
3.7 Conclusions... 129
4 Environmental and Socio-Economic Impact Assessment Pillar 131 4.1 Introduction to Pillar 3 ... 131
4.2 GHG Emissions Analysis ... 132
4.2.1 Background ... 132
4.2.2 Objectives ... 132
4.2.3 Methodology ... 133
4.2.4 Application of the Methodology ... 133
4.2.5 Evaluation of Environmental Impact of Energy Storage Systems... 146
4.3 Socio-Economic Impact Assessment ... 153
4.3.1 Methodology for Economic Impact Assessment of ES Projects ... 154
4.3.2 Socio-Economic Impact of Deploying ES in Ontario ... 155
4.4 Conclusions: Environmental and Socio-Economic Impact ... 157
5 References 160 Appendices 169 Capacity Forecast Data by Fuel Type ... 169
Fuel Price Forecast Data ... 169
Peak Demand Forecast ... 169
Energy Forecast ... 170
Solar and Wind Capacity ... 171
Capacity by Fuel Type Benchmark Values ... 171
Demand and Capacity with Reserve Margin ... 172
Energy Storage Nodes ... 172
ES Select Storage Options and Abbreviations 178 Treatment of ES Technology Options 179 Benefit Calculation Methodology 181 Data References ... 185
Terminology ... 186
Summary of Ontario’s Climate Change Framework 187
Summary of Life Cycle Inventory – Li-ion Battery and VRFB 188
xx
ES Environmental Impact at Grid Level for Different ES Deployment Scenarios 190
List of Figures
Figure 1. Demand forecast comparison of 2020 APO and 2017 LTEP ... iii Figure 2. Three pillars of analysis in the Canadian Energy Storage Study project ...1 Figure 3. Average HOEP plus Average Global Adjustment ...9 Figure 4. Methodology ... 13 Figure 5. Constraints for Various Phases of Modeling ... 14 Figure 6. Capacity Expansion Horizons ... 14 Figure 7. Historical Ontario Load Profile by Zone ... 18 Figure 8. Annual Planning Outlook 2020 Ontario Peak Demand and Energy Forecast ... 18 Figure 9. Forecast Peak Demand by Year and Zone, MW [3] ... 19 Figure 10. Forecast Energy Demand by Year and Zone, GWh [3] ... 19 Figure 11. Ontario Hourly Zonal Load Forecast ... 20 Figure 12. Ontario Bruce Zone Load Forecast ... 20 Figure 13. Ontario East Zone Load Forecast ... 20 Figure 14. Ontario Essa Load Forecast ... 21 Figure 15. Ontario Northeast Zone Load Forecast ... 21 Figure 16. Ontario Niagara Zone Load Forecast ... 21 Figure 17. Ontario Northwest Zone Load Forecast ... 22 Figure 18. Ontario Ottawa Zone Load Forecast ... 22 Figure 19. Ontario Southwest Zone Load Forecast ... 23 Figure 20. Ontario Toronto Zone Load Forecast ... 23 Figure 21. Ontario West Zone Load Forecast ... 23 Figure 22. Ontario Generation by Fuel Type and Conservation in TWh [7] ... 24 Figure 23. Year-end Installed Capacity by Fuel Type Forecast [7] ... 25 Figure 24. Summer Peak Demand and Total Capacity Requirement Forecast [9] ... 25 Figure 25. Fuel Price Forecast from 2016 in CAD$/GJ [11], [12] ... 26 Figure 26. Ontario Zones and Interconnections [4] ... 27 Figure 27. Historical 2017 Intertie Flows ... 28 Figure 28. Ontario Geographical Zones ... 30 Figure 29. Ontario Generation by Fuel Type and Transmission Map [16] ... 30 Figure 30. Operating Reserve Prices in 2018 [17] ... 32 Figure 31. Wind Power Density Map of Ontario ... 37 Figure 32. Solar Power Density Map for Ontario ... 38 Figure 33. Added Solar Power Generation... 38 Figure 34. Load Growth Sensitivity Input Data ... 41 Figure 35. Natural Gas Fuel Price Sensitivity Input Data ... 42 Figure 36. Carbon Emissions Tax Sensitivity Input Data ... 42 Figure 37. Technology Sensitivity by Bucket (Long, Medium Long, Medium Short, Short Duration) ... 43 Figure 38. Energy Price Benchmark [21] ... 44
xxi
Figure 39. Zonal Energy Price Benchmark [21] ... 44 Figure 40. Benchmark Capacity by Fuel Type [19] ... 45 Figure 41. IESO 2018 Outlook Firm Capacity [15] ... 45 Figure 42. Solar and Wind Firm Capacity in MW [19] ... 46 Figure 43. Generator Capacity Benchmark using 2018 IESO GOC [19] ... 46 Figure 44. Import and Export Forecast Benchmark Comparison [19] ... 47 Figure 45. CO2 Emissions Benchmark with IESO Outlook [21] ... 47 Figure 46. Generation by Fuel Type [21] ... 48 Figure 47. 2020 Hourly Energy Price Forecast Results ... 48 Figure 48. Energy Storage Built Power and Energy for each Sensitivity Case ... 73 Figure 49. Deferral of Distribution, Transmission, and Peaking Infrastructure Cost ... 84 Figure 50. Funnel Model ... 101 Figure 51. Benefits and Costs over Project Life of Use Case #1 (only existing Market Services). ... 116 Figure 52. Modelled Services Prioritization in Use Case #2 ... 119 Figure 53. Benefits and Costs over Project Life of Use Case #2 (GA Reduction along with Existing Market
Services). ... 121 Figure 54. Modelled Services Prioritization in Use Case #3 ... 123 Figure 55. Benefits and Costs over Project Life of Use Case #3 (DR Auction along with Existing Market
Services). ... 125 Figure 56. Qualifying Capacity Performance for Demand Response Service, Winter Commitment Period
Only. ... 125 Figure 57. Qualifying Capacity Performance for Demand Response Service, Summer Commitment Period
Only. ... 126 Figure 58. ES Technology Share in the IESO ES Procurement Process ... 134 Figure 59. Flow-diagram of the System Function and Related Unit Processes of Li-ion Battery ES System 137 Figure 60. Flow-diagram of the System Function and Related Unit Processes of VRFB ES System... 138 Figure 61. Utility-scale Battery Energy Storage System Topology adapted from (Holger, et al. 2017)... 139 Figure 62. System Level GHG Emissions Outlook in the Ontario Electricity Grid (2020-2030) ... 147 Figure 63. Net Natural Gas GHG Emission Reductions due to Energy Storage Operation in the Ontario
Electricity Grid (2020-2030) ... 148 Figure 64. ES Allocation Scenarios by Technology... 149 Figure 65. ES Environmental Impact at Grid Level for Different ES Deployment Scenarios ... 149 Figure 66. Comparison of Grid-level GHG Emissions without ES and with ES Capacity Scenarios in the
Ontario Electricity Grid (2020-2030)... 150 Figure 67. Time-of-the-day Marginal Emission Factors 2020-2030, ES Capacity Scenario ... 151 Figure 68. Life Cycle GHG Impact Comparison for ES Technologies... 153 Figure 69. Methodology of Estimating Socio-economic Impact ... 154 Figure 70. GDP Impact of Deploying Energy Storage Systems in the Province of Ontario ... 156 Figure 71. Number of Jobs Impact of Deploying Energy Storage Systems in the Province of Ontario ... 156 Figure 72. Identified Top 5 Demand Peak Hours (see arrows) through ESVT, Consistent with IESO Released
xxii
List of Tables
Table 1. Policy Changes and their Impacts on this Study since the Time of the Analysis ... iii Table 2. Installed Capacity Comparison by Generation Fuel Type between 2020 APO and 2017 LTEP ... iv Table 3. Nuclear Generation Plant Refurbishment Schedule Comparison between 2020 APO and 2017 LTEP
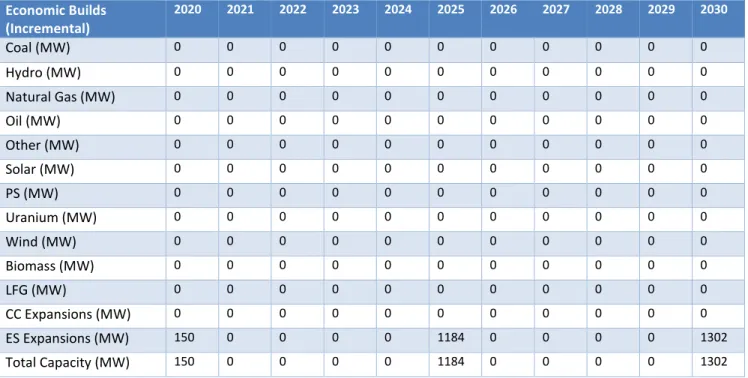
... v Table 4. Total Cost, and Net Present Value for the Low, Base, and High Cases... viii Table 5. Review of Applicable ES Studies ...4 Table 6. Demand Response Auction ...9 Table 7. Energy Storage Expansion Object Types ... 15 Table 8. Energy System Benefits Analysis Metrics ... 16 Table 9. Nuclear Refurbishment Schedule [11] ... 24 Table 10. Historical 2017 Intertie Net Flow in GWh [5] ... 27 Table 11. Interconnection Circuit and Connection Type [4] ... 28 Table 12. Interconnection Flow Limits [4] ... 28 Table 13. Imports and Exports Forecast [6] ... 29 Table 14. Canadian Carbon Tax [13] ... 30 Table 15. Ancillary Services Annual Cost and Quantity in 2017 [18] ... 31 Table 16. General Data Input Assumptions ... 33 Table 17. Average Heat Rate, VOM, and FOM Charge by Generation Fuel Type ... 33 Table 18. Representative Energy Storage Technologies and Cost Decline Assumptions ... 33 Table 19. Forecasted Installed Cost of Energy Storage by Duration for Capacity and Energy ... 34 Table 20. Energy Storage FOM Parameters for Distribution Connected Systems ... 35 Table 21. Energy Storage Technology and Economical Life and Efficiency ... 36 Table 22. Valuation Data Assumption Source ... 36 Table 23. Added Wind Power Generation ... 37 Table 24. Zonal Solar and Wind Generation ... 39 Table 25. Natural Gas Generator Characteristics for Expansion ... 39 Table 26. Spinning Reserves with their Load Risk Percentage ... 39 Table 27. Demand Response and Zonal Distribution [1][2][3] ... 40 Table 28. FOM Values for Type L, ML, MS and S for Marginal D Sensitivity ... 43 Table 29. Ontario Pillar 2 Metrics ... 49 Table 30. EA Revenue from Acelerex SSE Simulation ... 50 Table 31. Demand by Year for Base Case (Input) ... 50 Table 32. Planning Capacity by Year for Base Case (Output) ... 50 Table 33. Installed Capacity by Year for Base Case (Input) ... 51 Table 34. Economic Builds by Year for Base Case (Output) ... 51 Table 35. Economic Build Cost by Year for Base Case (Output) ... 51 Table 36. Economic Retirements by Year for Base Case (Output) ... 52 Table 37. Net Planned Builds/Planned Retirements by Year for Base Case (Input) ... 52 Table 38. Net Energy Imports and Exports by Year for Base Case (Output) ... 53 Table 39. Fuel Price by Year for Base Case (Input) ... 54 Table 40. Energy by Fuel Type by Year for Base Case (Output) ... 54 Table 41. Zonal Energy Price by Year for Base Case (Output) ... 54
xxiii
Table 42. CO2 Emissions by Year for Base Case (Output) ... 55 Table 43. Metrics by Year for Base Case (Output) ... 55 Table 44. IESO Demand by Year for Base Case (Input) ... 55 Table 45. Zonal Demand by Year for Base Case (Output) ... 56 Table 46. Zonal Generation by Year for Base Case (Output) ... 56 Table 47. Fuel Consumption by Year for Base Case (Output) ... 56 Table 48. Average Annual Electricity Price by Year for Base Case (Output)... 57 Table 49. Fuel Prices by Year for Base Case (Input) ... 57 Table 50. Generation by Fuel Type by Year for Base Case (Output) ... 57 Table 51. Net Imports and Exports by Year for Base Case (Output) ... 58 Table 52. Generation Cost by Year for Base Case (Output) ... 58 Table 53. Zonal Price by Year for Base Case (Output) ... 59 Table 54. Cost to Load by Year for Base Case (Output) ... 59 Table 55. CO2 Emissions by Year for Base Case (Output) ... 60 Table 56. FOM Cost by Year for Base Case (Output) ... 60 Table 57. VOM Cost by Year for Base Case (Output) ... 60 Table 58. Capacity Factor by Year for Base Case (Output) ... 60 Table 59. Metrics by Year for Base Case (Output) ... 61 Table 60. Energy Storage Built Bucket for Base Case with Storage ... 61 Table 61. Demand by Year for Base Case with Storage (Input) ... 62 Table 62. Planning Capacity by Year for Base Case with Storage (Output) ... 62 Table 63. Installed Capacity by Year for Base Case with Storage (Input) ... 62 Table 64. Economic Builds by Year for Base Case with Storage (Output) ... 62 Table 65. Economic Build Cost by Year for Base Case with Storage (Output) ... 63 Table 66. Economic Retirements by Year for Base Case with Storage (Output) ... 63 Table 67. Net Planned Builds/Planned Retirements by Year for Base Case Storage (Output) ... 64 Table 68. Net Energy Imports and Exports by Year for Base Case with Storage (Output) ... 64 Table 69. Fuel Price by Year for Base Case with Storage (Input) ... 65 Table 70. Energy by Fuel Type by Year for Base Case with Storage (Output) ... 66 Table 71. Zonal Energy Price by Year for Base Case with Storage (Output) ... 66 Table 72. CO2 Emissions by Year for Base Case with Storage (Output) ... 66 Table 73. Metrics by Year for Base Case with Storage (Output) ... 67 Table 74. IESO Demand by Year for Base Case with Storage (Input) ... 67 Table 75. Zonal Demand by Year for Base Case with Storage (Output) ... 67 Table 76. Zonal Generation by Year for Base Case with Storage (Output) ... 68 Table 77. Fuel Generation by Year for Base Case with Storage (Output) ... 68 Table 78. Average Annual Electricity Price by Year for Base Case with Storage (Output) ... 68 Table 79. Fuel Prices by Year for Base Case with Storage (Output) ... 68 Table 80. Generation by Fuel Type by Year for Base Case with Storage (Output) ... 69 Table 81. Net Imports and Exports by Year for Base Case with Storage (Output) ... 69 Table 82. Generation Cost by Year for Base Case with Storage (Output) ... 70 Table 83. Zonal Price by Year for Base Case with Storage (Output) ... 70 Table 84. Cost to Load by Year for Base Case with Storage ... 71
xxiv
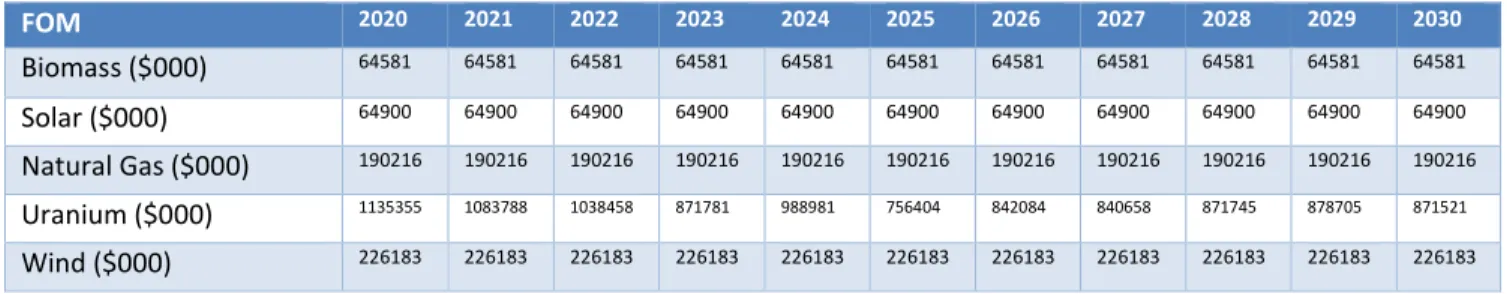
Table 85. CO2 Emissions by Year for Base Case with Storage... 71 Table 86. FOM Cost by Year for Base Case with Storage ... 71 Table 87. VOM Cost by Year for Base Case with Storage ... 72 Table 88. Capacity Factor by Year for Base Case with Storage (Output)... 72 Table 89. Metrics by Year for Base Case with Storage (Output) ... 72 Table 90. Energy Storage Built in Sensitivity Cases ... 73 Table 91. Storage Built by Year by Duration Type for High Load Growth Scenario ... 74 Table 92. Sensitivity Metrics for High Load Growth Scenario without Energy Storage ... 74 Table 93. Sensitivity Metrics for High Load Growth Scenario with Energy Storage ... 74 Table 94. Storage Built by Year by Duration Type for Low Load Growth Scenario ... 75 Table 95. Sensitivity Metrics for Low Load Growth Scenario without Energy Storage ... 75 Table 96. Sensitivity Metrics for Low Load Growth Scenario with Energy Storage ... 75 Table 97. Storage Built by Year by Duration Type for High Fuel Price Scenario ... 76 Table 98. Sensitivity Metrics for High Fuel Price Scenario without Energy Storage ... 76 Table 99. Sensitivity Metrics for High Fuel Price Scenario with Energy Storage ... 77 Table 100. Storage Built by Year by Duration Type for Low Fuel Price Scenario ... 77 Table 101. Sensitivity Metrics for Low Fuel Price Scenario without Energy Storage ... 77 Table 102. Sensitivity Metrics for Low Fuel Price Scenario with Energy Storage ... 78 Table 103. Storage Built by Year by Duration Type for High Carbon Tax Scenario ... 78 Table 104. Sensitivity Metrics for High Carbon Tax Scenario without Energy Storage ... 79 Table 105. Sensitivity Metrics for High Carbon Tax Scenario with Energy Storage ... 79 Table 106. Storage Built by Year by Duration Type for Low Carbon Tax Scenario ... 80 Table 107. Sensitivity Metrics for Low Carbon Tax Scenario without Energy Storage ... 80 Table 108. Sensitivity Metrics for Low Carbon Tax Scenario with Energy Storage ... 80 Table 109. Storage Built by Year by Duration Type for High Tech Cost Scenario ... 81 Table 110. Sensitivity Metrics for High Tech Cost Scenario with Energy Storage... 81 Table 111. Storage Built by Year by Duration for Low Tech Cost Scenario ... 82 Table 112. Sensitivity Metrics for Low Tech Cost Scenario with Energy Storage ... 82 Table 113. Capacity Built by Region by Deferral Value ... 83 Table 114. Energy Storage Power and Capacity Built by Deferral Value Sensitivity ... 83 Table 115. Storage Built by Year by Duration Type for D=34 $/kW-yr Scenario ... 84 Table 116. Sensitivity Metrics for D=35 $/kW-yr Scenario with Energy Storage ... 84 Table 117. Storage Built by Year by Duration Type for D=40 $/kW-yr Scenario ... 85 Table 118. Sensitivity Metrics for D=40 $/kW-yr Scenario with Energy Storage ... 85 Table 119. Storage Built by Year by Duration Type for D=45 $/kW-yr Scenario ... 86 Table 120. Sensitivity Metrics for D=45 $/kW-yr Scenario with Energy Storage ... 86 Table 121. Storage Built by Year by Duration Type for D=50 $/kW-yr Scenario ... 86 Table 122. Sensitivity Metrics for D=50 $/kW-yr for Scenario with Energy Storage ... 86 Table 123. Storage Built by Year by Duration Type for D=55 $/kW-yr Scenario ... 87 Table 124. Sensitivity Metrics for D=55 $/kW-yr Scenario with Energy Storage ... 87 Table 125. FOM Delta Results for Low, Base, and High Cases ... 88 Table 126. Capacity Value Results for Low, Base and High Case Storage ... 89 Table 127. Generation Cost Delta Results for Low, Base and High Cases ... 89
xxv
Table 128. Ancillary Services Results for Low, Base, and High Cases ... 90 Table 129. Energy Arbitrage Results for Low, Base, and High Cases ... 91 Table 130. Storage Cost Annuity Results for Low, Base, and High Cases ... 91 Table 131. Total Present Value Benefits for Low, Base, and High Cases ... 92 Table 132. Total Present Value Cost Results for Low, Base, and High Cases ... 92 Table 133. Net Present Value Results for Low, Base, and High Cases ... 93 Table 134. Overview of IESO Markets and Services ... 97 Table 135. Summary of Grid or Markets and Services Benefits Modelled by ES Select ... 104 Table 136. Summary of Grid or Markets and Services Benefits Modelled by ESVT. ... 105 Table 137. Technology Cost and Performance Data for LiB with Capacity of 10MW and Energy Duration of 2 hours. ... 107 Table 138. Financial Inputs for ES Select Valuation Tool ... 108 Table 139. Financial Inputs for ESVT Valuation Tool and IPP Ownership Structure ... 109 Table 140. Generation Level Over 50MW (Central or Bulk Storage) Grid Application Priority and Annual
Benefit ... 110 Table 141. Transmission Level up to 10MW (Substation) Grid Application Priority and Annual Benefit ... 110 Table 142. Generation Level Feasibility Score, Payback Time in Years and NPV in CAD/kW Listed in
Descending Order ... 111 Table 143. Transmission Level Feasibility Score, Payback Time in Years and NPV in CAD/kW Listed in
Descending Order ... 111 Table 144. Combined Feasibility Score for Generation and Transmission Levels and Ranking of ES
Technology Classes in Descending Order ... 112 Table 145. Possible Combinations of IESO Wholesale Market Products that ES can Participate in Today
(IESO's ESAG 2020) ... 113 Table 146. Brief Summary of ES Use Cases Being Studied ... 114 Table 147. Net Present Value over Project Life of Use Case #1 ... 116 Table 148. Net Present Value over Project Life of Use Case #2 ... 120 Table 149. Net Present Value over Project Life of Use Case #3 ... 124 Table 150. Comparison with Different DR Commitment Period Scenarios ... 127 Table 151. Comparison between Scenarios of Different Auction Clearing Prices and/or Different Auction
Types ... 128 Table 152. Comparison between Scenarios of Different LIB Energy Durations ... 128 Table 153. Component Mass Breakdown and Performance of the Modelled Battery (LFP) System
(Majeau-Bettez, Hawkins, and Stromman 2011, Peters and Weil, 2017, Weber et al. 2018) ... 135 Table 154. Component Mass Breakdown and Performance of the Modelled Battery (VRFB) System (Weber
et al. 2018) ... 135 Table 155. Major Assumptions Made for Cradle-to-Gate and Recycling Phases for the Li-ion Battery used in
Stationary Application ... 141 Table 156. Major Assumptions Made for Cradle-to-Gate and Recycling Phases for VRFB used in Stationary
Application ... 142 Table 157. GHG Emissions during Manufacturing and Recycling for Li-ion and VRFB ES Systems ... 146 Table 158. Operations Phase GHG Emissions for ES Technology Comparisons ... 152 Table 158. Life Cycle GHG Emission Intensities of ES Technology Types ... 153
xxvi
Table 159. Main Assumptions of Socio-economic Impact Assessment ... 155 Table 160. Direct Impact Comparison to Renewable Technologies ... 157 Table A 1. Year-end Installed Capacity by Fuel Type Forecast [7]... 169 Table A 2. Fuel Price Forecast in 2016 CAD$/GJ [11], [12] ... 169 Table A 3. Forecast Peak Demand by Year, MW [3] ... 169 Table A 4. Forecast Energy Demand by Year, GWh ... 170 Table A 5. Solar and Wind Firm Capacity [15] ... 171 Table A 6. Capacity by Fuel Type Benchmark ... 171 Table A 7. Summer Peak Demand and Total Capacity Requirement Forecast [9] ... 172 Table A 8. List of Energy Storage Nodes ... 172 Table A 9. ES Select Storage Options and Abbreviations in Alphabetical Order ... 178 Table A 10. Examples of Electrochemical and Mechanical ES Technologies ... 179 Table A 11. Sources from SAND2015-1002 for ES Technology Cost and Performance Data (Akhil, Huff and
Currier 2015) ... 180 Table A 12. Summary of Ontario’s Climate Change Framework (Lee-Andersen 2017) ... 187 Table A 13. Life Cycle Inventory Summary for 1 kg of Li-ion Battery Pack System (Majeau-Bettez, Hawkins,
and Stromman 2011) ... 188 Table A 14. Life Cycle Inventory Summary for 1 kg of VRFB ES System (Weber et al. 2018) ... 188 Table A 15. ES Allocation Scenarios by Technology for the ES Capacity Case ... 189 Table A 16. ES Environmental Impact at Grid Level for Different ES Deployment Scenarios ... 190
![Figure 22. Ontario Generation by Fuel Type and Conservation in TWh [7]](https://thumb-eu.123doks.com/thumbv2/123doknet/13983244.454438/52.918.146.762.232.511/figure-ontario-generation-fuel-type-conservation-twh.webp)