COMPUTED TOMOGRAPHY
Combining automated attenuation-based tube voltage
selection and iterative reconstruction: a liver phantom study
Daniela B. Husarik&Sebastian T. Schindera&Fabian Morsbach&Natalie Chuck&Burkhardt Seifert&
Zsolt Szucs-Farkas&Hatem Alkadhi
Received: 13 August 2013 / Revised: 27 September 2013 / Accepted: 4 October 2013 / Published online: 24 October 2013 # European Society of Radiology 2013
Abstract
Objectives To determine the value of combined automated attenuation-based tube-potential selection and iterative reconstructions (IRs) for optimising computed tomography (CT) imaging of hypodense liver lesions.
Methods A liver phantom containing hypodense lesions was imaged by CT with and without automated attenuation-based tube-potential selection (80, 100 and 120 kVp). Acquisitions were reconstructed with filtered back projection (FBP) and sinogram-affirmed IR. Image noise and contrast-to-noise ratio (CNR) were measured. Two readers marked lesion localisation and rated confidence, sharpness, noise and image quality on a five-point scale (1 = worst, 5 = best).
Results Image noise was lower (31–52 %) and CNR higher (43–102 %) on IR than on FBP images at all tube voltages. On 100-kVp and 80-kVp IR images, confidence and sharpness were higher than on 120-kVp FBP images. Scores for image quality score and noise as well as sensitivity for 100-kVp IR were similar or higher than for 120-kVp FBP and lower for 80-kVp IR. Radiation dose was reduced by 26 % at 100 kVp and 56 % at 80 kVp.
Conclusions Compared with 120-kVp FBP images, the combination of automated attenuation-based tube-potential
selection at 100 kVp and IR provides higher image quality and improved sensitivity for detecting hypodense liver lesions in vitro at a dose reduced by 26 %.
Key Points
• Combining automated tube voltage selection/iterative CT reconstruction improves image quality.
• Attenuation values remain stable on IR compared with FBP images.
• Lesion detection was highest on 100-kVp IR images. Keywords Computed tomography . Optimisation . Iterative reconstruction . Radiation dose . Liver
Introduction
The number of computed tomography (CT) examinations performed is still rising [1] and resulting in a marked increase in radiation exposure in the population [2]. Various means of reducing and optimising radiation exposure according to the ALARP (as low as reasonably practicable) principle are being routinely applied, including attenuation-based tube current modulation, imaging at low tube voltage, selective in-plane shielding, or noise reduction filters [3–7].
Recently, two other techniques have been introduced that have the potential for a further reduction of CT radiation dose: automated attenuation-based tube voltage selection and iterative reconstruction (IR). Automated attenuation-based tube voltage selection is a method that selects the tube voltage based on the attenuation detected on the scout image and that takes into account the diagnostic task of the CT study [8–11]. As a trade-off for the advantage of a higher attenuation of iodine at lower tube voltages, a slightly higher image noise is accepted. IR for CT image reconstruction has become applicable in clinical practice for various body regions and indications [12–17] and can be used either to improve image quality at a constant radiation dose or to reduce radiation dose D. B. Husarik (*)
:
F. Morsbach:
N. Chuck:
H. AlkadhiInstitute for Diagnostic and Interventional Radiology, University Hospital Zurich, Raemistrasse 100, 8091 Zurich, Switzerland e-mail: [email protected]
S. T. Schindera
Radiology and Nuclear Medicine, University Hospital Basel, Petersgraben 4, 4031 Basel, Switzerland
B. Seifert
Division of Biostatistics, Institute of Social and Preventive Medicine, University of Zurich, Hirschengraben 84, 8001 Zürich, Switzerland Z. Szucs-Farkas
Radiology, Hospital Centre Biel, Vogelsang 84, 2501 Biel, Switzerland
at constant image quality [18–20]. While the single use of each of the two techniques has been repetitively demonstrated by various studies, the combination of automated attenuation-based tube voltage selection and IR has only been examined for coronary CT angiography [21], and not liver imaging.
The purpose of our study was to compare qualitative and quantitative image parameters, sensitivity for the detection of hypodense liver lesions, and the radiation dose of CT images using the combination of automated attenuation-based tube potential selection and IR. Our hypothesis was that the partial increase in image noise that occurs through automated attenuation-based tube voltage selection can be offset by the application of IR.
Materials and methods Phantom
The custom-made liver phantom (QRM, Moehrendorf, Germany) with a diameter of 15 cm and a length of 25.5 cm was designed to mimic the liver parenchyma during the portal venous phase at various tube voltages. Forty-three hypodense lesions in three sizes (5 mm, 10 mm and 15 mm) and three conspicuity levels (lesion-to-liver contrast values at 120 kVp of 10, 25 and 50 HU) were simulated by embedding
hypodense spheres into the simulated liver parenchyma (Fig.1). A homogeneous mixture of resin, including additives such as calcium carbonate and organic iodine, was used to compose both the simulated liver parenchyma and the lesions. The attenuation values of the simulated liver parenchyma and the lesions are based on a preliminary patient study and reflect the properties of the liver in patients during the portal venous phase at all tube voltages. The simulated lesions were distributed in the phantom to achieve transverse CT images with either no lesion or one to seven lesions. The reference standard for lesion location was the construction plan of the phantom.
Additionally, a high-contrast spatial resolution phantom (QRM-3DSR; QRM) with line pairs per centimetre ranging between 1.24 and 12.5 was used to assess spatial resolution on transverse images (x-y axes). To simulate the abdominal cross-sectional dimension of a patient of intermediate weight (72–85 kg), the liver phantom and the spatial-resolution phantom were consecutively placed in a cylindrical, water-filled plastic container (30 cm in diameter) [22].
CT image acquisition
Imaging was performed using a second-generation 128-section dual-source CT machine (SOMATOM Definition Flash; Siemens Healthcare, Forchheim, Germany). First, the Fig. 1 Selected representative
slice of the dataset imaged at 100 kVp reconstructed with filtered back projection (FBP) (a), iterative reconstruction 3 (IR3) (b), IR4 (c) and IR5 (d) demonstrating a 15-mm high-conspicuity lesion (open white arrow), a 10-mm medium-conspicuity lesion (open black arrow), a 5-mm high-conspicuity lesion (black arrow), and a 5-mm medium-conspicuity lesion (white arrow). The noise decreases and the lesion margins become sharper from FBP (a) to IR3 (b), IR4 (c) and IR5 (d). While the 5-mm medium-conspicuity lesion (white arrow) can barely be delineated on the FBP image (a), it becomes more conspicuous on the IR3 (b), IR4 (c) and IR5 images (d)
water container was imaged containing the spatial resolution phantom and then the liver phantom using the following imaging parameters. The standard of reference acquisition was performed with a quality reference tube voltage of 120 kVp and with a quality reference tube current-time product of 210 mAs, corresponding to our used clinical settings for abdominal CT. Then, we selected the automated attenuation-based tube voltage selection algorithm (Weighting 7–abdomen, see paragraph on automated attenuation-based tube voltage selection below), after which the system automatically switched to 100 kVp, which was then to be used for the entire CT data acquistion. For testing whether
or not the automatically selected 100 kVp was the optimal tube voltage for this phantom size, simulated organ and intended indication (i.e. detection of liver lesions), we additionally semi-automatically selected the 80-kVp setting. Corresponding new quality reference tube current–time products, which were automatically re-calculated by the algorithm after the tube potentials changed, were 261 mAs for 100 kVp and 318 mAs for 80 kVp.
Automated attenuation-based tube current modulation (CAREDose4D) was switched off owing to the cylindrical (round cross-section) nature of the phantom with the same diameter across the entire length. All other CT protocol parameters were kept constant (Table 1).
The three acquisitions were reconstructed with standard filtered back projection (FBP) using a medium-soft tissue convolution kernel (B30f) and using three incremental strength levels of sinogram-affirmed IR (IR3, IR4 and IR5, kernel I30f), resulting in a total of 12 datasets for quantitative and qualitative image analysis.
Automated attenuation-based tube voltage selection
The automated tube voltage selection algorithm utilised (CAREkV) is a software that optimises the tube voltage for each acquisition individually, based on each patient’s attenuation measured in the CT scout and a selected diagnostic task [8,10]; in the case of this study, Weighting 7–abdomen.
This gives the system the information that the task at hand is a contrast-enhanced abdominal CT (compared with other settings, such as for an unenhanced acquisition or a CT angiogram). The algorithm calculates an optimised tube current for each tube voltage to reach the pre-defined image quality that allows fulfilling the task according to the patient’s attenuation along the z -axis obtained from the CT scout. If this can be achieved at a tube voltage lower than the quality reference tube voltage of 120 kVp, the acquisition is performed at the lowest possible tube voltage. If the required tube current for this lower tube voltage exceeds the system limits, the software selects the next higher tube voltage and the calculation is repeated. Depending on the indication, the Table 1 CT protocol parameters
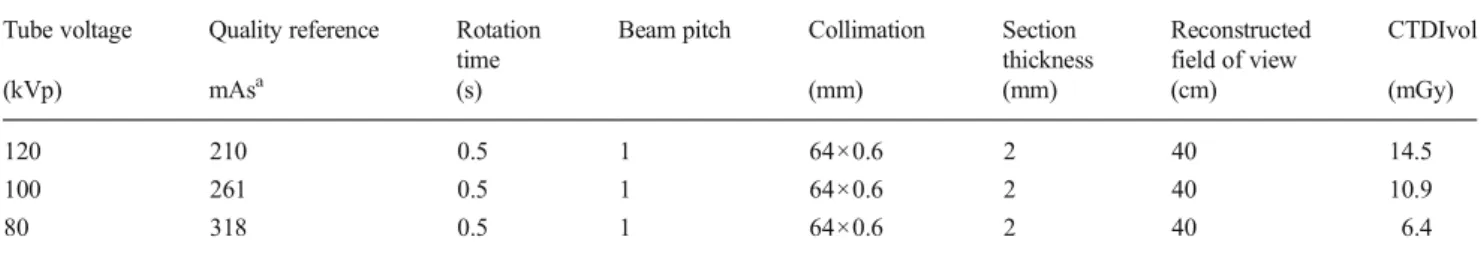
Tube voltage Quality reference Rotation time
Beam pitch Collimation Section thickness Reconstructed field of view CTDIvol (kVp) mAsa (s) (mm) (mm) (cm) (mGy) 120 210 0.5 1 64×0.6 2 40 14.5 100 261 0.5 1 64×0.6 2 40 10.9 80 318 0.5 1 64×0.6 2 40 6.4
kVp peak kilovoltage, mAs milliampere-second, CTDIvol volume-weighted computed tomography dose index in mGy, mA milliampere, mm millimetre
a
Quality reference mAs equal to effective mAs due to switched off attenuation-based tube current modulation
Table 2 Image quality scales
Subjective overall image quality (per dataset) 1 bad, no diagnosis possible
2 poor, diagnostic confidence substantially reduced 3 moderate, but sufficient for diagnosis
4 good
5 excellent
Subjective image noise (per dataset)
1 major, unacceptable
2 substantial, above average, affecting interpretation 3 moderate, average, does not affect interpretation
4 minor, below average
5 absent
Confidence (per lesion)
1 non-diagnostic, cannot identify or rule out a lesion 2 will potentially miss a lesion
3 will probably not miss or mischaracterise a lesion 4 will most likely identify all abnormalities 5 can detect a lesion without diagnostic compromise Lesion contour sharpness (per lesion)
1 severely blurred, unsharp, very poor
2 noticeable blur, unsharpness, poorly defined edges 3 moderate, slightly blurred, unsharp
4 good, mildly unsharp edges 5 excellent, very sharp
algorithm accepts higher image noise at lower tube voltage settings [8–10,23].
Sinogram-affirmed iterative reconstruction
A recently introduced iterative reconstruction (IR) algorithm is sinogram-affirmed IR (SAFIRE; Siemens Healthcare) [24]. In IR, correction loops are introduced into the image reconstruction process and each time the original image is updated by a correction image. Sinogram-affirmed IR uses a noise-modelling technique supported by the raw data (sinogram data) with the aim of reducing noise while maintaining image sharpness. For sinogram-affirmed IR, five presets are available representing different strength levels (1– 5), to obtain pre-defined noise reduction and allowing for various image impressions depending on strength level.
Radiation dose estimation
For radiation dose comparison between protocols, the CT volume dose index (CTDIvol) was obtained from the
electronically stored protocol from each CT study. The CT system determined CTDIvolwas tested for accuracy for the
methods utilised.
Spatial resolution assessment
A subjective assessment of spatial resolution was performed in consensus by two readers (F.M. and D.B.H. with 2 and 6 years of experience in abdominal CT). Readers reported the highest distinguishable line pairs per centimetre for each dataset.
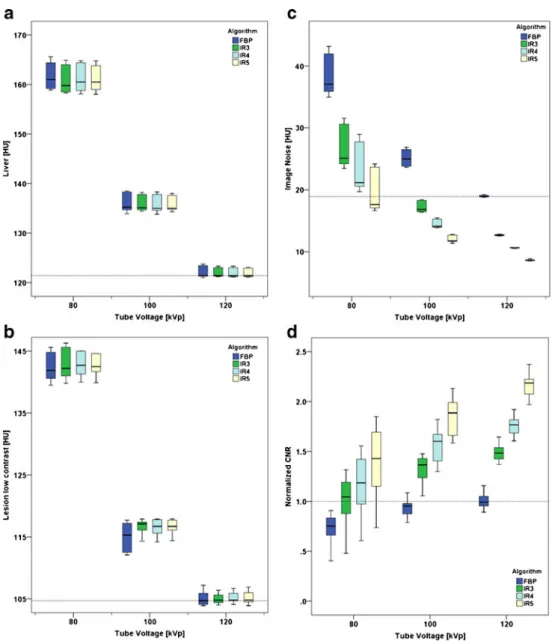
Fig. 2 Liver attenuation values (a), attenuation of low-contrast lesions (b), image noise (c) and normalised contrast-to-noise (CNR) values (d) at different tube voltages and reconstruction algorithms. The dotted lines in each graph represent the values of the standard of reference dataset at 120 kVp reconstructed with FPB. Note the constancy of the CT attenuation values of the liver (a) and lesions (b) across reconstruction algorithms within a tube voltage but higher CT attenuation values at lower tube voltages. On the other hand, note the increase in image noise (c) and CNR (d) across tube voltages and reconstructions
Quantitative CT image analysis
Objective assessment of CT images was performed on transverse images by one radiologist (DBH, with 6 years of experience in abdominal CT) who was not involved in the qualitative CT image readout. Analysis was performed using a picture archiving and communication system (PACS) workstation on a high-definition liquid crystal display monitor (BARCO—Medical Imaging Systems, Kortrijk, Belgium) using Impax (Version 6.4.0.4551; Agfa-Gevaert, Mortsel, Belgium). Circular regions of interest (ROIs) were manually placed in the liver parenchyma (ROI size 1,014 mm2), and a total of nine lesions measuring 15 mm in diameter—three of each conspicuity level—(ROI size 94 mm2) to assess attenuation values in Hounsfield units (HU). The attenuation
value of the liver parenchyma was measured adjacent to each lesion. All measurements were repeated three times in order to ensure consistency and mean values were calculated. Image noise was defined as the standard deviation of the measurements performed in the liver parenchyma. Lesion-to-liver contrast-to-noise ratios (CNRs) were calculated as: CNR¼ ROI liver–ROI lesionð Þ=noise:
Qualitative CT image analysis
Subjective image quality assessment and lesion detection were independently performed by two other radiologists (N.C., reader 1 [R1] and H.A., reader 2 [R2], with 5 and 8 years of experience in abdominal CT respectively). The same PACS station was used on which quantitative assessment was performed. The readers were blinded to the number and location of the lesions, imaging protocol and reconstruction algorithm. Before the readout, each reader was instructed on possible lesion conspicuity levels and lesion sizes as well as image quality scores. The readers marked the location of the lesions on a sheet.
Subjective overall image quality and subjective image noise were assessed per dataset using five-point scales (Table2).
For each lesion, the readers added confidence and lesion contour sharpness scores on five-point scales (Table2).
To minimise recall bias, the 12 datasets were reviewed in three separate reading sessions 4 weeks apart. The datasets were presented in randomised order, with random rotation of the dataset compared with the previous readout, and within each dataset, the slices were presented to the readers in varied order. Readers were allowed to modify the window width and level after the initial presentation with a soft-tissue window preset (window width, 360 HU; window level, 70 HU). Table 3 Quantitative data: liver
attenuation, lesion attenuation and image noise
kVp peak kilovoltage, HU Hounsfield units, SD standard deviation, CNR contrast-to-noise ratio, FBP filtered back projection, IR3 iterative reconstruction strength level 3, IR4 iterative reconstruction strength level 4, IR5 iterative reconstruction strength level 5
kVp Reconstruction Liver Lesion with high contrast Lesion with medium contrast Lesion with low contrast Image noise
(HU) (HU) (HU) (HU) (HU)
mean ± SD mean ± SD mean ± SD mean ± SD mean ± SD
120 FBP 122±1 74±2 92±1 105±1 19±0 IR3 122±1 74±2 92±1 105±1 13±0 IR4 122±1 74±2 92±1 105±1 11±0 IR5 122±1 74±1 92±1 105±1 9±0 100 FBP 136±2 75±1 100±1 115±2 25±1 IR3 136±2 75±1 100±1 116±1 17±1 IR4 136±2 76±1 101±1 116±2 15±1 IR5 136±2 76±1 101±1 117±1 12±1 80 FBP 162±3 80±3 117±2 142±2 38±3 IR3 161±3 81±3 117±2 143±2 27±3 IR4 161±3 81±3 118±2 143±2 23±4 IR5 161±3 81±3 118±2 143±2 20±3
Table 4 Analysis of variance for repeated measures with lesion as the observational unit and among the factors algorithm, lesion size, lesion density, tube voltage, and reader
Confidence as dependent variable
df F P value
Algorithm 3, 874 7 <0.001
Lesion size 2, 34 248 <0.001
Lesion attenuation 2, 34 273 <0.001
kVp 2, 874 60 <0.001
Sharpness as dependent variable
df F P value
Algorithm 3, 874 22 <0.001
Lesion size 2, 34 183 <0.001
Lesion attenuation 2, 34 327 <0.001
kVp 2, 874 54 <0.001
kVp peak kilovoltage, Recon reconstruction, df degrees of freedom, F F-statistic
Statistical analysis
Normal distribution was assessed graphically. Mean values were calculated for the quantitative data as well as confidence and conspicuity scores per dataset.
Univariate analysis of variance was used to test the effects of the reconstruction algorithm and tube voltage on CNR. CNR was normalised to the values of the lesions on the 120-kVp FBP images, representing the reference standard image dataset, using the following formula: CNRn = 1 /
CNR FBP 120 kVp × CNR . Using this normalised CNR
allowed for more intuitive comparisons with the reference standard dataset.
Inter-observer agreement on overall image quality scores, subjective image noise, confidence and contour sharpness was assessed by calculating Kendall’s tau (τ) [25]. Agreement between readers was graded according to Landis and Koch: poor, less than 0.20; fair, 0.21–0.40; moderate, 0.41–0.60; good, 0.61–0.80; very good, 0.81–1.00 [26]. The readers’ marks on the sheets were compared with the actual lesion localisation. True-positive, false-negative and false-positive findings were reported and sensitivity was calculated for each dataset. Sensitivity for the detection of hypodense liver lesions between readers was compared using McNemar’s test. Univariate analysis of variance was used to test the effects of the reconstruction algorithm, tube voltage, lesion size and lesion density on confidence as well as on lesion contour sharpness.
Dunnett’s test [27] was used to compare CNRn, confidence
and sharpness scores between the 100-kVp IR3 and 100-kVp IR4 datasets and the standard of reference (120-kVp FBP). These two datasets were chosen for comparison based on both
readers’ sensitivity for the detection of the liver lesions, being equal to or greater than on the standard of reference images
(see “Results” section below). To address the potential
clustering of repeated measurements within lesions, logistic regression analysis with true positive as a dependent variable, groups (100-kVp IR3, 100-kVp IR4, and standard of reference 120-kVp FBP) as an independent variable and robust standard error with lesion number as a cluster was performed.
Statistical analysis was carried out using commercially available software (SPSS, release 20.0 for Windows; SPSS, Chicago, IL, USA; and Stata 11.2, StataCorp, College Station, TX, USA). A two-tailed P value <0.05 was considered to be statistically significant.
Results
Radiation dose estimation
The estimated radiation dose (CTDIvol) was 26 % lower on
100-kVp images and 56 % lower on 80-kVp images compared with 120-kVp images, despite the higher tube current-time products at lower tube voltages (Table1).
Spatial resolution assessment
Spatial resolution did not differ among datasets and reconstruction algorithms. On each dataset at each tube voltage and each reconstruction algorithm 6.25 line pairs per centimetre were visible.
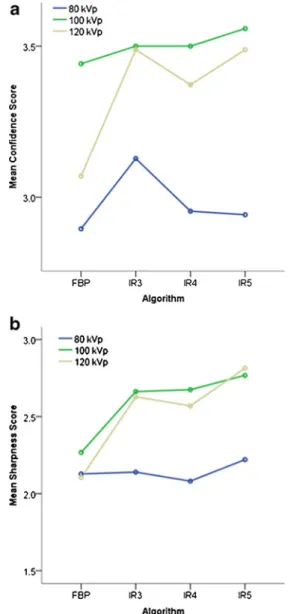
Table 5 Qualitative scores: image quality, image noise, confidence, and sharpness kVp Recon Image quality
R1 Image Noise R1 Confidence R1 Sharpness R1 Image quality R2 Image Noise R2 Confidence R2 Sharpness R2 (overall per dataset) (overall per dataset) (mean ± SD) (mean ± SD) (overall per dataset) (overall
per dataset) (mean ± SD) (mean ± SD) 120 FBP 3 3 3.9±1.3 3.0±1.3 3 2 3.0±1.1 1.8±0.8 120 IR3 4 3 4.1±0.8 3.4±1.2 3 3 3.8±1.0 2.6±1.0 120 IR4 5 4 4.0±0.8 3.2±1.3 3 3 3.8±1.3 2.7±1.1 120 IR5 5 4 4.0±1.2 3.6±1.1 4 4 3.7±1.1 2.7±1.3 100 FBP 2 2 3.7±1.2 2.8±1.3 2 2 4.2±1.0 2.4±0.9 100 IR3 2 2 3.9±1.0 3.1±1.2 3 2 3.9±1.1 2.9±1.1 100 IR4 3 3 4.0±1.0 3.2±1.3 3 3 3.6±1.2 2.7±1.3 100 IR5 4 4 4.0±0.9 3.3±1.3 4 4 4.0±1.0 2.9±1.3 80 FBP 2 1 3.5±0.8 3.0±1.1 1 1 3.4±1.1 2.1±0.9 80 IR3 2 2 4.1±1.1 3.1±1.3 2 1 3.5±1.2 2.1±1.0 80 IR4 3 2 3.8±1.0 2.9±1.1 2 2 3.3±1.2 2.1±1.0 80 IR5 3 3 3.9±0.9 3.3±1.3 3 3 3.4±1.2 2.2±1.1
Quantitative CT image analysis
Liver and lesion attenuation There was no significant difference in liver attenuation between the different reconstruction algorithms for each acquisition (P = 0.96; Fig. 2a). Similarly, there was no significant difference in attenuation of the low (P =0.87), medium (P =0.8) and high (P =0.92) conspicuity lesions. However, with lower tube voltage, attenuation of the liver and the lesions increased (Table3, Fig.2b).
Image noise decreased by 31 %±1.4 % from FBP to IR3, by 42 %±2.2 % from FBP to IR4, and by 52 %±2.6 % from FBP to IR5 for all tube voltages. Compared with the standard of reference (120-kVp FBP), image noise was nearly the same on the 80 kV IR5 dataset and significantly lower on all 100 kV datasets reconstructed with IR (Table3, Fig.2c).
The CNR of lesions of all conspicuity levels increased from FBP to IR3, IR4 and IR5 for each tube voltage level (Fig.2d).
Analysis of variance indicated a significant main effect for both the reconstruction algorithm (P <0.001) and tube voltage (P <0.001) on CNR (Table4). CNRnon 100-kVp IR3 and
100-kVp IR4 images was significantly higher than on standard of reference images (P <0.001).
Qualitative CT image analysis
The inter-observer agreement among readers was good for confidence (τ=0.745), contour sharpness (τ=0.722) and overall image quality (τ=0.668), and very good for subjective image noise scores (τ=0.854).
Subjective overall image quality was highest for R1 on the 120-kVp IR4 and 120-kVp IR5 datasets (score, 5) and for R2 on the 120-kVp IR5 and the 100-kVp IR5 datasets (score, 4) (see Table5, Fig.1).
Subjective image noise scores were lowest for R1 on the 80-kVp FBP dataset and highest on the 120-80-kVp IR4, 120-80-kVp IR5, and the 100-kVp IR5 datasets. R2 rated lowest noise scores on the 80-kVp FBP and 80-kVp IR3 datasets and highest scores on the 120-kVp IR5 and the 100-kVp IR5 datasets (Table5).
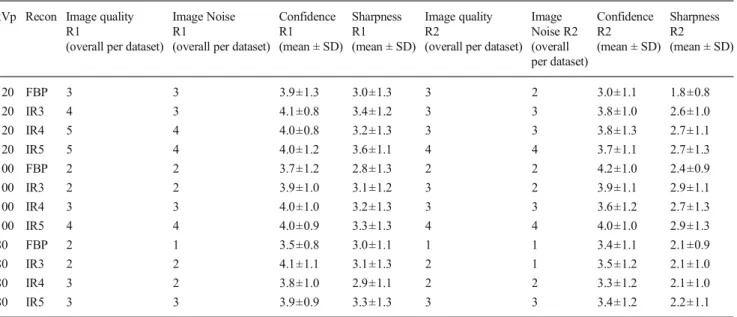
Confidence rated by R1 indicated non-significantly greater confidence on 100-kVp IR3 (P =0.98) and 100-kVp IR4 (P =0.35) images compared with the standard of reference images. R2 had significantly greater confidence on 100-kVp IR3 (P < 0.001) and 100-kVp IR4 (P < 0.001) images compared with the standard of reference (Table5, Fig. 3a). Analysis of variance indicated a significant main effect for the algorithm (P <0.001), tube voltage (P <0.001), lesion size
(P < 0.001), and lesion density (P < 0.001) on confidence (Table5).
Lesion contour sharpness rated by R1 showed similar scores on 100-kVp IR3 and reference standard images (P =0.72) and a non-significantly higher sharpness score on 100 kVp IR4 images (P =0.08) compared with the reference standard. R2 reported significantly higher sharpness scores on 100-kVp IR3 (P < 0.001) and 100-kVp IR4 images (P < 0.001) compared with the standard of reference (Table 5, Fig.3b). Analysis of variance indicates a significant main effect for the algorithm (P <0.001), tube voltage (P <0.001), lesion size (P <0.001), and lesion density (P <0.001) on lesion contour sharpness (Table5).
Fig. 3 Mean confidence (a ) and mean sharpness scores (b) for both readers. Note that mean confidence scores for 100 kVp IR3 and IR4 images are higher than for 120 kVp FBP images. For 80-kVp images, confidence scores are generally lower for all reconstruction algorithms
Detection of liver lesions
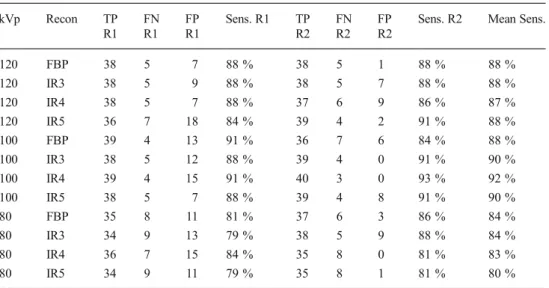
Sensitivity for the detection of hypodense liver lesions ranged from 79 to 91 % for R1 and from 81 to 93 % for R2. The dataset at 100 kVp reconstructed with IR4 yielded the highest sensitivity for both readers (R1, 91 %; R2, 93 %; Table 6), with a similar sensitivity for the detection of hypodense liver lesions among readers. On average, the difference in sensitivity was less than 1 % and agreement between the readers was good (kappa 0.746). Overall, R1 detected 12 lesions that R2 missed, while R2 detected 18 lesions that were missed by R1. Logistic regression did not indicate significant differences among the three selected datasets (100-kVp IR3, 100-kVp IR4 and standard of reference 120-kVp FBP).
Discussion
Our study was driven by the hypothesis that the increased image noise at lower tube voltage introduced by the use of automated attenuation-based tube voltage selection could be counteracted through the application of iterative image reconstruction. Thus, we combined the two methods to determine their value with regard to radiation dose, subjective and objective image quality, and sensitivity for the detection of hypodense liver lesions.
Previous studies have demonstrated that the use of automated attenuation-based tube voltage selection results in a radiation dose reduction of 12–14.5 % in portal venous abdominal CT [11], of 16–25 % in
thoraco-abdominal CT angiography [8, 9], and of 20–31 % in
contrast-enhanced liver CT [10]. Interestingly, all studies mentioned above indicated an increase in image noise of various amounts: 8–22 % for abdominal CT [11], 7–24 %
for thoraco-abdominal CT angiography [8,9], and 4–16 %
for arterial and portal venous CT of the liver [10]. This is intentionally accepted by the algorithm particularly in CT angiography studies, expecting a higher signal from iodine-containing structures when imaged at lower tube voltages being closer to the k-edge of iodine (33 keV), with similar or even higher resulting CNR values.
We found in the intermediate-sized adult phantom that instead of the standard 120-kVp tube voltage, the automated attenuation-based tube voltage selection algorithm selected 100 kVp with the according milliampere-second adjustments (from 210 mAs to 261 mAs). Similar to the studies mentioned above, there was a radiation dose reduction of 26 %, which was paralleled by an increase in image noise of 33 % with FBP images. At this tube voltage level of 100 kVp, however, the CNRs of FBP images were lower than that in the reference standard dataset at 120 kVp. As expected from previous studies [28], attenuation values of both the liver and the lesions increased at lower tube voltage. The higher image noise at lower tube voltage, however, is responsible for lower CNR, despite higher contrast between the liver and the lesion when comparing images reconstructed with the same algorithm. Also, the hypodense liver lesions and the surrounding liver contain only small amounts of iodine, considerably lower than the iodine concentration in arteries during CT angiography.
Various IR techniques from different vendors have been applied to various body regions, such as ASiR and Veo (GE Healthcare, Milwaukee, WI, USA) [12,13,15,
29,30], IRIS and SAFIRE (Siemens) [14,31], iDose and iDose4 (Philips Healthcare, Cleveland, OH, USA) [32], and AIDR and AIDR3D (Toshiba Medical Systems Corporation, Tochigi, Japan) [33]. Kalra et al. [34] showed that attenuation of various tissues did not change when using IR instead of FBP, a result that was also
Table 6 Detection of hypodense liver lesions by the two readers
kVp peak kilovoltage, Recon reconstruction, TP true positive, FN false negative, FP false positive, Sens. sensitivity, R1 reader 1, R2 reader 2, IR3 iterative reconstruction 3, IR4 iterative reconstruction 4, IR5 iterative reconstruction 5
kVp Recon TP FN FP Sens. R1 TP FN FP Sens. R2 Mean Sens.
R1 R1 R1 R2 R2 R2 120 FBP 38 5 7 88 % 38 5 1 88 % 88 % 120 IR3 38 5 9 88 % 38 5 7 88 % 88 % 120 IR4 38 5 7 88 % 37 6 9 86 % 87 % 120 IR5 36 7 18 84 % 39 4 2 91 % 88 % 100 FBP 39 4 13 91 % 36 7 6 84 % 88 % 100 IR3 38 5 12 88 % 39 4 0 91 % 90 % 100 IR4 39 4 15 91 % 40 3 0 93 % 92 % 100 IR5 38 5 7 88 % 39 4 8 91 % 90 % 80 FBP 35 8 11 81 % 37 6 3 86 % 84 % 80 IR3 34 9 13 79 % 38 5 9 88 % 84 % 80 IR4 36 7 15 84 % 35 8 0 81 % 83 % 80 IR5 34 9 11 79 % 35 8 1 81 % 80 %
confirmed in our study showing similar CT attenuation values of both liver parenchyma and hypodense liver lesions. Such stability in CT numbers is important given that attenuation measurements in the liver are used for quantifying the enhancement of lesions and for assessing therapy response to metastases [35].
Several of these IR algorithms have been tested for liver imaging in phantoms and patients, demonstrating a reduction in image noise, and along with this an increase in CNR, eventually allowing for a reduction in radiation dose ranging from 28 to 75 % [7,15,32–34,36,37]. Our results are in line with these studies by similarly showing a reduction in image noise and an improvement in CNR in the IR image datasets at 120 kVp compared with FBP reconstructions, ranging from 33 to 54 %, depending on the strength level of sinogram-affirmed IR used.
The combination of automated attenuation-based tube voltage selection and IR, as demonstrated herein for the first time—to the best of our knowledge—resulted in lower image noise and higher CNR compared with the reference dataset at 120 kVp FBP for both tube voltage levels 100 kVp (IR3-5) and 80 kVp (IR5), and for all three strength levels. Radiation dose was reduced by 26 % and 56 %, respectively, using these tube voltage levels. Moreover, sensitivity for detecting hypodense liver lesions was higher or at least equal for 100 kVp and IR compared with the reference dataset at 120 kVp and FBP, with highest sensitivity for strength level 4. Interestingly, our results regarding the sensitivity of liver lesion detection partly disagree with those from qualitative and quantitative image quality analysis. We purposely chose 80 kVp semi-automatically, which was not automatically recommended by the tube voltage selection algorithm. Even though the quantitative results from IR data at 80 kVp suggested an increased image quality compared with 120-kVp FBP images, sensitivities for lesion detection were lower. We want to emphasise that this indicates that quantitative measurements such as CNR and image noise, as well as qualitative image scores do not necessarily reflect clinical usefulness in terms of lesion detectability. A possible explanation for this result might be the different texture at increasing levels of IR giving rise to an unfamiliar image appearance, potentially masking smaller lesions. This hypothesis is further corroborated by the observation that use of IR with different strength levels did not result in a significant increase in sensitivity for liver lesion detection within the same tube voltage levels.
Baker et al. [31] demonstrated that lower dose acquisitions—through reduction of the tube current-time product—reconstructed with IR resulted in a higher CNR, and that IR improved the detection of low-contrast objects. However, they also reported that the conspicuity of lesion detection depends on the radiation dose level, thereby
showing that at low radiation doses low contrast objects cannot be detected with adequate accuracy with all reconstruction algorithms. Again this is in line with our study results showing lower sensitivity for detecting hypodense liver lesions at 80 kVp compared with 100 kVp and 120 kVp.
Another previous study investigated the IR algorithm IRIS for liver imaging and found that at a 100-kVp tube voltage image quality was improved and radiation dose was reduced by 40 %, while diagnostic accuracy could be maintained compared with a 120-kVp protocol with FBP [38]. In our study, the resulting radiation dose reduction was less pronounced (by only 28 %). This can be explained by the automated increase in tube current with automated attenuation-based tube voltage selection in our study, while the tube current was kept constant while decreasing the tube voltage in the study mentioned above [38]. Moreover, we found an increase in sensitivity in the 100-kVp datasets with IR images. Most importantly, the attenuation-based tube voltage selection algorithm tested herein is automated, meaning that the change in kilovoltage (and tube current) settings is done by the device in accordance with the patient size/scout attenuation, body region imaged and respective indication of the CT study [8–11].
Limitations of this study include the ex vivo study design. A patient setting, however, would not allow for repeated imaging at different tube voltage settings or with exactly the same amount of contrast medium. The phantom also has pre-defined and variable sizes, densities, and numbers of lesions, which can be repeatedly presented to readers in a random fashion. This allows for a comparison of sensitivities for lesion detection at different radiation dose levels and various reconstruction algorithms. Another limitation that has to be mentioned is that all lesions were hypodense. Our results might be different in hyperdense/hypervascular lesions. Only one patient size was simulated. Finally, the phantom only simulates a homogeneous liver in the portal venous phase; it does not model heterogeneous enhancement as it might occur in patients with cirrhosis.
In conclusion, our study indicates that in a phantom simulating an intermediate sized adult patient the combination of automated attenuation-based tube voltage selection at 100 kVp and IR results in higher objective and subjective image quality, higher sensitivity for the detection of simulated hypodense liver lesions, while allowing for a radiation dose reduction of 26 % compared with a standard protocol at 120 kVp and using FBP reconstructions.
Acknowledgments Siemens Healthcare provided partial financial support for developing and purchasing a custom liver phantom that has been used in a previous study [38]. None of the authors has any financial interests with that company, and all authors maintained control of all data presented.
References
1. Berrington de Gonzalez A, Mahesh M, Kim KP et al (2009) Projected cancer risks from computed tomographic scans performed in the United States in 2007. Arch Intern Med 169:2071–2077 2. Brenner DJ, Hall EJ (2007) Computed tomography—an increasing
source of radiation exposure. N Engl J Med 357:2277–2284 3. Kalra MK, Maher MM, Sahani DV et al (2003) Low-dose CT
of the abdomen: evaluation of image improvement with use of noise reduction filters pilot study. Radiology 228:251–256 4. Kalender WA, Buchenau S, Deak P et al (2008) Technical approaches
to the optimisation of CT. Phys Med 24:71–79
5. Christner JA, Zavaletta VA, Eusemann CD, Walz-Flannigan AI, McCollough CH (2010) Dose reduction in helical CT: dynamically adjustable z-axis X-ray beam collimation. AJR Am J Roentgenol 194:W49–W55
6. Bankier AA, Tack D (2010) Dose reduction strategies for thoracic multidetector computed tomography: background, current issues, and recommendations. J Thorac Imaging 25:278–288
7. Marin D, Nelson RC, Schindera ST et al (2010) Low-tube-voltage, high-tube-current multidetector abdominal CT: improved image quality and decreased radiation dose with adaptive statistical iterative reconstruction algorithm-initial clinical experience. Radiology 254: 145–153
8. Winklehner A, Goetti R, Baumueller S et al (2011) Automated attenuation-based tube potential selection for thoracoabdominal computed tomography angiography: improved dose effectiveness. Investig Radiol 46:767–773
9. Goetti R, Winklehner A, Gordic S et al (2012) Automated attenuation-based kilovoltage selection: preliminary observations in patients after endovascular aneurysm repair of the abdominal aorta. AJR Am J Roentgenol 199:W380–W385
10. Lee KH, Lee JM, Moon SK et al (2012) Attenuation-based automatic tube voltage selection and tube current modulation for dose reduction at contrast-enhanced liver CT. Radiology 265:437–447
11. Eller A, May MS, Scharf M et al (2012) Attenuation-based automatic kilovolt selection in abdominal computed tomography: effects on radiation exposure and image quality. Investig Radiol 47:559–565 12. Yamada Y, Jinzaki M, Tanami Y et al (2012) Model-based iterative
reconstruction technique for ultralow-dose computed tomography of the lung: a pilot study. Investig Radiol 47:482–489
13. Prakash P, Kalra MK, Kambadakone AK et al (2010) Reducing abdominal CT radiation dose with adaptive statistical iterative reconstruction technique. Investig Radiol 45:202–210
14. May MS, Wust W, Brand M et al (2011) Dose reduction in abdominal computed tomography: intraindividual comparison of image quality of full-dose standard and half-dose iterative reconstructions with dual-source computed tomography. Investig Radiol 46:465–470
15. Husarik DB, Marin D, Samei E et al (2012) Radiation dose reduction in abdominal computed tomography during the late hepatic arterial phase using a model-based iterative reconstruction algorithm: how low can we go? Investig Radiol 47:468–474
16. Neroladaki A, Botsikas D, Boudabbous S, Becker CD, Montet X (2013) Computed tomography of the chest with model-based iterative reconstruction using a radiation exposure similar to chest X-ray examination: preliminary observations. Eur Radiol 23:360–366 17. Schuhbaeck A, Achenbach S, Layritz C et al (2013) Image quality of
ultra-low radiation exposure coronary CT angiography with an effective dose <0.1 mSv using high-pitch spiral acquisition and raw data-based iterative reconstruction. Eur Radiol 23:597–606 18. Katsura M, Matsuda I, Akahane M et al (2013) Model-based iterative
reconstruction technique for ultralow-dose chest ct: comparison of pulmonary nodule detectability with the adaptive statistical iterative reconstruction technique. Investig Radiol 48:206–212
19. Vardhanabhuti V, Loader R, Roobottom CA (2013) Assessment of image quality on effects of varying tube voltage and automatic tube current modulation with hybrid and pure iterative reconstruction techniques in abdominal/pelvic CT: a phantom study. Investig Radiol 48:167–174
20. Winklehner A, Karlo C, Puippe G et al (2011) Raw data-based iterative reconstruction in body CTA: evaluation of radiation dose saving potential. Eur Radiol 21:2521–2526
21. Suh YJ, Kim YJ, Hong SR et al (2013) Combined use of automatic tube potential selection with tube current modulation and iterative reconstruction technique in coronary CT angiography. Radiology. doi:10.1148/radiol.13130408
22. Menke J (2005) Comparison of different body size parameters for individual dose adaptation in body CT of adults. Radiology 236:565–571 23. Baumueller S, Winklehner A, Karlo C et al (2012) Low-dose CT of the lung: potential value of iterative reconstructions. Eur Radiol 22: 2597–2606
24. Moscariello A, Takx RA, Schoepf UJ et al (2011) Coronary CT angiography: image quality, diagnostic accuracy, and potential for radiation dose reduction using a novel iterative image reconstruction technique-comparison with traditional filtered back projection. Eur Radiol 21:2130–2138
25. Kendall M (1938) A new measure of rank correlation. Biometrika 30: 81–89
26. Landis JR, Koch GG (1977) The measurement of observer agreement for categorical data. Biometrics 33:159–174
27. Dunnett CW (1964) New tables for multiple comparisons with a control. Biometrics 20:482–491
28. Marin D, Nelson RC, Samei E et al (2009) Hypervascular liver tumors: low tube voltage, high tube current multidetector CT during late hepatic arterial phase for detection—initial clinical experience. Radiology 251:771–779
29. Chang W, Lee JM, Lee K et al (2013) Assessment of a model-based, iterative reconstruction algorithm (MBIR) regarding image quality and dose reduction in liver computed tomography. Investig Radiol 48:598–606
30. Marin D, Choudhury KR, Gupta RT et al (2013) Clinical impact of an adaptive statistical iterative reconstruction algorithm for detection of hypervascular liver tumours using a low tube voltage, high tube current MDCT technique. Eur Radiol. doi:10.1007/s00330-013-2964-1
31. Baker ME, Dong F, Primak A et al (2012) Contrast-to-noise ratio and low-contrast object resolution on full- and low-dose MDCT: SAFIRE versus filtered back projection in a low-contrast object phantom and in the liver. AJR Am J Roentgenol 199:8–18 32. Nakaura T, Nakamura S, Maruyama N et al (2012) Low contrast agent
and radiation dose protocol for hepatic dynamic CT of thin adults at 256-detector row CT: effect of low tube voltage and hybrid iterative reconstruction algorithm on image quality. Radiology 264:445–454 33. Namimoto T, Oda S, Utsunomiya D et al (2012) Improvement of
image quality at low-radiation dose and low-contrast material dose abdominal CT in patients with cirrhosis: intraindividual comparison of low tube voltage with iterative reconstruction algorithm and standard tube voltage. J Comput Assist Tomogr 36:495–501
34. Kalra MK, Woisetschlager M, Dahlstrom N et al (2012) Radiation dose reduction with Sinogram Affirmed Iterative Reconstruction technique for abdominal computed tomography. J Comput Assist Tomogr 36:339–346
35. Apfaltrer P, Meyer M, Meier C et al (2012) Contrast-enhanced dual-energy CT of gastrointestinal stromal tumors: is iodine-related attenuation a potential indicator of tumor response? Investig Radiol 47:65–70
36. Hur S, Lee JM, Kim SJ, Park JH, Han JK, Choi BI (2012) 80-kVp CT using Iterative Reconstruction in Image Space algorithm for the detection of hypervascular hepatocellular carcinoma: phantom and initial clinical experience. Korean J Radiol 13:152–164
37. Wang R, Yu W, Wu R et al (2012) Improved image quality in dual-energy abdominal CT: comparison of iterative reconstruction in image space and filtered back projection reconstruction. AJR Am J Roentgenol 199:402–406
38. Schindera ST, Diedrichsen L, Muller HC et al (2011) Iterative reconstruction algorithm for abdominal multidetector CT at different tube voltages: assessment of diagnostic accuracy, image quality, and radiation dose in a phantom study. Radiology 260:454–462