HAL Id: inserm-00607800
https://www.hal.inserm.fr/inserm-00607800
Submitted on 11 Jul 2011
HAL is a multi-disciplinary open access
archive for the deposit and dissemination of
sci-entific research documents, whether they are
pub-lished or not. The documents may come from
teaching and research institutions in France or
abroad, or from public or private research centers.
L’archive ouverte pluridisciplinaire HAL, est
destinée au dépôt et à la diffusion de documents
scientifiques de niveau recherche, publiés ou non,
émanant des établissements d’enseignement et de
recherche français ou étrangers, des laboratoires
publics ou privés.
Automated detection of white matter fiber bundles
Ralph Suarez, Olivier Commowick, Xavier Tomas-Fernandez, Sanjay Prabhu,
Simon Warfield
To cite this version:
Ralph Suarez, Olivier Commowick, Xavier Tomas-Fernandez, Sanjay Prabhu, Simon Warfield.
Au-tomated detection of white matter fiber bundles.
IEEE International Symposium on
Biomedi-cal Imaging: From Nano to Macro, 2011, Apr 2011, Chicago, IL, United States.
pp.845-848,
�10.1109/ISBI.2011.5872536�. �inserm-00607800�
AUTOMATED DETECTION OF WHITE MATTER FIBER TRACTS
Ralph O. Suarez , Olivier Commowick, Xavier Tomas-Fernandez, Sanjay Prabhu,
and Simon K. Warfield
Children’s Hospital of Boston, Harvard Medical School
ABSTRACT
White matter (WM) fiber bundles of the brain can be delineated by diffusion tractography utilizing anatomical regions-of-interest (ROI). These ROIs can specify seed regions in which tract generation algorithms are initiated. Interactive identification of such anatomical ROIs enables the detection of the major WM fiber tracts, but suffers from inter-rater and intra-rater variability, and is time consuming. We developed and compared three techniques for automated delineation of ROIs for the detection of two major WM fiber tracts in 12 healthy subjects. Tracts identified automatically were compared quantitatively to reference standard tracts derived from carefully hand-drawn ROIs. Based on comparative performance of the experimental techniques, a multi-subject label fusion algorithm was found to generate tracts most consistent with the reference standard.
Index Terms— automation, diffusion, tractography, DTI,
fiber segmentation, STAPLE
1. INTRODUCTION
Diffusion imaging is a magnetic resonance imaging (MRI) technique that measures 3D diffusion properties of water molecules in the brain. Because the presence of microstructural barriers to otherwise uniform diffusion gives shape to the orientation diffusion function, inferences can then be made regarding the underlying white matter (WM) microstructure [1-3]. In addition, scalar quantities derived from the diffusion orientation, such as fractional anisotropy and mean diffusivity, have important applications in medicine as these measures reflect regional axon myelination and fiber connectivity characteristics [4]. Many important clinical applications for WM tractography involve the segmentation of specific fiber bundles of interests (as opposed to whole-brain evaluations). For example, presurgical applications typically involve a focused assessment of the major fiber bundles distinctly located within or in the vicinity of the surgical site [5]; evaluation of disease progression in neurodegenerative disorders similarly involves a regional assessment of WM connectivity and axonal integrity, often within the fiber bundles specific to clinical symptoms [4].
A common approach used for the segmentation of important WM pathways initially involves determination of specific sets of regions-of-interest (ROIs) in the subject anatomy. These ROIs are then used for tractography seeding, or as inclusion and/or exclusion regions. To achieve the segmentation of specific WM fiber bundles, a technique currently under wide use involves the manual drawing of tractography seeding ROIs by a trained expert [6-7]. While generally considered to be accurate, this procedure is time-consuming, requires extensive training, and presents opportunity for human fatigue, error, or inter-rater variability to impact the segmentation outcome. As such, the atomization of WM fiber bundle segmentation is a topic that is increasingly addressed in the literature [7-9].
In this article, we present a comparative study of three experimental methodologies which we designed for automated segmentation of the corpus callosum and corticospinal WM tracts in individual subject anatomies. Tractography segmentations obtained by the experimental methods are compared against reference standard segmentations derived from manual placement of seeding ROIs by a trained expert, and are judged based on the root-mean-square difference between the resulting probabilistic tract density images. Based on our findings in this study, we recommend an automated algorithm derived from the Simultaneous Truth and Performance Level Estimation framework (STAPLE) [10].
One should note, however, that our study does not address other important questions still under research in the field, such as, determination of the most robust algorithms for either WM fiber tractography or for nonrigid subject-to-subject anatomical registration. Accordingly, we recognize that more advanced tractography and/or nonrigid alignment algorithms may be implemented with our automated fiber segmentation procedure in the future.
2. MATERIALS AND METHODS 2.1. Subjects
We enrolled an age-matched study group made up of 12 young volunteers (mean age: 16.8 yrs, SD: 1.1 yrs), with no history of neurobiological disorders; 5 were male and 7 female. In compliance with Institutional Review Board (IRB) guidelines, institutional study approval, and signed individual participant consent forms were obtained.
2.2. MR Imaging
All of the study participants underwent MRI scanning at three Tesla (3T) using a Magnetom Trio scanner (Siemens, USA) to obtain high-quality T1-weighted anatomical and diffusion tensor images. Anatomical images:
High-resolution 3D Magnetization Prepared Rapid Acquisition Gradient Echo (MPRAGE) T1-weighted images were obtained using a 32-channel head coil; we used a 24cm FOV, 1.0mm contiguous slice thickness, sagittal slices covering the entire head, TR/TE=1410ms/2.27ms, matrix 256x256, TI=800 ms, and a flip angle=9o.Diffusion images:
High spatial resolution diffusion weighted tensor images (DTI) were acquired using 30 directions and 5 baselines, B value=1000; we used isotropic 2x2x2 mm3 voxels (24cm
FOV, matrix 128x128, 2mm thick contiguous slices covering the entire brain). In order to minimize eddy current distortion, a double balanced gradient scheme was applied. To achieve the smallest possible TE in order to minimize geometric distortion and signal loss, a parallel acquisition with an acceleration factor of 2 was used with a 32-channel head coil.
2.3. Reference standard ROI placement
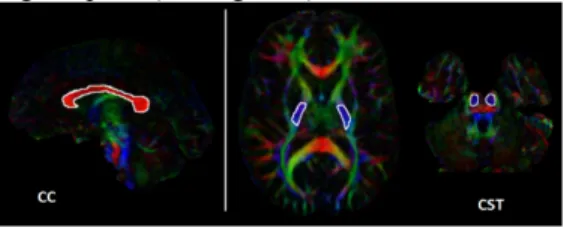
We evaluated the capability of automatically reproducing corpus callosum (CC) and corticospinal tract (CST) fiber bundle segmentations in all of the study volunteers. Initially, CC and CST seeding ROIs were manually draw directly on the particular subject’s red, green, and blue (RGB) color-coded images representing local tensor orientation [11]. For delineation of the CC fiber bundle, one ROI was drawn encompassing approximately the 5 central sagittal slices outlining the RGB red-colored lateral radiations of the corpus callosum [12]. The CST bundle was based on two seeding ROIs: 1) approximately four axial slices of the blue-purple colored inferior-to-superior radiations of the posterior limb of the internal capsule, and 2) approximately four axial slices the blue-purple radiations of the corticospinal tracts traversing the pons (see Figure 1).
Fig. 1. Hand-draw seeding ROIs (white) overlaid on the RGB image of a representative study participant. Left panel: a single seeding ROI drawn for tract generation of the corpus callosum
(CC). Right panel: depiction of two ROIs used for tract generation
of corticospinal tract (CST): the posterior limb of the internal capsule and the inferior-superior radiations of the pons.
2.4. Tractography
We applied a previously unreported single tensor tractography scheme which we configured in order to merge log-Euclidean tensor interpolation [13], combined tensor
deflection [14], and primary eigenvector trajectory orientation to stochastically identify highly oriented trajectories in diffusion tensor volumes. All of our fiber bundle segmentations were determined based on an ROI seeding strategy which made no requirement for exclusion regions. Standard criteria of low fractional anisotropy and rapid trajectory angle changes were used to terminate unrealistic trajectories [10]. Prior to tractography, each subject’s diffusion images were rigidly registered and re-sampled in order to match their T1-weighted anatomical volumes.
2.5. Automated methods
We designed three experimental methods for automated projection of manually drawn seeding ROIs from a reference template anatomy onto individual subject anatomies of interest. These transformations are based on nonrigid alignment of skull-stripped, T1-weighted grayscale images. The nonrigid alignment algorithm we used applies a block matching approach together with a local correlation coefficient as the similarity measure, and features an innovative outlier rejection scheme which effectively rejects local pairings that disagree completely with the rest of the transformation [15-16]. The resulting deformation fields from nonrigid alignment of T1-weighted images are subsequently applied to manually drawn ROI volumes, in effect projecting them onto that subject’s diffusion image for subsequent tractography generation. The automated methods we designed are defined as follows:
1) Single-subject projection: we tested the procedure of projecting hand-drawn seeding ROIs from a single template anatomy onto the subject anatomy of interest. To test the reliability of this approach, we performed 11 similar experiments for each of the 12 study participant (leave-one-out). We refer to the single-subject projection method as SSproj from this point forward.
2) Atlas projection: this procedure is based on projecting atlas-drawn template seeding ROIs onto the subject anatomy of interest. These projections were done based on nonrigid alignment of the atlas and the T1-weighted subject anatomy. Atlases were generated by first performing nonrigid alignment of 11 individual skull-stripped, T1-weighted subject anatomies (leave-one-out), followed by computation of an average T1-weighted volume. Deformation fields determined from the alignment of T1-weighted images were then applied to the corresponding diffusion images, similarly aligning all diffusion images for computation of an average diffusion volume. In this way, we created geometrically unbiased RGB and T1-weighted atlases, for manual placement of seeding ROIs and subsequent atlas-to-subject alignments, respectively. We refer to this atlas projection method as Atlsproj from this point forward.
3) ROI label map consensus: this automated procedure is based on the determination of a local consensus ROI region in the subject anatomy. Initially, we project manually drawn seeding ROIs from 11 template anatomies onto the subject of interest, where we then perform a label map consensus analysis based on the STAPLE framework [10]. STAPLE statistical evaluation of the underlying consensus across individually projected template ROIs consequently results in a subject-specific region which we designate as that subject’s tractography seeding ROI. We refer to the ROI map consensus method as MPcns from this point forward. 2.6. Comparative evaluation of experimental results Fiber bundle segmentations derived from each of the experimental methods were judged based on how similar the resulting probabilistic tract density images were to those generated by manually drawn ROIs in the same subject. Voxel values in probabilistic tract density images were determined based on the number of fiber trajectories traversing each voxel, divided by the total number of trajectories in the entire volume. As such, these images simultaneously quantify both the spatial extent, and also the density of the 3D fiber bundles produced by the tractography (see Figure 2). We use the root-mean-squared (RMS) difference between these images as quantitative measure of tract segmentation error. It follows that tract density images demonstrating perfect correspondence to the reference standard will yield RMS error equal to zero. This metric is comparable to Jaccard’s Similarity Index, but offers the advantage of accounting for continuous intensity mismatch, in addition to the binary overlap.
Fig. 2. Probabilistic tract density images of the corpus callosum
(CC) and the corticospinal tract (CST) in a representative study
participant.
3. RESULTS 3.1. Group-level results
CC segmentation outcomes: the lowest mean RMS error in
the study group was observed for MPcns (Mean: 3.25E-5, SD: 0.61E-5); the second lowest error was observed for Atlsproj (Mean: 4.14E-5, SD: 0.71E-5); the highest RMS error was observed for SSproj (4.24E-5, 0.87E-5). ANOVA analysis revealed no statistically significant difference in the mean RMS error across all of the experimental methods we tested.
CST segmentation outcomes: CST segmentations generally
yielded higher mean RMS error than was observed for CC
(approximately one order of magnitude greater); this was true across all of the methods we tested. The lowest error we observed was for MPcns (10.01E-5, 1.49E-5); the second lowest for SSproj (12.44E-5, 2.16E-5); and the highest RMS error was observed for Atlsproj (14.51E-5, 2.36E-5). ANOVA analysis revealed no statistically significant difference in the mean RMS error across all of the experimental methods we tested.
3.2. Subject-level results
All three of the automated segmentation methods we designed were able to delineate CC and CST fiber bundles in 12 out of the 12 study participants, Jaccard’s Similarly Indices of 0.49 or greater in every case. The resulting fiber bundles generally differed however, as was reflected in the calculated values of RMS error, and 3D visualizations (see Figure 3).
Fig. 3. Comparison of 3D subject tractography results for CC (top
row) and CST (bottom row). Left panel: reference standard fiber
bundles from manually drawn seeding ROIs. Right panel: fiber bundles generated from automated SSproj, Atlsproj, and MPcns methodologies on the same representative subject.
CC segmentation outcomes: MPcns resulted in the lowest
RMS error, in 11 out of 12 subjects; the second lowest error was observed for Atlsproj, in 5 out of 12 subjects; the highest error was observed for SSproj, in 6 of 12 subjects (see Figure 4).
CST segmentation outcomes: MPcns yielded the lowest
error in 12 out of 12 subjects; the second lowest error was observed for SSproj, in 12 out of 12 subjects; the highest RMS error was observed for Atlsproj, in 12 out of 12 subjects (see Figure 4).
Fig. 4. RMS error in corpus callosum (CC) (top panel) and corticospinal tract segmentations (CST) (lower panel) as a function of subject of interest, error bars represent the standard deviation in the mean RMS error from SSproj. Notice that the lowest RMS error was in every case obtained by the Mpcns procedure.
4. DISCUSSION
We designed and tested three algorithms for automated segmentation of CC and CST WM fiber bundles. Our goal was to evaluate the feasibility of reproducing reference standard segmentations derived from the manual drawing of
seeding ROIs by a trained expert. Performance of the automatic methods was quantified by computing the RMS difference in the resulting probabilistic tract density images. All three of the proposed methods were able to reproduce CC and CST, in 12 out of 12 subjects, and all generally yielded comparable segmentation outcomes in group-level assessment. However, we demonstrated lower error from the MPcns procedure in every case we tested. Based on these findings, we recommend our Simultaneous Truth and Performance Level Estimation (STAPLE) procedure for the reliable automation of WM fiber bundle segmentation. The results we presented should be viewed relative to important limitations of our study. The main limitation derives from the lack of a true validation method. Our findings were based exclusively on the ability to reproduce fiber segmentations derived from manually drawn ROIs; however, it is not clear how accurate this reference standard should be considered. Furthermore, our study was done with healthy volunteers; therefore, it remains to be seen how the recommended automated methods will perform in patient populations suffering from structural abnormalities.
In this study, we performed nonrigid alignments based on the T1-weighted modality; we note that other modalities should be evaluated in future work. In particular, increased reliability may be achieved by nonrigid aliments based on fractional anisotropy, mean diffusivity, or full tensor volumes. Additionally, a more exhaustive list of prominent WM fiber bundles should be explored in future study, including: the cingulum bundle, the optical radiation tracts, and the arcuate fasciculus.
5. REFERENCES
1. Conturo, T. E., N. F. Lori, et al. (1999). Tracking neuronal fiber pathways in the living human brain. Proc Natl Acad Sci U S A 96(18): 10422-10427.
2. Westin, C. F., S. E. Maier, et al. (2002). Processing and visualization for diffusion tensor MRI. Med Image Anal 6(2): 93-108.
3. Mori, S., W. E. Kaufmann, et al. (2002). Imaging cortical association tracts in the human brain using diffusion-tensor-based axonal tracking. Magn Reson Med 47(2): 215-223. 4. Goldberg-Zimring, D., A. U. Mewes, et al. (2005). Diffusion
tensor magnetic resonance imaging in multiple sclerosis. J Neuroimaging 15(4 Suppl): 68S-81S.
5. Yogarajah, M., N. K. Focke, et al. (2009). Defining Meyer's loop-temporal lobe resections, visual field deficits and diffusion tensor tractography. Brain 132(Pt 6): 1656-1668. 6. Wakana, S., H. Jiang, et al. (2004). Fiber tract-based atlas of
human white matter anatomy. Radiology 230(1): 77-87. 7. Van Hecke W, Leemans A, Sijbers J, Vandervliet E, Van
Goethem J, Parizel PM. (2008). A tracking-based diffusion tensor imaging segmentation method for the detection of diffusion-related changes of the cervical spinal cord with aging. J Magn Reson Imaging. May;27(5):978-91.
8. Hua K, Zhang J, Wakana S, Jiang H, Li X, Reich DS, Calabresi PA, Pekar JJ, van Zijl PC, Mori S. (2008). Tract probability maps in stereotaxic spaces: analyses of white matter anatomy and tract-specific quantification. Neuroimage. Jan 1;39(1):336-47.
9. Zhang W, Olivi A, Hertig SJ, van Zijl P, Mori S. (2008). Automated fiber tracking of human brain white matter using diffusion tensor imaging. Neuroimage. Aug 15;42(2):771-7. 10. Warfield SK, Zou KH, Wells WM. (2004). Simultaneous
truth and performance level estimation (STAPLE): an algorithm for the validation of image segmentation. IEEE Trans Med Imaging. Jul;23(7):903-21.
11. Douek, P., R. Turner, et al. (1991). MR color mapping of myelin fiber orientation. J Comput Assist Tomogr 15(6): 923-929.
12. Catani, M and Michel Thiebaut de Schotten. (2008). A diffusion tensor imaging tractorgrphy atals for vitual in vivo dissections. Cortex. 44 1105-1132.
13. Arsigny, V., P. Fillard. (2006). Log-Euclidean metrics for fast and simple calculus on diffusion tensors. Magn Reson Med 56(2): 411-421.
14. Lazar, M., D. M. Weinstein. (2003). White matter tractography using diffusion tensor deflection. Hum Brain Mapp 18(4): 306-321.
15. Commowick, Olivier; Title: Création et Utilisation d'Atlas Anatomiques Numériques pour la Radiothérapie (Design and Use of Anatomical Atlases for Radiotherapy); School: Université de Nice-Sophia-Antipolis; Year: (2007)
16. Garcia V.; Commowick O., and Malandain G. (2010). A robust and efficient block-matching framework for non-linear registration of thoracic images. In Proceedings of A Grand Challenge on Pulmonary Image Registration (EMPIRE'10), held in conjunction with MICCAI'10, September 2010