Control Strategy for Hydrocarbon Emissions in
Turbocharged Direct Injection Spark Ignition
Engines During Cold-Start
A.SACHUTi'TSiNST TUTE
by
Kevin David Cedrone
B.A.Sc., Honours Mechanical Engineering
University of Waterloo (2008)
S.M., Mechanical Engineering
Massachusetts Institute of Technology (2010)
Submitted to the Department of Mechanical Engineering
in partial fulfillment of the requirements for the degree of
Doctor of Philosophy in Mechanical Engineering
at the
MASSACHUSETTS INSTITUTE OF TECHNOLOGY
June 2013
( Massachusetts Institute of Technology 2013. All rights reserved.
Author ...
...
.
...
...
Department of Mechanical Engineering
March 18, 2013
Certified by ...
.. ...
Wai K. Cheng
Prossor of Mechanical Engineering
/
Supervisor
A ccepted by ...
...
David Hardt, Professor of Mechanical Engineering
Chairman, Department Committee on Graduate Theses
Control Strategy for Hydrocarbon Emissions in
Turbocharged Direct Injection Spark Ignition Engines
During Cold-Start
by
Kevin David Cedrone
Submitted to the Department of Mechanical Engineering on March 18, 2013, in partial fulfillment of the
requirements for the degree of
Doctor of Philosophy in Mechanical Engineering
Abstract
Gasoline consumption and pollutant emissions from transportation are costly and have serious, demonstrated environmental and health impacts. Downsized, tur-bocharged direct-injection spark ignition (DISI) gasoline engines consume less fuel
and achieve superior performance compared with conventional port fuel injected spark ignition (PFI-SI) engines. Although more efficient, turbocharged DISI engines have new emissions challenges during cold start. DISI fuel injection delivers more liquid fuel into the combustion chamber, increasing the emissions of unburned hydrocar-bons. The turbocharger slows down activation (warm-up) of the catalytic exhaust after-treatment system. The objective of this research is to find a control strategy that:
1. Accelerates warm-up of the catalyst, and
2. Maintains low emissions of unburned hydrocarbons (UBHCs) during the cata-lyst warm-up process.
This research includes a broad experimental survey of engine behaviour and emission response for a modern turbocharged DISI engine. The study focuses on the idle pe-riod during cold-start for which DISI engine emissions are worst.
Engine experiments and simulations show that late and slow combustion lead to high exhaust gas temperatures and mass flow rate for fast warm-up. However, late and slow combustion increase the risk of partial-burn misfire. At the misfire limit for each parameter, the following conclusions are drawn:
1. Late ignition timing is the most effective way to increase exhaust enthalpy flow
rate for fast catalyst warm-up.
2. By creating a favourable spatial fuel-air mixture stratification, split fuel injec-tion can simultaneously retard and stabilize combusinjec-tion to improve emissions
3. Excessive trapped residuals from long valve overlap limit the potential for valve
timing to reduce cold-start emissions.
4. Despite their more challenging evaporation characteristics, fuel blends with high ethanol content showed reasonable emissions behaviour and greater tolerance to late combustion than neat gasoline.
5. Higher exhaust back-pressure leads to high exhaust temperature during the
exhaust stroke, leading to significantly more post-flame oxidation.
6. Post-flame oxidation in the combustion chamber and exhaust system play a
crit-ical role in decreasing the quantity of catalyst-in emissions due to hydrocarbons that escape primary (flame) combustion.
A cold start strategy combining late ignition, 15% excess air, and high exhaust
back-pressure yielded the lowest cumulative hydrocarbon emissions during cold start.
Thesis Supervisor: Wai K. Cheng
Acknowledgements
At the conclusion of my doctoral studies I have but one page to thank everyone who helped me during this long and sometimes lonely process. Verily, one page is insuffi-cient to express the full measure of my gratitude, but here goes.
Thank you to my thesis committee. I am deeply grateful to my advisor and committee chair Professor Wai K. Cheng. Thank you for your efforts in the lab and classroom, for the freedom, opportunity and encouragement to develop my own research ideas. You taught me how to tackle even the most complicated results methodically, crit-ically and objectively. Thank you Professor John B. Heywood, Profssor Ahmed F. Ghoniem and Professor Patrick Kirchen. I have learned a great deal from the research experience you shared. Your guidance has been incredibly valuable to me and I am a better scientist and engineer because of your efforts.
Along with every mechanical engineering graduate student at MIT, I owe Leslie Re-gan, Joan Kravit and Una Sheehan in the Mechanical Engineering Graduate Office a debt of gratitude for their behind-the-scenes administrative magic. Thank you.
I would like to thank the members of the Engine and Fuels Research Consortium,
Borg-Warner, Chrysler, Ford Motor Company and General Motors, who sponsored this research. Special thanks to Rick Davis and Ron Herrin at GM, and Tom Leone at Ford for sharing their time and expertise.
Thanks to past and present Sloan Automotive Lab students for making the lab a fun place over the years. Thanks to the SAL staff, notably Janet Maslow for day-to-day operations and Raymond Phan for fast and reliable fabrication. Thanks to Sareena Avadhany and Tomas Vianna Martins, who helped with this project as undergradu-ates. Special thanks to Alex Sappok, Eric "The Shelf" Senzer, Emmanuel Kasseris, Justin Ketterer and Jake McKenzie for always making time to spit-ball research ideas, lend a hand and offer moral support while I pushed myself and my engine to the limit. Thanks to my fellow graduate students Sam Crawford, David Fenning, Andrej Lenert, Tom Ober and Bill Polacheck for laughs going back to that first reg. day at the Muddy.
I owe special thanks to Wayne Staats, and Renee and Joe Sullivan for always making
time to share homebrew beer, coffee, trivia and advice on research, quals and life. Thanks to my parents Laurie and Nino, my siblings Laura and Steve, The Kilians, Chris Beneteau, Chris Carignan, Ian Cromwell, Gerardo Salas and the rest of my fam-ily and friends. Thank you for boundless support and encouragement which helped me get to and through MIT.
My deepest gratitude of all goes to Meaghan Kilian whose love and support helped
make this possible. MIT and science are my occasional mistress, but Meaghan is the one true love of my life.
I
CONTENTS
A bstract . . . . 4 Acknowledgements . . . . 5 List of Figures . . . . 11 List of Tables . . . . 13 Nomenclature . . . . 15 1 Introduction . . . . 19 1.1 Research Objective . . . . 21 1.2 Background . . . . 21 1.3 Research Methodology . . . . 262 Hydrocarbon emissions during cold start . . . . 29
2.1 Hydrocarbon sources . . . . 30
2.2 Desirable characteristics during cold-start . . . . 32
2.3 Engine operating parameters. . . . . 38
2.4 Literature review . . . .. . . . . 52
2.5 Predicted engine response . . . . 62
3 Experimental results . . . . .. . . . . 81
3.1 Ignition Timing . . . . 81
3.2 Equivalence Ratio. . . .. . . . . 84
3.3 Variable Valve Timing .. . . . . 87
3.4 Exhaust Back Pressure . . . . 91
3.5 Fuel Injection Schedule .. . . . . 109
3.6 Fuel ethanol content ... ... 115
4 Exhaust System and Catalyst Models . . . . 121 4.1 Strategy . . . . 121 4.2 Models . . . . 122 4.3 Results . . . . 131 5 Conclusions . . . 141 5.1 Summary . . . 141 5.2 Findings . . . 142
5.3 Recommendations and Future Work . . . 146
Appendices . . . 149
Appendix A Experimental Setup and Protocol . . . 151
A.1 Experimental Setup . . . 152
A.2 Data post-processing . . . 167
A.3 Engine test preparation . . . 172
A.4 Experiment Protocol . . . 176
A.5 Cold-idle operating point specification . . . 177
A.6 Data collection frequency . . . 177
A.7 Shutdown procedure . . . . 177
A.8 Other engine procedures . . ... . . . . 178
Appendix B Test fuel properties . . . 183
I
_LIST OF FIGURES
Fig. 1-1 Schematic of cold-start goals . . . . 20
Fig. 1-2 Select EPA Light duty vehicle emissions limits . . . . 23
Fig. 1-3 Example of DI and PFI fuel spray pattern . . . . 25
Fig. 1-4 Engine startup process . . . . 27
Fig. 2-1 Two cycles of cylinder pressure with engine event labels . . . . . 40
Fig. 2-2 Schematic relationship between ignition timing and qi,g . . . . . 41
Fig. 2-3 Schematic relationship between Texh and mHC . . . . -... 42
Fig. 2-4 Schematic uncertainty in net effect of ignition timing on mHC - - 43
Fig. 2-5 Piston bowl geometry for fuel spray control . . . . 49
Fig. 2-6 Prediction of exhaust gas mass flow rate vs. ignition timing . . . 63
Fig. 2-7 Prediction of exhaust gas temperature vs. ignition timing . . . . 64
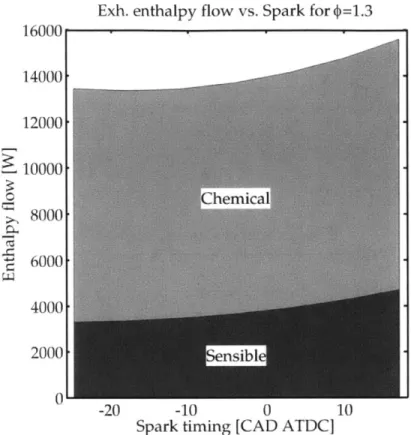
Fig. 2-8 Predicted chemical and sensible enthalpy flow rates at D=1.1. 66 Fig. 2-9 Predicted chemical and sensible enthalpy flow rates at D=1.3 67 Fig. 2-10 Prediction of Texh vs. ignition timing for different 1 . . . . 68
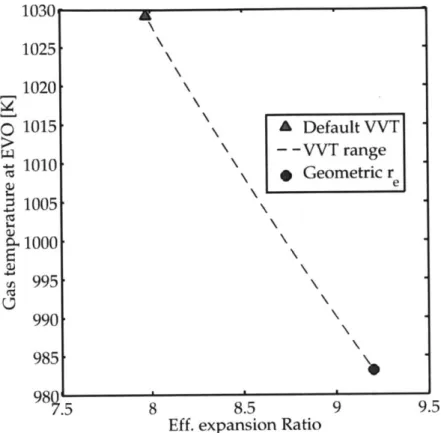
Fig. 2-11 Effect of intake cam phaser advance on effective compression ratio 69 Fig. 2-12 Effect of intake cam phaser advance on compression temperature 70 Fig. 2-13 Effect of residual gas fraction on initial mixture temperature . 71 Fig. 2-14 Effect of residual gas fraction on mixture temperature at TDC 72 Fig. 2-15 Effect of exhaust cam phaser retard on effective expansion ratio . 73 Fig. 2-16 Effect of exhaust cam phaser retard on gas temperature at EVO 74 Fig. 2-17 Effect of residuals on gas temperature at EVO . . . . 75
Fig. 2-18 Combustion chamber pressure and volume, plotted in log-log . . 76
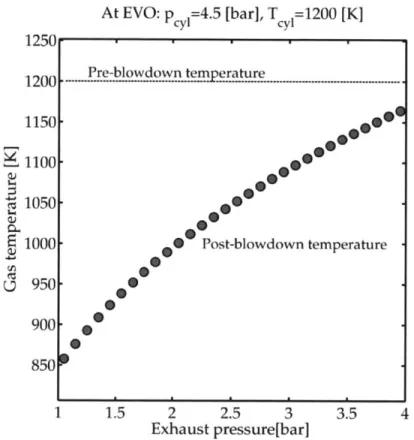
Fig. 2-19 Effect of exhaust restriction on post-blowdown temperatures . . 78
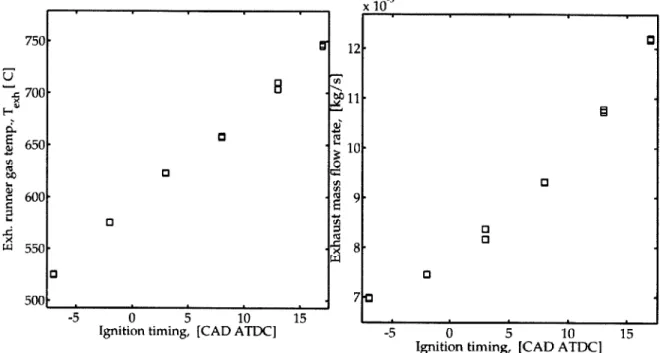
Fig. 2-20 Predicted exhaust thermal transient response with turbocharger 80 Fig. 2-21 Predicted exhaust thermal transient response with no turbocharger 80 Fig. 3-1 Exhaust gas temperature and mass flow rate vs. ignition timing 82 Fig. 3-2 HC concentration and net HC mass flow rate vs. ignition timing 83 Fig. 3-3 COV(GIMEP) vs. ignition timing . . . . 83
Fig. 3-5 COV(GIMEP) and Texh vs. ignition timing and <D . . . . Fig. 3-6 Flow rate of hydrocarbons and enthalpy vs. ignition timing and <D Fig. 3-7 Contours of valve overlap as a function of cam phaser timing . . Fig. 3-8 Combustion phasing and manifold pressure vs. valve timing . . . Fig. 3-9 Hydrocarbon concentration and mass flow rate vs. valve timing . Fig. 3-10 VVT contours of COV(GIMEP) and exhaust thermal enthalpy Fig. 3-11 PV diagram for normal and high exhaust back pressure cases . Fig. 3-12 Exhaust gas temperature and mass flow rate vs. exhaust pressure Fig. 3-13 Exhaust and intake manifold pressures vs. spark . . . . Fig. 3-14 Exhaust back pressure effect on PIMEP vs. spark . . . . Fig. 3-15 Exhaust back pressure effect on residual gas fraction and back-flow Fig. 3-16 Exhaust back pressure effect on combustion phasing and duration Fig. 3-17 Exhaust back pressure effect on HC concentration and mass flow
rate . . . . Fig. 3-18 Exhaust back pressure effect on cycle-to-cycle variation . . . . . Fig. 3-19 Exhaust back pressure effect on thermal enthalpy flow rate . . .
Fig. 3-20 Effect of ignition timing on mixture temperature profile . . . . . Fig. 3-21 Effect of ignition timing on exhaust gas temperature . . . . Fig. 3-22 Effect of ignition timing and back pressure on mixture
tempera-ture profile . . . . Fig. 3-23 Effect of back pressure on exhaust and burned gas temperatures Fig. 3-24 Effect of equivalence ratio on exhaust temperature at constant load Fig. 3-25 Exhaust back pressure effect on exhaust gas temperature at
dif-ferent equivalence ratios . . . . Fig. 3-26 Exhaust back pressure effect on post-flame oxidation of CO and
HC... ...
Fig. 3-27 Exhaust back pressure effect on CCV and hydrocarbon mass flow rate . . . . Fig. 3-28 Combustion inefficiency comparison late ignition experiments and
different <D . . . . Fig. 3-29 Combustion inefficiency comparison for lean mixtures . . . . Fig. 3-30 Effect of equivalence ratio on COV of GIMEP at constant load. . Fig. 3-31 Effect of S012 on combustion phasing, duration . . . . Fig. 3-32 Effect of S012 on combustion exhaust gas temperature and mass flow rate . . . . Fig. 3-33 Effect of secondary injection timing on COV of GIMEP. . . . . . Fig. 3-34 Effect of S012 on emissions . . . . Fig. 3-35 Effect of 60/40 split ratio on CCV and hydrocarbon emissions Fig. 3-36 Effect of 80/20 split ratio on CCV and hydrocarbon emissions Fig. 3-37 CA50 and BD1090 vs S012 for EO and E85 fuel blends . . . . . Fig. 3-38 Exhaust gas temperature and hydrocarbon mass flow rate for EO and E85 fuel blends . . . . Fig. 3-39 Effect of fuel pressure on emission rate of unburned hydrocarbons Fig. 3-40 Transient thermal response with waste-gate open and closed . .
85 86 87 88 89 90 91 92 93 94 95 96 97 97 98 99 100 101 102 103 104 105 106 106 107 108 110 111 112 113 114 114 116 116 117 119
Fig. 4-1 GT-POWER Model of Ecotec LNF Engine ... 123
Fig. 4-2 GT-POWER Model of exhaust system. . . . . 126
Fig. 4-3 Transient warm-up experiment to tune exhaust model . . . . 127
Fig. 4-4 Measurement error due to thermocouple transient . . . . 128
Fig. 4-5 GT-POWER kinetic and 1-D flow model of catalytic converter. . 129 Fig. 4-6 Axial temperature in catalyst at t=120s . . . . 132
Fig. 4-7 Transient development of propene reaction rate in the catalyst 133 Fig. 4-8 Comparison of thermal and HC-conversion light-off criteria . . . 134
Fig. 4-9 Cumulative emissions vs Texh and mHC .. . . . .. . . . . .. 136
Fig. 4-10 Predicted emissions during catalyst warm-up . . . . 137
Fig. 4-11 Cumulative HC emissions and light-off time predictions . . . . . 138
Fig. 4-12 Effect of exhaust back pressure on HC emissions . . . . 139
Fig. 4-13 Effect of exhaust back pressure on fuel consumption . . . . 140
Fig. A-1 Default camshaft phaser position . . . . 154
Fig. A-2 Full travel camshaft phaser position . . . . 154
Fig. A-3 Intake and exhaust system schematic . . . . 156
Fig. A-4 Fuel system schematic . . . . 157
Fig. A-5 Direct injection peak and hold injector current profile . . . . 158
Fig. A-6 Sensor locations . . . . 162
Fig. A-7 PV diagrams of early and late combustion timing in log-log scale 169 Fig. A-8 Comparison of Rassweiler-Withrow and First Law combustion heat release analyses. . . . . 172
Fig. A-9 Comparison of CA50 and angle of maximum rate of combustion heat release . . . . 173 Fig. A-10 Fuel mass fraction burn curve for ignition timing +11 CAD ATDC 174
LIST OF TABLES
Sensitivity Analysis . . . .
LNF engine layout and geometry information . . .
Basic valve timing and lift (cam phasers inactive) .
DAQ sensor details. . . . .
Cold-idle operating point specification . . . .
Typical data collection quantity and frequency . .
. . . . 138 . . . ... 153 . . . . 155 . . . . 161 . . . . 177 . . . . 178 Table 4.1 Table A.1 Table A.2 Table A.3 Table A.4 Table A.5
I
NOMENCLATURE
Symbols
Symbol Units Description
i7comb - Combustion efficiency, fraction of fuel that fully combusts
?7ig - Indicated gross fuel conversion efficiency; ratio of indicated gross work to fuel energy
nV - Volumetric efficiency
A - Air-fuel equivalence ratio (1/D)
<D - Fuel-air equivalence ratio (1/A)
AFst - Stoichiometric air-fuel ratio
ma kg Air mass
mf kg Fuel mass
Abbreviations
Abbrev. Description
ABDC After bottom dead centre AFR Air fuel ratio
ATDC After top dead centre
BD1090 Burn duration in crank angles between 10% and 90% of total heat release
BTDC Before top dead centre
CA50 Crank angle at 50% of total heat release
CAD Crank angle degree
CC Catalytic Converter
CCV Cycle to cycle variability
CO Carbon monoxide
C02 Carbon dioxide
COV Coefficient of Variation (stddev/mean)
EVC Exhaust Valve Closing
EVO Exhaust Valve Opening
Exh Exhaust
FTP (EPA) Federal Test Procedure
GIMEP Gross Indicated Mean Effective Pressure
HC Hydrocarbon
HR1090 See BD1090
Ign Ignition, or spark
Inj Injection; namely fuel
Int Intake
IVC Intake Valve Closing
IVO Intake Valve Opening
LNV Lowest Normalized Value (min/mean)
MBT Maximum Brake Torque
NEDC New European Drive Cycle
NIMEP Net Indicated Mean Effective Pressure
NOx Oxides of nitrogen including NO and NO 2
NVH Noise Vibrations and Harshness
NVO Negative Valve Overlap
PGM Platinum Group Metal
PIMEP Pumping Indicated Mean Effective Pressure
PMEP See PIMEP
RGF Residual Gas Fraction
SoI Start of Injection
SAI Secondary Air Injection
UBHC Unburned Hydrocarbon
VO Valve Overlap
VVT Variable Valve timing
This thesis adopts nomenclature from Heywood[1]. This DISI engine cutaway diagram is annotated with some important terms. Note the piston ring crevice, which is an important source of hydrocarbon emissions. The exhaust manifold, turbocharger turbine and catalyst (not shown) are downstream from the exhaust port in that order. Original image credit: [2].
Intake port Exhaust port
Fuel injector
Fuel spray
Piston bowl
Piston Piston ringCrevice gas
Cylinder wall
'7,
CHAPTER
1
__INTRODUCTION
VER the past 40 years increasingly stringent emissions regulations have re-duced vehicle emissions considerably through advances in vehicle emission control technology. Air quality in urban areas has improved in spite of increasing total vehicle miles travelled. The most significant progress was made by emissions technologies aimed at fully warmed-up engine conditions. For example, fuel injection for precise fuel metering and catalytic converters. Catalytic converters are perhaps the most significant of all emissions control technologies. Three way catalysts promote the simultaneous oxidation of unburned hydrocarbon species, oxidation of carbon monoxide and the reduction of oxides of nitrogen found in engine-out exhaust
gases. [1, 3]
A typical automotive three-way catalyst can reduce harmful emissions by orders
of magnitude. These catalysts are most effective when the engine is operating with a air-fuel mixture close to stoichiometric and when the internal catalyst surface tem-perature is above approximately 250'C. Below this temtem-perature catalytic converters are virtually inactive.
[4]
Consequently, in order to meet the most recent and strictest emissions regulations, engine operating strategies focus on a "cold start strategy" to rapidly heat the catalyst (i.e. shorten the period of time in which it is inactive), while simultaneously reducing engine-out emissions during the catalyst warm-up process,also known as catalyst light-off. This two-pronged approach is shown schematically in Figure 1-1.
1. Accelerate catalyst warm-up
Slow warm-up
HC *- Fast warm-up
mass Total Reduced emissions
flow HC
- m
rate mass Fast warm-up
time time
Slow warm-up
2. Reduce engine-out emissions
HC 'Warmed-up i
mass Total Reduced emissions
flow HC
rate mass.
time time
Figure 1-1: Emissions regulations are based on cumulative emissions. Cumulative emissions are reduced by faster up (top) or lower emissions rate during warm-up reduce (bottom).
Concomitant with stricter emissions regulations, fuel economy requirements have increased. In particular, recent and ongoing increases to U.S. Federal fuel economy standards motivates interest in new vehicle technologies to reduce fuel consumption. Lightweight vehicles, hybrid-electric powertrains and advanced engine technology can reduce fuel consumption. One particular type of advanced engine, the downsized spark-ignition engines with turbochargers and direct injection can offer equivalent power with substantial reduction in fuel consumption compared with conventional engines. [5] Such engines can be used in all vehicles be they lightweight, hybrid or con-ventional powertrains. However, downsized turbocharged DISI engines have renewed emissions challenges, particularly during cold start. [6] The emissions degradation comes from the presence of the turbocharger and the use of direct fuel injection (as opposed to port fuel injection), the very engine features that permit higher efficiency.
This creates a trade-off scenario, with superior efficiency (lower fuel consumption) balanced by inferior emissions.
1.1
Research Objective
This study was initiated to survey engine control strategies for a modern small dis-placement turbocharged direct injection spark ignition engine and a variety of fuel blends appropriate for an engine of this type. The objectives of this work are to quantify trends in engine-out (catalyst-in) emissions and improve catalyst light-off performance by minimizing cumulative emissions of unburned hydrocarbons during cold-start.
This research can facilitate continued development of fuel-efficient engines, and provide a framework for engine developers working on other cold-start emissions is-sues such as particulate matter emissions. Furthermore, as fuel economy standards continue to rise, the present research will find application with hybrid vehicles and small, lightweight vehicles whose engines will eventually migrate to downsized tur-bocharged direct injection architectures.
This research focuses on engine operating strategies to improve catalyst warm-up using technology already common on turbocharged direct injection engines. The
advantage is that operating strategies, once developed, are less expensive for manufac-turers to deploy and do not need repair or replacement. This improves the likelihood
that they will remain effective over the vehicle's life.
1.2
Background
1.2.1
History of Emissions Regulations
Gasoline and diesel internal combustion engines in vehicles are a major source of air pollution in urban areas. There are four main types of regulated engine emissions:
" Carbon monoxide (CO),
" Unburned (or partially burned) hydrocarbon (HC) compounds, and
" Oxides of nitrogen (NO2). For gasoline engines NO2 is primarily nitric oxide (NO), with a small amount of nitrogen dioxide, NO2.
These emissions have well known health effects. Particulate matter can be a respira-tory irritant and contributes as a greenhouse gas. CO is toxic to humans. HC and
NO. undergo photochemical reactions with sunlight to produce smog and ozone. [3, 4]
Emissions performance standards and relevant drive cycles for evaluating them are specified by government agencies and vary by jurisdiction (e.g. U.S., Europe, Japan).In general the performance standards limit the cumulative quantity of each class of emissions produced by the vehicle over a prescribed drive test cycle.
The first vehicle-out emissions standards in the United States were contained in the 1970 Clean Air Act. The Clean Air Act controlled emissions of CO, hydrocarbons known as volatile organic compounds (VOCs) and NO,. Starting in 1975, new pol-lutant limits went into effect limiting cars and light-duty trucks to emit CO at a rate less than 15.0 g/mile, HC less than 1.5 g/mile and NO. less than 3.1 g/mile based on a Federal Test Procedure (FTP) to simulate average driving conditions. Emissions from these prescribed tests are collected and measured by a constant volume sampling system.
Current emissions standards for vehicles in the United States are complex and differ depending on vehicle type and use. A relevant excerpt of emissions standards for light-duty vehicles not including trucks is presented in Figure 1-2. For the prescribed
EPA test cycle, the vehicle's emissions must be within the boundaries to satisfy the
emission rating (e.g. TLEV) and satisfy the CO limit in the legend. Regarding emissions regulations, the conclusion for DISI engines is that the technology that improves their fuel efficiency degrades their emissions performance.
0.5
0.45
0.4
0.35
0.2
-0- Tier 0; CO=7 g/mi
-4-
Tier 1; CO=3.4 g/miS-+-TLEV; CO=3.4 g/mi
0.-A-
LEV; CO=3.4 g/mi
ULEV; CO=1.7 g/mi
0.1--
LEV II; CO=3.4 g/mi
4
ULEV II; CO=1.7 g/mi
0.0
--SULEV;
CO=1.0
g/mi
0
0.2
0.4
0.6
0.8
NO Emissions [g/mi]
x
Figure 1-2: For reference, a typical fuel economy of 28 miles per gallon translates to an average fuel consumption rate of 100 grams per mile. The allowable rate of emissions of non-methane organic gas (NMOG) and formaldehyde is approximately
700 times smaller than the fuel consumption rate. This indicates the importance of
a well-calibrated emissions control strategy and the strictness of current emissions standards.
1.2.2
Cold-start issues for DISI
Cold start can be roughly defined as vehicle operation after an extended period of non-use. A more precise legal definition describes a period of room temperature soak that vehicles must undergo prior to a prescribed test protocol such as the U.S. Federal Test Procedure (FTP). Currently, the majority of the total cumulative HC and CO emissions during the FTP-75 test are produced during the initial 25 seconds of engine operation before the catalytic converter reaches operating temperature.
Smaller turbocharged direct injection spark ignition engines, used for better fuel economy, introduce new emissions issues that degrade emissions behaviour during cold start by slowing down catalyst light-off and complicate emissions control. The three main cold start emissions issues for DISI engines are:
1) DI fuel injection delivers more liquid fuel to surfaces in the combustion
cham-ber than PFI. In PFI operation, fuel is injected in the intake port upstream of the combustion chamber. Fuel evaporates with heat intake port and valve surfaces and a mixture of air and fuel vapour is inducted into the combustion chamber. In DI oper-ation, fuel is injected directly into the combustion chamber. Some of the liquid fuel will not evaporate. This fuel may be stored on piston surfaces, in the cylinder-wall oil film or combustion chamber crevices. A portion will survive subsequent combustion events unburned or partially burned and be exhausted from the engine. Then, since the catalytic converter is ineffective during cold start, the unburned fuel contributes to engine-out emissions. Figure 1-3 show DI and PFI fuel sprays.
To guarantee that enough fuel evaporates in the intake port to form a combustible air-fuel mixture in the combustion chamber, PFI systems require significant enrich-ment of the first few cycles. DI fuel systems require far less enrichenrich-ment because DI fuel injection controls the amount of fuel that enters the combustion chamber bet-ter than PFJ. However, evaporation of the fuel that enbet-ters the combustion chamber is not guaranteed for DI fuel systems. Therefore the cold-start issue is mainly the uncertainty around fuel evaporation and mixing.
syn-C
Figure 1-3: Typical PFI fuel spray targets the back surface of the intake valve (left). Liquid fuel evaporates before it is inducted into the combustion chamber. The DI fuel spray (right) contains liquid fuel droplets, which may not evaporate before com-bustion.
ergies with small, highly boosted direct injection engines. The evaporative properties of ethanol contribute to higher efficiency and autoignition prevention at high load. In addition to its higher heat of vaporization compared to gasoline, ethanol also has lower calorific value. Therefore, compared with gasoline the ethanol-fuelled engine will have a greater quantity of fuel injected, and the fuel may evaporate more slowly, both of which may exacerbate DISI emissions issues.[7]
2) For most engines and catalyst types, the addition of a turbocharger shifts the catalytic converter further down-stream, away from the engine. The high ratio of surface area to volume and relatively large thermal mass of the turbine rotor and shroud absorb thermal energy during warm-up, which delays warm-up of the catalyst that is downstream from them. This delay also reduces the effectiveness of secondary air injection (SAI), which is currently one of the most effective cold start hydrocarbon control techniques. More detail on this limitation is presented in the next chapter.
3) In order to mitigate autoignition (knock), turbocharged engines are designed
with lower compression ratios than comparable naturally aspirated engines. The temperature of fuel-air mixture in the combustion chamber is lower at the start of
combustion for an engine with a lower compression ratio. Low temperature at the start of combustion can cause high cycle to cycle variability and/or partial-burn misfire which are undesirable. Combustion robustness is better at high temperature. Many of the strategies used to accelerate catalyst warm-up are limited by cycle-to-cycle variation. Hence, lower compression ratio limits can have an adverse effect on catalyst warm-up.
1.2.3
Engine start-up
The start-up process of an internal combustion engine has five parts:
1. Acceleration from stand still to the cranking speed.
2. Motoring at the cranking speed.
3. Acceleration upon firing in any one cylinder.
4. Acceleration due to firing in the rest of the cylinders. One or more cylinder(s) may misfire causing instantaneous deceleration, but the engine has to accelerate to speed, for a successful start.
5. Deceleration from the peak starting speed to the steady idling speed.
Although a significant portion of emissions occur during cranking and speed flare, the focus of the present work is the fast-idle phase of the start-up procedure because the fast-idle phase is extended duration for DISI turbocharged engines. Moreover, the fast-idle phase is more general whose findings are easier to apply to other engines. In contrast, the cranking and speed flare can depend heavily on the specific engine and details of engine termination from prior periods of operation. The steady idle portion starts around t=4[s] in Figure 1-4
1.3
Research Methodology
The focus of this research is engine operating strategies. The conclusions on engine physics are more widely applicable than those based on engines with unique or ex-otic equipment. Another reason to focus on engine operating strategies is once they
C0. (n) 1.0 0.9 0.8 0.7 0.6 0.5 0.4 0.3 0.2 40 35 30 25 20 15 10 5 0 -5 -10 MAP -.--- RPM .... ... ... ... ... ... ... ...
...-0-
--- --- ---- -- ---0 2 4 6 8 10 12 14 16 18 2~ 0 2 4 6 8 10 12Time after crank (sec)
14 16 18 2 2000 1800 1600 1400 1200 1000 800 600 400 200 0 1 .4 n-1.3 1.2 1.1 1.0 0.9 0.8 0.7 0.6 0.5
Figure 1-4: The cold idle period is most applicable to other engines and significantly extended by the delay to catalyst warm-up caused by the turbine. Image credit:[8]
are developed, operating strategies can be widely and cheaply disseminated, which bolsters the probability that they will be deployed in emerging markets.
The research is carried out in two broad areas, modelling and experiments.
Modelling
An experimentally-validated 1-D numerical model of the experimental engine is used to estimate the response of engine exhaust thermal enthalpy flow rate to key engine operating parameters. It is also used to probe details of engine operation that are difficult or impractical to measure experimentally. For example, intake and exhaust gas exchange details such as residual gas fraction and intake valve back flow.
A 1-D thermal model of the exhaust components between the engine and the
catalyst is used to simulate the temperature profile that occurs while the catalytic converter is warming up.
A 1-D kinetic model of a catalytic converter based on an experimentally
charac-Spark
-*
e
terized catalysts from the literature is used to process experimental engine-out data to simulate catalyst light-off. A detailed chemical kinetics model of the catalyst is used instead of empirically based gross efficiency to allow broader conclusions that are not dependent on manufacturer-specific catalyst formulations, nor on the effects of catalyst ageing.
The experimental exhaust data and computational catalyst model are combined to quantify engine operating strategy impact on light-off, cumulative emissions and strategy limitations.
Experiments
Engine experiments are run at conditions that represent the idle portion of engine start-up. Temperature of fuel, air, coolant and oil are controlled to replicate cold-start.
Engine cold-start operating strategies center on the following engine operating parameters listed below, and explained in greater detail in the next chapter.
9 Ignition timing e Equivalence ratio e Fuel injection schedule 9 Valve timing
e Exhaust back pressure e Waste-gate bypass e Fuel ethanol content
Each of the preceding experimental parameters is varied. For a given experiment, the exhaust mass flow rate, temperature and composition is measured. Other engine diagnostics such as cylinder pressure and manifold pressures and temperatures are recorded also.
CHAPTER 2
HYDROCARBON EMISSIONS DURING COLD START
HE objective of engine control during cold-start is to minimize cumulative emissions of hydrocarbons from the vehicle. Cumulative hydrocarbons are minimized by accelerating warm-up of the catalytic converter and mini-mizing engine-out emissions during the warm-up period when the catalytic converter is inactive. The goal of minimal cold-start emissions is based on regulatory limits on vehicle emissions and emissions testing methods, and an understanding that once the catalytic converter has reached its operating temperature it eliminates virtually all engine-out emissions. This chapter explains why engines emit unburned hydrocar-bons, how to control emissions during engine cold-start, reviews existing cold-start literature and predicts engine behaviour in response to engine controls. This chapter is divided in five parts:
1. Description of source of engine hydrocarbon emissions.
2. Explanation of desired engine behaviour during cold-start.
3. Connection of desired cold-start engine behaviour with engine operating
param-eters to achieve them.
4. Review of existing literature on engine cold-start.
2.1
Hydrocarbon sources
Most of the hydrocarbon fuel in the engine is consumed by turbulent flame propaga-tion initiated by the spark plug. Hydrocarbons which are not consumed (i.e. com-pletely oxidized) during primary combustion contribute to engine-out hydrocarbon emissions. This section describes the major mechanisms through which hydrocar-bons can escape complete combustion.
Cheng et al. perform a highly regarded, quantitative and comprehensive inves-tigation of the hydrocarbon pathways in an engine.[9]. They identify the following sources of engine-out hydrocarbon emissions.
" Misfire or partial burn: when combustion is too slow, starts too late or has its
flame front extinguished by excessive local strain rate.
" Engine crevices and absorption/desorption from oil films, combustion deposits:
As in-cylinder gas pressure rises, some unburnt mixture is stored in crevices (confined spaces too small for flame penetration) and oil films. When in-cylinder gas pressure falls during expansion and exhaust strokes, the stored mixture exits into the combustion chamber. Burnt gas temperature may be too low for full oxidation of crevices gases during the time available.
" Poor mixture preparation: Poor mixing of fuel with air may result in local rich
zones and local lean zones, some of which do not oxidize rapidly enough due to paucity of fuel or oxygen.
" During DI engine warm-up when the high pressure fuel pump has not reached its
operating pressure, the DI injectors operate at low pressure and produce large fuel droplets. To compensate for slow and/or incomplete evaporation of large droplets, the mixture is enriched (globally rich of stoichiometric) to guarantee enough fuel can vaporize to form a combustible mixture in the gas phase. This type of enrichment is also common in early stages of PFI engine warm-up to compensate for slow evaporation from cold intake port surfaces.
" Short-circuiting of unburned mixture from the intake into the exhaust port
short-circuiting. PFI engines induct air-fuel mixture into the combustion chamber, some of which may short-circuit during the valve overlap period when the intake and exhaust valves are open simultaneously. In contrast, DI engines induct air only, and DI fuel injection occurs after the exhaust valve is already fully closed. Therefore air only, and no fuel can short-circuit into the exhaust system during valve overlap for DI engines.
Fuel hydrocarbons escape oxidation during the primary combustion event through the preceding mechanisms. Research for warmed up engine suggests that around 92 percent of fuel is oxidized during flame propagation and approximately half of the remaining 8 percent will be oxidized in the burnt gas mixture after being expelled from crevices or desorbed from oil films. Of the remaining 4 percent, 50-80 percent will be oxidized in the exhaust port. [9-13] Thus 1-2 percent of the original fuel makes it to inlet of the catalytic converter.
During cold-start, mixture preparation is poorer (slower evaporation) and cold combustion chamber crevices host a greater mass of unburned mixture at higher density. A greater mass of unburned mixture in the crevice is likely to contribute to
greater catalyst-in emissions.
On balance, it is probable that in direct injection engines, a greater fraction of fuel will escape flame-front combustion during cold start and contribute to engine-out emissions.
Engine designs and operating strategies to promote effective mixing and minimize crevice volume can improve but not eliminate hydrocarbon emissions. Engines on their own do not meet vehicle emissions standards. Vehicles rely on catalytic convert-ers to consume (i.e. oxidize) engine-out hydrocarbon emissions to satisfy vehicle-out emissions standards. The catalytic converter is effective when warm, so the goals of engine hydrocarbon control must be to warm the catalyst quickly and minimize emissions during the warm-up process. The next section describes engine operating conditions that achieve low engine-out hydrocarbon concentration and fast catalyst warm-up.
2.2
Desirable characteristics during cold-start
This section describes how the engine should operate to accelerate catalyst warm-up and limit emissions during the warm-up period.
The catalyst warm up characteristics are primarily a function of the exhaust gas enthalpy flow. That is, exhaust mass flow rate and exhaust gas temperature. Higher flow rates and higher temperature exhaust gas warm the catalyst more quickly. Higher mass flow rates reduce transit time of exhaust gas from the engine to the catalyst. The reduced residence time overpowers higher convection coefficients (from the higher mass flow rate), and the net result is a higher exhaust gas temperature at the catalyst inlet. Higher exhaust gas temperature in the catalyst at any mass flow rate will cause heat transfer within the catalyst to increase.
However, for a given concentration of engine-out emissions, a higher exhaust mass flow rate equates to a higher emission rate. Put another way, a higher emissions concentration can be tolerated if it occurs for a shorter warm-up period, and a slower warm-up process may be tolerated if the engine-out emissions are low. Therefore, cold-start strategy must strike a balance between high exhaust thermal enthalpy and low engine-out emissions.
2.2.1
High mass flow
Catalyst warm-up is a convective heating process. Higher exhaust gas mass flow rate accelerates the rate of heat transfer from the exhaust gas to the catalyst substrate. The fast idle portion of cold-start occurs at a constant engine speed and engine output (i.e. engine load). To understand how exhaust gas mass flow connects with engine load it is helpful to remind the reader of the definitions of gross, pumping and net mean effective pressure. In what follows, "indicated" means measured by cylinder pressure data as opposed to "brake", which means measured by engine dynamometer.
e Gross Indicated Mean Effective Pressure (GIMEP) is gross engine work
" Pumping work is a sort of "overhead" work done by the engine during gas
ex-change to pump burned gases out during the exhaust stroke, and pump fresh unburned gases in during the intake stroke. Pumping Indicated Mean
Effec-tive Pressure (PIMEP) is pumping work per cycle divided by displacement
volume. (PIMEP = Wp/VD)
" Net Indicated Mean Effective Pressure (NIMEP) is the difference
be-tween GIMEP and PIMEP (NIMEP = GIMEP - PIMEP)
For a given engine, neglecting losses from friction and accessories, constant engine load means constant Net Indicated Mean Effective Pressure (NIMEP). Equation 2.1 combines the definition of gross, net and pumping indicated mean effective pressures in a useful heuristic for understanding how fuel flow rate, and by consequence exhaust gas mass flow, rate can be increased at constant NIMEP and engine speed.
GIMEP - PIMEP = NIMEP = const.
(m - VcombD QLHV ' -i,g (pe - p) = NIMEP = const. (2.1)
VD is the engine displacement volume, mf is the mass of fuel injected, 71comb is the combustion efficiency or combustion completeness, QLHV is the lower heating value of the fuel and ili,g is the indicated gross fuel conversion efficiency (gross indicated work per cycle divided by fuel energy input, defined in greater detail later), pe is the exhaust pressure, and pi is the intake pressure.
At steady state, the mass flow rate of exhaust gas is the sum of the mass flow rate of air and the mass flow rate of fuel. For a given stoichiometry, the mass flow rate of air is proportional to the mass flow rate of fuel. Therefore, an increase in the mass flow rate of fuel will increase the mass flow rate of exhaust gas, but the increase to fuel mass flow rate must be counterbalanced by a concurrent reduction to i,9 to
maintain the same engine output load (NIMEP). Also, an increase in pumping work will increase the amount of fuel required for constant load.
The fuel mass and combustion efficiency terms (mf ' comb) are grouped with parentheses to reinforce the necessity of complete combustion. Injecting a greater
fuel mass increases exhaust mass flow rate, which is desirable. However, fuel that is injected but does not react directly increases engine emissions. Hence, the objective is to increase the mass of fuel which reacts while reducing the fuel conversion efficiency to maintain constant engine output. The next question is how to reduce indicated gross fuel conversion efficiency.
Lower gross conversion efficiency
The indicated gross fuel conversion efficiency is the ratio of gross indicated work per cycle to the input fuel energy, for internal combustion engines the latter is usually based on the fuel's lower heating value.
Gross indicated fuel conversion efficiency is lower for late combustion, long com-bustion duration or excessive heat transfer losses from gases in the comcom-bustion cham-ber. The reason that late combustion results in lower fuel conversion efficiency is explained with an analogy to the ideal Otto cycle. The indicated gross efficiency of the ideal Otto cycle is shown in Equation 2.2
1
nTOtto,ideal 1-(2.2)
rc
For constant volume combustion heat release, late combustion occurs with a lower effective expansion ratio. Hence from ideal cycle theory, one expects lower conversion efficiency.
Real combustion occurs over a finite duration, not instantaneously at constant vol-ume, so heat release takes place incrementally. In effect, each increment experiencing its own effective compression and expansion ratio, all less than the ideal geometric compression ratio. The gradual heat release leads to lower peak pressures and less work extraction during the expansion stroke.
Real combustion cycles also have irreversibility in chemical reacting mixtures, heat transfer losses to combustion chamber surfaces, crevice effects and blowby of combustion gases past the piston rings which further degrade efficiency.
desired low fuel conversion efficiency. (N.B.: The author generally finds it abhorrent
to purposely advocate and design strategies to achieve low fuel conversion efficiency. In the context of emissions control, it is a grudging sacrifice.)
Increase pumping work
Cold start conditions can be approximated by constant NIMEP. An increase to pump-ing work (PIMEP) necessitates a concomitant increase to GIMEP to maintain con-stant NIMEP. Ordinarily engineers strive to reduce pumping work, but the (tem-porary) objective during cold start is to accelerate catalyst warm-up with higher enthalpy flow rate, that is with higher mass flow rate and temperature of exhaust gases.
2.2.2
High exhaust gas temperature
High temperature exhaust increases the rate of convective heat transfer from exhaust gases to the catalyst. With available oxygen, exhaust temperatures above 750'C facilitate post-flame and post-cylinder oxidation of gas phase engine-out unburned hydrocarbons before they reach the catalyst.
Reduce gross conversion efficiency
Aside from increased mass flow rate of exhaust gas, the added benefit of low fuel conversion efficiency is the rise in exhaust gas temperature that accompanies late combustion. For late combustion, less of the thermal energy from combustion heat release is extracted from the cylinder gases as work by the piston. The remaining internal energy remains in the gas as thermal energy. Hence late and/or slow combus-tion which degrade indicated gross fuel conversion efficiency increases the temperature and mass flow rate of exhaust gases.
Preheat mixture
For cold-start behaviour there are two practical benefits to pre-heating the mixture. One is that higher temperatures enhance chemical reactivity, which may improve combustion stability and reduce cycle-to-cycle variability and prevent partial-burn misfire. The second advantage is that hotter initial charge temperatures result in proportionally higher exhaust gas temperatures. There is also a moderate pumping work penalty to high initial mixture temperatures, which as explained above for cold start is a moderate pumping work benefit.
Reduce thermal losses
Since the objective is to accelerate the warm-up process of the catalytic converter, it is desirable to reduce the amount of exhaust gas thermal energy lost to the walls of the exhaust system between the engine and the catalyst. This is a strong function of engine and component design, but there are at least two practical operational variables that can reduce heat transfer.
2.2.3 Low emissions
Apart from accelerating catalyst warm-up, an integral part of cold-start emissions control is to minimize the mass flow rate of controlled emissions while waiting for light-off.
Reduce mass flow
Low mass flow rate of exhaust decreases the cumulative emissions. However, this is at odds with the goal of accelerating catalyst warm-up.
Reduce emissions concentration
Low concentration of emissions reduces cumulative emissions. Low concentration is achieved through complete combustion in-cylinder and greater flame and post-cylinder oxidation of hydrocarbons that escape primary flame combustion.
Post-flame oxidation
Primary flame combustion ends when the flame arrives at the boundary of the com-bustion chamber. Post-flame oxidation refers to the oxidation of unburned mixture from oil films and combustion chamber crevices that re-enter the combustion chamber after flame combustion during the expansion stroke and exhaust stroke. Oxidation occurs when unburned mixture mixes with high temperature burned gases. The basic idea is that high combustion chamber gas temperature late in the expansion stroke and during the exhaust stroke will promote continued oxidation of hydrocarbons that escape primary combustion. Post-flame oxidation can continue after gases leave the combustion chamber (i.e. in the exhaust port or exhaust manifold). This post-flame
oxidation is called post-cylinder oxidation.
Avoid partial-burn misfire
Engine misfire can cause significant emissions during the warm up period, so it is important to avoid engine misfire. Misfire is an imprecise term that generally implies incomplete combustion, a cycle whose gross work falls well below the mean value for that operating condition. Misfire is thought to occur when combustion fails to com-plete because it starts late, proceeds too slowly or is quenched by excessive localized flame strain. The cause may be systematic such as excessively late ignition tim-ing or stochastic such as localized eddies that inhibit early flame development. The term partial-burn misfire is preferred because it emphasizes the undesirable emissions impact of incomplete combustion.
Partial-burn misfire is undesirable because it causes torque fluctuations, harsh en-gine operation and unwanted enen-gine vibration. Partial-burn misfire is also undesirable because incomplete combustion may cause a full charge of fuel and air to leave the cylinder completely unburned. This would be devastating for emissions performance.
A typical vehicle can emit a cumulative total of less than about 300 ing of unburned
hydrocarbons during the first 30 seconds or 12,000 cycles (for a 4-cylinder engine) of the FTP-75 test. A typical automotive engine at low load during cold-start, burns
around 10-20 mg of fuel per cylinder per cycle. This means the fuel delivered to each cylinder, each cycle contains 3-7% of the total allowable emissions. Counting the hydrocarbons that escape combustion (e.g. due to crevices, oil films, etc.), there is practically no remaining "emissions budget" for any totally-incomplete combustion due to partial-burn misfire.
It is possible that a partially burned mixture could continue to oxidize while en route to the catalyst due to post-flame and post-cylinder oxidation, but the danger of misfire is clear. Engine operation during cold-start must be robust.
To summarize, hydrocarbon emissions during cold start are minimized when:
e Fuel and air are well-mixed or preheated for complete evaporation and complete
combustion,
e The engine has a high flow rate of exhaust gas for rapid catalyst warm-up, e Exhaust gas is at high temperature for rapid catalyst warm-up and post-flame
oxidation of hydrocarbons, and
e Combustion is stable to avoid partial-burn misfire.
The next section describes the available engine operating variables and how those variables contribute to the desired characteristics.
2.3
Engine operating parameters
In the past, the freedom to change engines operating parameters during operation was limited. Parameters like valve timing were set to a single "static" value found to be workable compromise at all speeds and loads. Because cold-start is a limited portion of the engine operating range, valve timing was set for other conditions. Now modern computer-controlled engines permit realtime optimization of engine parameters for each condition of operation. Therefore it is time to re-examine how engine parameters can be used to accelerate catalyst warm-up and limit engine-out emissions during warm-up.
2.3.1 Ignition Timing (Spark timing)
Spark initiates combustion and therefore controls the timing of combustion heat re-lease. There is an optimal ignition timing called maximum brake torque (MBT) timing, which optimizes heat release and work extraction. MBT ignition timing has
maximum indicated gross fuel conversion efficiency (eta,g), minimum fuel consump-tion and low exhaust gas mass flow rate.
Ignition timing earlier than MBT suffers greater heat transfer and dissociation losses and hence low conversion efficiency(jj,g) and low exhaust gas temperature which hinder warm-up. Ignition timing later than MBT also has low conversion efficiency
(2i,g) and high gas temperature in the expansion and exhaust stroke for fast catalyst
warm-up and post-flame oxidation. The relationship between late ignition, post-flame oxidation and cycle-to-cycle variability is now discussed.
Figure 2-1 plots cylinder pressure for two consecutive engine cycles with some engine events labelled. During a typical cold-start engine cycle, beginning with the intake valve closing (IVC) the mixture is compressed during the piston upstroke. For ignition timing after top dead center, which is typical for cold start, the mixture expands during the piston downstroke. The spark plug is activated, which creates a nucleus of plasma and radicals on the spark plug electrodes. The plasma ball grows into a flame kernel and eventually a turbulent flame expands outward from the spark plug to consume the fuel-air mixture in-cylinder. As the flame front propagates, the flame-front heats and compresses the unburned mixture. At the same time, piston motion during expansion extracts work and cools the charge. The prevailing changes in temperature and pressure due to piston motion are unfavourable for combustion with substantially retarded spark timing. Piston motion during the expansion stroke reduces pressure and temperature and could quench the reaction if the rate of heat release does not overwhelm the rate of work extraction. The rate of heat release depends on the engine operating conditions, mixture properties, turbulence and other variables.
8-7 Ign Ign 6 -5- S012 S012 4-.- EVO EVO U 2-EVC EVC 1 vo wvo
l1 c soil IVC soil
0 1 11-I _ I I I _ _ I
0 180 360 540 720 900 1080 1260 1440
CAD ABDC
compr.
Figure 2-1: Ignition occurs approximately 15 CAD ATDC when piston downstroke is already causing cylinder pressure to fall. Maximum pressure is due to motor-ing/compression, not combustion.
gasoline engine 1200 RPM is 10 cycles per second or a cycle period of 100ms. That implies that each stroke lasts approximately 25 ms, which is therefore the time scale of post-flame oxidation in the exhaust stroke. Additional time is available for oxidation in the port and runner, but the temperature and hence reaction rate are lower there. For the oxidation to occur in the time available, the mixture must have sufficient fuel and oxygen at a high enough temperature. For unburned mixture that leaves the piston crevices during expansion and exhaust, the mixture is usually close enough to stoichiometric that oxygen and fuel concentrations are satisfactory. The unburned mixture temperature, which is close to temperature of the cylinder wall, is much lower than the burned gas temperature. Therefore, for effective post-flame oxidation of crevice gases, the unburned mixture temperature in the expansion and exhaust stroke must be high. Research suggests at temperatures above approximately 1500 K, hydrocarbon oxidation is rapid and diffusion-limited. [14]
Figure 2-2 visually explains the mechanism start strategy. In other words, late combustion
pcyrdV~ "poorly aligned" for late ignition
Early
Late
Ignition timing
of retarded ignition timing as a cold-has lower mechanical efficiency. Thus
4-Early
Thermal
Mechanical
Late
Ignition timing
Figure 2-2: When combustion is late, the piston extracts less work from in-cylinder gas therefore more thermal energy remains in the gas.
for constant output torque at lower conversion efficiency due to late ignition, more fuel must be burned. The net result is both higher mass flow of exhaust gases and higher exhaust gas temperature. The latter point is important for emissions. When burned gases are at higher temperature, they cause more post-flame oxidation of the unburned mixture from oil films and crevices gases. This relationship is shown schematically in Figure 2-3. At constant output torque, later ignition produces higher temperature exhaust gas and requires a higher consumption rate of air and fuel. The overall mass flow rate of unburned hydrocarbons may decrease, increase or remain the same.
1. Decrease: The increase in exhaust flow rate is offset by a lower concentration
of exhaust hydrocarbons due to post-flame oxidation in cylinder, exhaust port and runner.
2. Increase: The increase in exhaust flow rate is greater than the decrease in exhaust hydrocarbon concentration.
HC
Early
Late
Temperature
Ignition liming
Figure 2-3: High exhaust temperature decreases engine-out hydrocarbon concentra-tion. High exhaust gas temperature facilitates post-flame oxidation of hydrocarbons that would otherwise escape.
3. No change: The increase in exhaust flow rate is exactly balanced by the decrease
in exhaust hydrocarbon concentration.
The uncertain outcome of the trade-off between increased mass flow rate and lower hydrocarbon concentration is summarized in Figure 2-4. In most cases overall mass flow rate of hydrocarbons will decrease but it is difficult to predict which scenario will occur in a real engine. The temperature-pressure history of the reacting gas mixture are coupled with the heat release rate and piston kinematics. This is a motivating factor for performing engine experiments. Late ignition has been studied but DI engines have significantly different mixture formation processes that determine emissions behaviour.
If later ignition increases the flow rate of exhaust but decreases the overall mass
flow rate of hydrocarbons, late ignition is a win-win strategy. It simultaneously increases thermal enthalpy flow to the catalyst to accelerate light-off and decreases exhaust mass flow rate of hydrocarbons. This suggests there are questions regarding the use of late ignition timing: what is the limitation on arbitrarily late ignition timing?


![Figure 2-6: Late ignition timing leads to significant increase in exhaust gas mass flow rate for constant NIMEP=2.0 [bar] and D=I1.](https://thumb-eu.123doks.com/thumbv2/123doknet/14480937.524096/63.918.243.650.147.588/figure-ignition-timing-significant-increase-exhaust-constant-nimep.webp)
![Figure 2-7: Late ignition timing leads to significant increase in exhaust gas tempera- tempera-ture for constant NIMEP=2.0 [bar].](https://thumb-eu.123doks.com/thumbv2/123doknet/14480937.524096/64.918.255.693.93.535/figure-ignition-significant-increase-exhaust-tempera-tempera-constant.webp)