- 1 -
Design and Analysis of Low-Cost X-ray Imaging System
Incorporating Consumer Camera Imaging
by
Logan B. Abel
SUBMITTED TO THE DEPARTMENT OF NUCLEAR SCIENCE AND
ENGINEERING IN PARTIAL FULFILLMENT OF THE REQUIREMENTS
FOR THE DEGREE OF
BACHELOR OF SCIENCE IN NUCLEAR SCIENCE AND ENGINEERING AT
THE
MASSACHUSETTS INSTITUTE OF TECHNOLOGY
June 2018
© 2018 Logan B. Abel. All rights reserved.
The author hereby grants to MIT permission to reproduce and to distribute publicly paper and electronic copies of this thesis document in whole or in part in any medium now known or
hereafter created.
Signature of Author:_____________________________________________
Logan Abel Department of Nuclear Engineering May 18, 2018
Certified by:___________________________________________________
Michael Short Assistant Professor of Nuclear Science and Engineering
Thesis Supervisor
Accepted by:___________________________________________________
Michael Short Assistant Professor of Nuclear Science and Engineering Chairman, Committee for Undergraduate Students
- 3 -
Design and Analysis of Low-Cost X-ray Imaging System
Incorporating Consumer Camera Imaging
by
Logan B. Abel
Submitted to the Department of Nuclear Science and Engineering on May 18, 2018 In partial Fulfillment of the Requirements for the Degree of
Bachelor of Science in Nuclear Science and Engineering
ABSTRACT
X-ray imaging is a core component of our modern medical diagnosis arsenal in combatting a broad range of disease. X-ray imaging allows medical professionals to see the internal structure and layout of the human body, and in this way allows for the visualization of unseen ailments. A current “disease of poverty” which is the target of this study is tuberculosis, a lung bacteria which is visible on x-ray imaging. X-ray imaging is a well known and used technology, yet x-ray imaging remains very expensive and unwieldy for use in less-developed regions of the world. Within the last three to four decades, the world has seen a massive explosion in consumer camera technology development, largely driven by circuit miniaturization, and this has led to cheaper and higher resolution cameras being produced. X-ray images themselves rely on a material to turn x-rays, the photons which pass through the person in medical imaging, into electrical signals which can be read by a computer. This collection of x-ray photons can be done through the coupling of a scintillating screen and a camera which images the scintillating screen to create an x-ray image. This study explores this particular method of x-ray imaging which is likely to be cheaper than existing methods of x-ray imaging, yet also likely yields images of poorer resolution and contrast distinction in x-ray images. The theoretical components necessary to setup such a system in the most efficient manner possible were analyzed, taking into
consideration safety and finance constraints. The imaging capabilities of a Nikon D810 (f/1.4, 50 mm lens) and iPhone 5S (f/2.2 lens), higher and lower quality cameras respectively, were
analyzed using three scintillating screens, the MCI Optonix DRZ High, Scintacor DRZ Medium, and Scintacor DRZ Ultrafine screens, to capture the x-rays produced from a 14 mA 100 kV x-ray tube. It was found that the Nikon D810 coupled with the MCI Optonix DRZ High Screen
produced results similar in performance to current medical imaging, and the iPhone 5S images were too noisy to be conclusive. Further work should go into developing a more finalized and standalone product that can be tested in clinically important settings, as this study does provide the proof-of-concept framework for this to be possible.
Thesis Supervisor: Michael Short
- 5 -
Acknowledgements
Special thanks to my two original partners on this project, Rossana Iturbide and Gilberto Mota, my loving and supportive parents and brother, my advisors Dr. Mike Short and Dr. Richard
- 7 -
Contents
Certified by:___________________________________________________ ... 1 Accepted by:___________________________________________________ ... 1 Chapter 1: Introduction ... 9 Chapter 2: Background ... 11 2.1 X-ray Imaging ... 112.1.1 Current Methods of X-ray Imaging... 11
2.1.2 Digital Radiography (DR) Detectors ... 14
2.1.3 Scintillating Screens ... 15
2.2 Imaging ... 15
2.2.1 General Camera Imaging ... 15
2.2.2 Modulation Transfer Function (MTF) Curve ... 18
2.2.3 Cell Phones ... 19
2.3 TB as a Model and Target Disease ... 20
2.4 X-ray Imaging Safety ... 20
2.5 Current State of Research ... 21
Chapter 3: Proposed Solution and Design ... 23
3.1 Parameters for the X-ray Imaging Device ... 23
3.1.1 Human Physiology and Attenuation ... 23
3.1.2 Distinguishing Between TB Nodules and Surrounding Tissue ... 25
3.1.3 Optimization and Design: ... 26
3.1.4 Photon Efficiency and Resolution Analysis ... 26
3.2 Putting it All Together ... 30
Chapter 4: Design Approach ... 32
Chapter 5: Results ... 41
5.1 Initial “Proof of Concept” Results ... 41
Chapter 6: Discussion ... 48
Chapter 7: Conclusions and Future Work ... 50
Chapter 8: References ... 52
Chapter 9: Appendix ... 55
I. Computer Enhancement ... 55
II. Gamma Attenuation Curve for Soft Tissue in Humans ... 55
- 9 -
Chapter 1: Introduction
X-ray imaging across the globe remains largely inaccessible to a majority of the world’s
population. Two in three people, or some four billion people around the globe do not have access to x-ray imaging. This lack of access, coupled with the estimate that 20-30% of clinical cases require imaging for diagnosis of the underlying condition, indicates that a significant majority of diseases that need to be diagnosed are not being diagnosed [1]. This lack of diagnosis is
concerning, primarily because so many millions die yearly from diseases requiring imaging for diagnosis such as internal bleeding, cancer, and tuberculosis. Clearly, a solution needs to be found to bring low-cost x-ray imaging to developing regions of the world [2]. To do so, it must be determined whether this low-cost x-ray imaging is feasible, and if so, what means are available.
X-ray imaging is the usage of “x-rays” or high-energy photons to take images of the internal structure of physical objects, often used in medical settings to take images of the inside of the body. Images of the body are able to be taken as x-rays largely pass straight through solid matter until they are absorbed in the electron clouds around atoms, allowing the person looking at the x-ray image to effectively see a “density map” of the electrons which is correlated with where exactly, for example, bones and soft tissue are in the body.
X-ray imaging and ultrasound are considered the “standards” of imaging care provided in healthcare facilities, and in conjunction (both x-rays and ultrasound have their distinct areas of usefulness) they can diagnose the vast majority of diseases needing imaging. Ultrasound
equipment has already reached the sub-$1000 boundary [3] yet simple x-ray imaging, a far older technique, remains far too expensive for practical use across the globe. X-ray imaging poses a number of challenges peculiar to the developing world, such as fragility of the equipment, inadequate infrastructure, the cost of the equipment, and the lack of radiologists.
Perhaps a most dramatic example showing the disparity in x-ray imaging access is the fact that at the Massachusetts General Hospital (MGH) in Boston there are 126 radiologists, and in the country of Kenya there are about 200 radiologists [4]. Even if the radiologists at MGH serviced
- 10 -
the whole population of Massachusetts, there would still be 5 times more radiologists per person in Massachusetts than in Kenya.
Standing out among the “diseases of poverty”, or diseases that primarily afflict developing areas of the world is tuberculosis, or TB. TB is a bacterial infection of the lungs that occurs when tuberculosis bacteria infect a person’s body and take up residence in the lungs of that person. These TB form colonies, or nodules, that are visible to x-rays and, when more fully formed, are often less than a centimeter up to five centimeters in size [5]. If not treated, the infection gets worse and worse, eventually killing the person. During this time, the diseased individual spreads the disease by coughing and giving the bacteria to others, who then continue through the same disease progression.
TB can be diagnosed through laboratory testing and treated with antibiotics yet the current reality of TB is such that antibiotics cannot be given preventatively to everyone who may have TB as this contributes to the spread of antibiotic resistance. Thus, a low-cost and easy way is needed to diagnose TB – and x-ray imaging, or digital radiography (DR), can fill this role.
We believe that with slightly lower resolution resulting in a significantly lower price, we can lower the barrier for x-ray imaging enough that it can be employed in locations historically lacking access to x-ray imaging. This project determines and tests the necessary specifications needed to diagnose several x-ray diagnosable diseases, most prominently TB, as well as lung cancer, pneumonia, and various other fractures and ailments, and design a device that can image and diagnose these diseases at a low cost. This must be done while also not sacrificing quality, so as not to be sending off inferior equipment to the developing world. This cheaper x-ray imaging project is developed using existing x-ray imaging paradigms and a thorough analysis and optimization of the x-ray imaging design. This thesis presents a mock-up model of the x-ray imaging device and the device is tested in a simulated real-world environment.
- 11 -
Chapter 2: Background
2.1 X-ray Imaging
2.1.1 Current Methods of X-ray Imaging
X-ray imaging, at a basic level, is the taking of images using x-rays as the medium of conveying the information, somewhat similarly to how visible light conveys the information captured in visible images. The difference between visible imaging and x-ray imaging is that x-ray imaging is more of a “shadow” of the image, whereas visible imaging makes use of light reflected off of the object being imaged. X-ray images are generated from x-rays that travel through the object to be imaged and are attenuated as they travel through.
X-rays are attenuated as they travel through matter and collide with the electrons of the atoms in that matter and lose energy through absorption or reflection. Elements with a higher atomic number, like heavy metals such as lead, attenuate x-rays more effectively. This increase in effective x-ray attenuation is due to the higher density, the higher electron density, and the ease of x-rays being absorbed by electrons surrounding the atom, due to the low energy of electrons in the outer orbitals.
After the x-rays are attenuated in a material, the x-ray beam has a shadow of the material, generated by the varying densities and elements throughout the material, which is present in the x-ray beam in the direction of propagation of the x-ray beam. This shadow is captured in a “typical” x-ray image, as shown in Figure 1, traditionally using film as the ray information absorber. These x-rays can also be converted into visible light through a scintillating material1. A scintillating
material is a material that uniformly attenuates x-rays through electron absorption of x-rays, and releases visible light as the electrons fall back down into the electron shells around the absorbing atom. The falling of these electrons generate visible photons, the color of which is dependent on
1 These x-rays can also be directly turned into a readable electrical signal for imaging, but this is less often used due
- 12 -
the compound, and particularly the energy of the energy shells. The difference in energy between the electron shells that the electron falls over generates the photon, the energy of which is equal to the change in energy between shells.
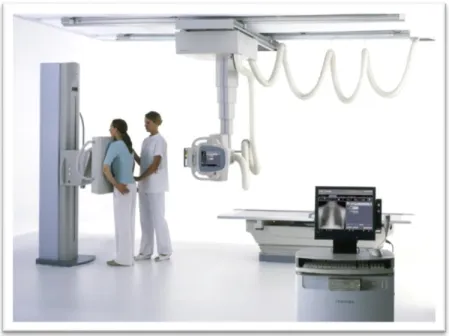
The visible photons produced by the scintillating screen are then captured through some sort of an electronic light sensor, often directly flush to the scintillating screen, allowing for the greatest light collection. A typical design is shown in Figure 2. These combined scintillating screen and electronic light sensor in one flat device are called radiography plates, and these are currently used in many hospital settings as they are easily placed on or around patients lying in beds for them to be imaged. An image of these plates can be seen in Figure 3. In many hospital setting these plates are mounted to fixed equipment, and the x-ray imaging device comes as one large product meant to reside in a standalone room for x-ray imaging.
Figure 1: traditional chest x-ray image in the negative, with areas of greater x-ray
attenuation shown lighter (bones and areas of higher tissue density) and the lungs shown as darker. [6]
- 13 -
Figure 2: Image of a Cesium Iodide (CsI) radiography screen with CsI used as the scintillating material and a photo immediately adjacent to the CsI crystals to turns the light generated into electrical impulses to form and image [7].
Figure 3: Toshiba medical radiography machine, with patient standing against a vertically placed DR plate. As can be seen, this equipment is quite bulky and large, and meant for a stationary hospital room [8].
- 14 -
2.1.2 Digital Radiography (DR) Detectors
The current x-ray imaging standard of care, especially in high income countries, is to use DR plates, or flat panel detectors, for collecting patient images. DR plates are solid electronic components in which the scintillating material is directly connected to the imaging sensor and often come as a single standalone component (see Figure 2). These plates are quite expensive, anywhere from $22,000 to $46,000 dollars without the cost of the rest of the equipment needed for the imaging, much more than is feasible in many developing countries [9], and can reach 100-200 microns in their resolution [10].
Flat panel detectors come in one of two types and can either be direct detectors, where an incident x-ray directly generates and electrical impulse, or indirect detectors where x-rays generate some sort of excitation (often visual light) which is detected and turned into an electrical signal. Direct detectors are often made of silicon and the incident x-rays create electron holes that are detected as potential differences. Indirect detectors first have a scintillating materials which create visible light upon being hit by incident x-rays. These are called scintillating screens, and are describe below. This visible light is then detected by an optical image sensor (such as a CCD chip in cameras) that turns the signal into a digital signal.
Both of these types of flat panel detectors turn the electrical signals into an image that can then be directly interpreted on a computer. This is in contrast to the historically prevelant way of x-ray imaging when x-rays would travel through the object to be imaged and fall incident on x-ray film, which would later be developed and an image would be visible directly on the film. The conversion of these images to electronic media allows them to be easily stored and retrieved, and reduces the burden of acquiring and developing x-ray imaging film and solves the problem of physically storing and retrieving film. This is at odds with the past argument for film in that it does combine the imaging and storage into a single unit.
- 15 -
2.1.3 Scintillating Screens
Scintillating screens are made from materials that create visible light upon being struck by incident radiation of some form. In this particular experiment, the scintillating materials generate light after being struck by x-rays. The material absorbs the x-rays when the x-rays strike the material, imparting energy into the electrons, and the x-ray energy is then re-released as visible light through the subsequent fall of electrons down the atomic orbital, where the energy of the emitted light is equal to the energy difference between the orbitals. The amount of light produced is directly proportional to the number of x-rays that are incident on the scintillating material, unless the material reaches saturation which would require very high x-ray doses outside of the range for medical imaging. Scintillating screens are made out of a variety of different materials, depending on the purpose, as certain materials can produce more light or be less diffuse and have a higher resolution. Some materials also work better for different types of radiation and emit light at different colors allowing them to be designed to the image sensor. These materials are often made of cesium iodide (CsI) or gadoliniun oxysulfide (Gd2O2S) when used in medical x-ray imaging
settings [10]. Typically, about 15% of the absorbed x-ray energy is converted to visible photons.
2.2 Imaging
2.2.1 General Camera Imaging
Modern Cameras
Cameras, particularly digital cameras, are largely ubiquitous in the modern world, and daily the price of consumer electronics continues to drop as industry continues to decrease circuitry size. This allows for increasingly higher density circuits to be put on a single chip, ever increasing the resolutions that can be achieved on consumer cameras. Before the advent of modern electronics, images were traditionally captured on film yet, achieving a relatively high resolution (approximately 87 MP) on standard 35 mm film, yet creating a problem in transportability and ease of access to this film as the images would only be captured on a single piece of film. Modern
- 16 -
imaging and electronics are significant in the field of radiology in that images can now be stored digitally and transmitted and read over the internet. These images can be stored in various electronic media storage devices and condensed, and reduce the burden of having to have a supply of x-ray film to capture the images on as well as having the possibility of “teleradiology” where the images may be sent to remote radiology centers for interpretation.
Modern higher-end electronic cameras are traditionally digital single-lens reflex (DSLR) cameras, cameras built off the of “single-lens reflex” paradigm with a digital sensor. The cameras allow the user to see exactly what the image is they are going to capture through the camera view. These cameras are “full-field” meaning that they capture images on a chip that is approximately 35 mm (24mmx36mm, or a total of 864 mm2), or the size of standard imaging film. As an example of a “high end” camera, and the high-end camera use in this study, a Nikon D810 has 36.3 megapixels in a 7360 x 4912 array, 36 x 24 mm, resulting in 4.89 micrometers x 4.89 micrometers pixels [11].
Standard chest x-rays are 14”x17” [9], translating to a relative magnification of 12:1 from the size of the standard camera sensor chip to the size of the chest x-ray screen. The 12:1 ratio leads to a pixel size of 58.7 micrometers respectively at the size of a scintillating screen, capping the resolution at this size, smaller in size (by a factor of 2-4) to that of flat panel DR detectors, discussed earlier. Thus, it is not important to get a high resolution chip as it will be able to image larger biological structures easily. The lenses of these high-tech cameras have several key settings which impact how photos are taken, namely the aperture (f-stop) and the focal length of the lens.
The combination of magnification and lens aperture are critical in determining the sensitivity of the system. It is critical that the light from the scintillation screen be efficiently coupled to the camera sensor for the lowest possible dose to the patient. The import of the magnification and lens aperture are discussed below.
I. Aperture (f-stop, or f-number)
The aperture (represented by the f-stop) is the size of the opening of the lens, and a lower f-stop number represents a larger opening. The size of the aperture changes the depth of field, or
- 17 -
sharpness in front of or behind the object of interest, yet this is not relevant in imaging a flat surface where the surface is at a fixed distance from the camera. The challenge is that with a larger aperture, it is more challenging to have a perfect focus yet this can be solved through automatic focusing. Thus, the lower the f-stop the better as more light can be captured.
II. Focal Length
The focal length is inversely proportional to how wide the cameras field of view is and thus the zoom of the lens. With a higher focal length there is a smaller field of view, and thus it is a “narrower” and more zoomed in image. For this project, a shorter focal length for the lens is equivalent to being able to put the imaging device close to the scintillating screen, thus reducing the geometric light loss as light travels from the scintillating screen to the lens of the camera to be collected.
Camera Properties
In addition to the focal length of the lens and the aperture of the lens, internal camera settings can be changed which affects how the photos are taken – the shutter speed and the ISO.
I. Shutter Speed
The shutter speed is the length of time the shutter of the camera, or the material blocking light from reaching the CCD chip in the camera, is open. This strictly affects the amount of light that is able to reach the CCD chip of the camera. With a higher shutter speed, fast moving objects are able to be captured more clearly, whereas with a lower shutter speed more light is captured yet this yields a blurry image for moving objects.
II. Film Speed (ISO)
The ISO number (a carryover from physical film specifications) is the light sensitivity of the camera, and in modern digital cameras is often an automatic setting that is adjusted per the light
- 18 -
level of the surroundings. As the ISO increases so does the light sensitivity of the chip, yet at the same time so does the noise of the chip in low-light settings. Thus, there is a trade-off in increasing the ISO yet in general for the purposes of this experiment, a higher ISO is better until the chip is at the maximum light level, at which point everything becomes “bright” and there are no distinguishable features [12].
III. Focus
The focus of the camera is manually (or mechanically by the camera) adjusted on a photo-by-photo basis. The focus is related to the ratio from the object to the lens and the lens to the CCD chip in the camera, or the f-stop. Depending on the distance from the camera to the object of imaging interest, the focus will have to be adjusted accordingly. The further the camera is from the object of interest, the larger the depth of field is.
2.2.2 Modulation Transfer Function (MTF) Curve
The MTF curve is a measure of the optical performance of an imaging device (such as a camera), and represents the spatial frequency response of an optical system, and in this way measures the optical acutance, or the sharpness, of the image. The MTF curve is a multiplicative value, and thus multiple visually distorting devices in series will have MTF curves that are multiplied by one another. Further, MTF curves are often linear and can be approximated as such [14]. A value of 1.0 on an MTF curve indicates 100% transmittance of light, and any number below 1.0 indicates in imperfect transmittance of light, with 0.0 indicating that there is no distinguishable difference across the image [11] (i.e. a monochromatic image). The MTF value is calculated with:
(1) 𝑀𝑇𝐹 =𝑖𝑚𝑔𝑒𝑥𝑝−𝑖𝑚𝑔𝑎𝑐𝑡𝑢𝑎𝑙
𝑖𝑚𝑔𝑒𝑥𝑝
where imgexp is the maximum pixel value (or brightness) and imgactual is the minimum pixel value.
The MTF number represents a ratio between the actual and the expected value. An MTF curve is plotted on a graph of percent contrast difference on the vertical axis and line pairs per millimeter (lpm) on the horizontal axis. The MTF values are measured using a resolution chart with varying lpm, indicating when two lines are so close together that they can’t be visually distinguished. In x-ray imaging, these MTF curves are often produced using lead resolution screens, as shown in
- 19 -
Figure 4. When the x-ray image is taken of the chart, the darker portions are those that went
through the lead (the imgactual) and the lighter portions (imgexp) are the un-attenuated x-rays.
Figure 4: Image of a lead resolution screen used for measuring the resolution of an x-ray imaging device. This lead resolution screen goes from 0.6 lpm to 10.0 lpm.
2.2.3 Cell Phones
The current digital revolution has led to the ubiquity of cell phones that have the ability to both take increasingly higher resolution photos and transmit the photos in an efficient manner over the internet. Two critical problems are faced when using cell phones in that they can vary greatly in their image taking capabilities and they have a very small sensor area limiting the light collection that is possible with a cell phone camera. This light loss is purely a result of the mathematical geometric losses of the light as it travels from the screen to the cell phone camera. Thus, cell phones explored in this study as a lower-end option for x-ray imaging. Certainly, cell phones are also incredibly useful in making sure that the images that are taken can be communicated efficiently over cell-phone networks to doctors who can read and interpret the images.
- 20 -
2.3 TB as a Model and Target Disease
TB is a “disease of poverty” as it largely only affects those in developing countries. 4,500 people die every day from TB around the world, making it the fourth highest killing disease in the world [2]. The number of people in the world with TB at the moment is increasing at an alarming rate, and 95% of these cases occur in developing countries [12]. TB was determined to be an ideal model and target disease for this x-ray imaging device as it has a high incidence, is not being effectively imaged, is largely a disease in developing areas of the world that don’t have access to x-ray imaging, and can be easily diagnosed with chest x-rays. TB is also a fairly visible disease in the lungs and thus presents a reasonable target for chest x-ray imaging.
TB is an illness that presents as nodules of tuberculosis bacteria that have infected the lungs. Specifically, TB presents with “evenly distributed diffuse small 2-3-mm nodules, with slight lower lobe predominance”, sometime described as a snowstorm, at the smaller end, and up to 5 cm in diameter for larger TB nodules [13]. TB has a density and composition roughly similar to the surround body tissue, and this density approximation will be used throughout this study.
2.4 X-ray Imaging Safety
It must be noted that with exposure to x-rays in x-ray imaging, as with all forms of exposure to ionizing radiation, has potential health risks associated with it. Ionizing radiation is radiation with enough energy that it can liberate electrons from atoms, creating ions. These ions lead to cellular and DNA damage in living organisms, which can, if in a high enough density such that cellular mechanisms cannot repair the DNA quickly enough, lead to cancer [19]. It is recommended that ionizing radiation exposure be kept to a minimum, keeping to the “As Low As Reasonable Achievable” (ALARA) principle. The International Atomic Energy Agency (IAEA) notes that it is expected the chest x-ray images will be about 1.5 mGy, and chest CT scans are typically 30-40 mGy, both less than 100x the acute lethal dose of around 5 Gy [20]. For this study, a dose of 1.5 mGy will be the benchmark for imaging with the knowledge that if a lower dose is achievable for a suitable cost and resolution, that dose will be used.
- 21 -
2.5 Current State of Research
The concept of x-ray imaging using consumer electronics is an area that has been explored by several different research groups [9] [10] [11], yet not rigorously in such a way as to optimize the design and provide specific recommendations for all of the components of the system. All of the groups that have researched using consumer electronics for x-ray imaging have used the same basic paradigm as described in Figure 7: Diagram of the overall ray imaging setup with the x-ray tube, the object to be imaged, the scintillating screen, the mirror and the camera. This diagram is not to scale and rather shows the relative relations and the overall layout of the device. with an x-ray source, a scintillating screen, and a camera/imaging device. Panna et al. in 2015 explored the relative advantages of using a Nikon D700, a Nikon D800, and a Nikon D3X and consistently found that the “homemade” detectors had better sensitivities than commercial flat panel detectors by at least 2-fold. Winch et al. in 2011 found that with a CsBr:Eu2+, the MTF curve reached 0.2 at 2.25 lines pairs per millimeter using a Canon D5 Mk II camera at an approximate dose of 1 mGy, semi-equivalent to the current medical standards in terms of dosage. Fan et al. posits that, using a D700, similar resolution and noise values are achievable as compared to flat-panel detectors. Fan also notes that there is currently a shortage in analysis of DSLR DR imaging as compared to screen imaging and as compared to traditional flat-panel imaging. Fan et al. took the DSLR concept and used it in conjunction with health care facilities and radiological imaging in Nepal.
In all of these studies there are several critical areas, namely that of the scintillating screen, the imaging device, and the x-ray source, that must be optimized for the best images to be taken within a safe limit of x-ray radiation exposure for the user. These areas are the f-number of the lens, a measure of light gathering ability, which is proportional to the effective size of the light collection area and thus the number of photons that are collected, the resolution of the imaging chip, the light produced by the scintillating screen, and the contrast of the scintillating screen. It must be determined if the resolution of the chip or the resolution of the scintillating screen is the limiting factor. Further, it must be determined what focal spot size of x-ray tubes of sufficient for these medical imaging purposes.
- 23 -
Chapter 3: Proposed Solution and Design
3.1 Parameters for the X-ray Imaging Device
3.1.1 Human Physiology and Attenuation
3.1.1.1 X-ray Attenuation in TB Nodules
The design presented in this study is based on both the goal to have a system which could potentially cost less than $1000 and which can easily image and track the progress of TB throughout its progress and treatment. The design parameters for the x-ray imaging device are further informed by current literature as well as experiments performed in this study. Of primary concern for this x-ray imaging device is the capacity to image TB bacteria nodules in human patient’s. These TB nodules present either in a “snowstorm” appearance of many 1-5 mm nodules, or larger 0.5-5 cm conglomerations of nodules, or even empty spaces in the lung tissue. For the purposes of designing an imaging parameter, it will be approximated that a “positive” TB result on the x-ray image is 1 cm or greater of TB tissue in nodule form visible on the radiographic image or abnormal lymph nodes of the same size, as described by Bhalla et al, Bhatt et al, and Leung et al [5] [14] [15]. The TB nodules will present largely in the lower parts of the lungs due to the increased blood flow and the effect of gravity on the bacteria in the lungs. The signs of either pulmonary lung nodules of abnormal lymph nodes, coupled with fever, loss of appetite, loss of weight, chest pain, or difficult breathing should be the cause of a high suspicion for TB [5], as can be seen in Figure 5.
- 24 -
Figure 5: patient with late-stage TB in Nigeria. Notable are the signs of weight loss to a point that is a health hazard to the patient [24].
TB infection in the lymph nodes or due to the growth of TB nodules in the lungs will have a tissue density similar to that of human tissue, and any discrepancies in the density will be manifested by only a small change in the attenuation. The human tissue x-ray attenuation, approximated as the attenuation for TB nodules, is 2 ∗ 10−1 𝑐𝑚2
𝑔 (see Chapter 8, Section II, Figure 19) for 40 KeV
x-rays (100 KVp). X-rays are attenuated according to the equation
(2) 𝐼
𝐼0 = 𝑒 −𝜇𝑥𝜌
Where I is the intensity, µ is the linear attenuation, x is the distance, and ρ is the density. In calculating this attenuation for 100 KVp x-rays incident on TB nodules, the attenuation is 2 ∗
10−1 𝑐𝑚2
𝑔 , the thickness of the nodule is 1 cm, and the density is 1.06 𝑔
𝑐𝑚3 [16]. Thus, 𝐼 𝐼0 =
𝑒−0.2∗1.06∗1 = 0.81. From this result, it is expected that there is a 19% attenuation (or more, with
a greater diameter) in intensity of 100 KVp x-rays due TB nodules in human tissue at the widest
point. It is noted that towards the edges of the TB nodules, the intensity of the attenuation will decrease due to the roughly spherical shape of the TB nodule. 19% is used as the threshold of x-ray difference for distinguishing TB from surrounding tissue for the remainder of this study.
- 25 - 3.1.1.2 Human Thorax Physiology
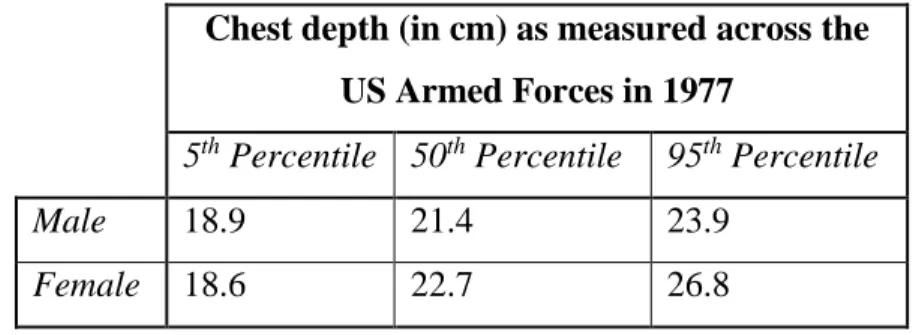
The human thorax is largely composed of the rib cage, the skin and tissue surrounding the rib cage, and the heart and lungs within the thorax. The average depths of the human thorax for both men and women are shown below in Table 1.
Chest depth (in cm) as measured across the US Armed Forces in 1977
5th Percentile 50th Percentile 95th Percentile
Male 18.9 21.4 23.9
Female 18.6 22.7 26.8
Table 1: Average chest depths for men and women in the US Armed Forces. It can be seen that the maximum chest depth for the 95th percentile of women is 26.8 cm, which should cover more than 95% of this population (accounting for lower rates of obesity in many developing countries with high incidence of TB). This number of 26.8 cm will be used for depth of choice in this study [26].
3.1.2 Distinguishing Between TB Nodules and Surrounding Tissue
As described in the previous section, TB nodules will attenuate 19% of the incident 40 KeV x-rays, yet in noisy x-ray images, these nodules will not be distinguishable from the surrounding tissue as there may be low contrast between the nodule and the surrounding tissue. The level of noisiness inherent in the image can be quantified through a measurement called the read noise of the image, which tells us how much noise is inherent in the image. If the difference in the image brightness between where the TB nodule is and where the surrounding tissue is different with more than 95% confidence, then it can be considered likely to be TB.
Using a two-sample t-test, it can be determined what the likelihood that a particular area of the image (represented as a sample of brightness’s) is different from the surrounding tissue (in this
- 26 -
case the TB tissue and the normal lung tissue). The t-value, for two distributions with the same number of samples and the same standard deviations, can be calculated with the equation: (3), (4) 𝑡 =𝑀1−𝑀2 𝑠𝑝√2𝑛 , 𝑠𝑝 = √𝑠𝑀1 2 +𝑠 𝑀22 2
Where M1 and M2 are the respective means of the two distributions, sp is the combined standard
deviation of the two distributions, sM1 and sM2 are the respective standard deviations of the two
distributions, and n is the number of samples for each of the distributions. Given that in this experiment there will be a large number of “samples”, or pixel values, the number of samples will be large. Assuming that there are at least 100 pixels in each sample, the t-value for the one-sided t-test is 1.660 using a standard t-test chart. The two standard deviations for the sample and the baseline are the same as they both represent the inherent “error”, from the read noise, in the camera.
3.1.3 Optimization and Design:
In determining the parameters that should be optimized for the best user design, two key areas must be detailed to determine relative importance in design considerations: photon efficiency and resolution analysis. The photon efficiency analysis relays information as to how much light, from the initial input power, is captured and turned into an electrical signal to form an image. The resolution analysis relays information as to how detailed the final image is. For example, this x-ray imager could create a bright image without any detail, or a dark image with clear detail, neither of which are provide useful information in medical imaging.
3.1.4 Photon Efficiency and Resolution Analysis
To determine the largest sources of error, the net efficiency, and to perform a sensitivity analysis to determine parts of the design where the design can be optimized, an overall analysis of the sources of error and loss in efficiency is performed on the design.
- 27 - a) Photon Efficiency Calculation:
Using the model presented in Figure 7, the efficiency calculation will be broken into 5 main components.
1) X-ray Tube Efficiency: the x-ray tube efficiency of turning power into x-rays. It is estimated that the x-ray tube turns ~1%
of the energy put into the x-ray tube into x-rays, yet this is a factor that cannot be controlled and is controlled by the physics of the system. This efficiency will be called 𝜂𝑥.
2) Geometric Efficiency of Scintillating Screen: the screen efficiency is limited by the solid angle of space around the x-ray tube that it covers, which will be label as 𝜔𝑠. This solid angle is calculated with the equation, 𝜔𝑠 = 4 ∗
sin−1( 16
√(𝑙2+4𝑑2)(𝑏2+4𝑑2)) [10], where l
is the distance from the x-ray source to the scintillating screen, d is the width of
the scintillating screen, and b is the height of the scintillating screen as seen adjacent in
Figure 7.
3) Efficiency of Scintillating Screen, 𝜂𝑠: the efficiency of the scintillating screen is contingent on the thickness of the scintillating screen and scintillating screen material properties. The efficiency describes the number of photos that come out of the scintillating screen relative to the total number if all of the x-rays incident on the scintillating screen were to be turned into visible light. This is the same as the energy of x-ray converted to visible light. With a greater thickness of the scintillating screen, more x-rays are absorbed in the material but the light that is generated has a greater blur from the dispersion of the light in the material. 4) Efficiency of the Lens, 𝜂𝑙: the efficiency of the lens is both geometric and due to light loss in the lens. The efficiency of the lens comes from the portion of the light coming from the
Figure 6: Diagram of the x-ray source and the scintillating screen with the relevant dimensions for use in the measurement of the solid angle of the scintillating screen relative to the x-ray source. This solid angle is described by the equation 𝜔𝑠 = 4 ∗
𝑠𝑖𝑛−1( 16
- 28 -
scintillating screen that is collected by the lens and from the light lost in the lens as it makes its way to the CCD chip in the camera.
5) Efficiency of the CCD Chip, 𝜂𝑐: the proportion of photons that are turned into an electrical signal on hitting the CCD chip.
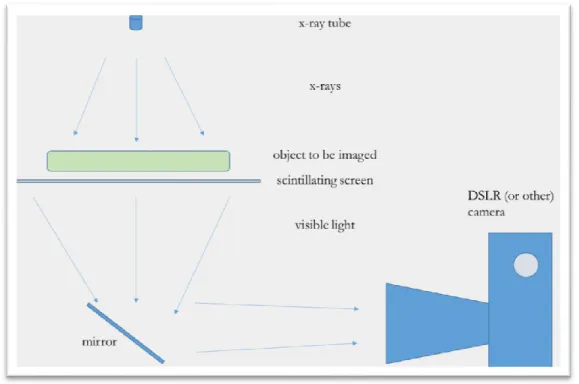
Figure 7: Diagram of the overall x-ray imaging setup with the x-ray tube, the object to be imaged, the scintillating screen, the mirror and the camera. This diagram is not to scale and rather shows the relative relations and the overall layout of the device.
Net efficiency
Using all of the above terms, the net efficiency of the x-ray, as a fraction of 𝑐𝑜𝑙𝑙𝑒𝑐𝑡𝑒𝑑 𝑒𝑛𝑒𝑟𝑔𝑦
𝑖𝑛𝑖𝑡𝑖𝑎𝑙 𝑒𝑛𝑒𝑟𝑔𝑦 is
shown below in Eqn. 2.
(2) 𝐸𝑥−𝑟𝑎𝑦 = 𝜂𝑥∗ (4 ∗ sin−1( 16
√(𝑙2+4𝑑2)(𝑏2+4𝑑2))) 𝜂𝑙∗ 𝜂𝑐
Thus, if Ein joules are put in to the system as electrical energy, then Eout=Ex-ray*Ein energy is
collected by the CCD chip. Stated in terms of photons, where ninitial is the initial number of photons
- 29 -
(6) 𝑛𝑓𝑖𝑛𝑎𝑙 = 𝑛𝑖𝑛𝑖𝑡𝑖𝑎𝑙 ∗ 𝜂𝑙∗ 𝜂𝑐
b. Resolution Loss Analysis
In determining sources of error in the x-ray imaging system, the x-ray tube, the scintillating screen, and the camera lens and camera CCD ship all need to be taken into consideration. This resolution loss analysis is conducted using the MTF curves, representing the spatial clarity of the image, for each part of the imaging device.
1) X-ray Tube: x-ray tubes have a parameter called the spot size which determines the potential level of accuracy of the x-ray image. The spot size is the size of the part of the x-ray tube that produces x-rays, and thus, if the x-rays all came from a pinpoint then they would produce a perfect image, and if they came from a very large area then the image would be very diffuse. Further, if the spot size is too small the x-ray tube cannot remove heat quickly enough and it will melt. For medical uses, the x-ray tube must be sufficiently large to take many images and not overheat, introducing a measure of error into the image. This error is dependent on the magnification and is given by the Frequency Response Function (FRF):
(7) 𝐹𝑅𝐹 =
sin(𝜋∗𝑓∗𝑎∗( 𝑑2 𝑑1+𝑑2)) [𝜋∗𝑓∗𝑎∗( 𝑑2
𝑑1+𝑑2)]
where f is the spatial frequency of the object to be imaged, a is the focal spot size, d1 is
the distance from the x-ray source to the object being imaged, and d2 is the distance
from the object being imaged to the scintillating screen [25]. The theoretical MTF value due to the x-ray tube is further discussed in Appendix section III. For the purposes of measuring the resolution with a resolution chart, the x-ray tube spot size effect on the resolution is negligible (<0.3%, see Appendix section III). This resolution decrease effect on the imaging of a person will be more significant where the width of a person’s chest will be a significant fraction of the distance from the x-ray tube to the scintillating screen.
- 30 -
2) Scintillating Screen: the scintillating screen causes error in the final image as it causes light to diffuse through the scintillating screen creating a blurring effect. The thinner the scintillating screen the less blur there as, yet the less output there is. Thus, for a thicker scintillating screen, a much faster (and thus lower dosage), x-ray image can be taken, yet the image will have a poorer quality. For a thicker screen, the image will be blurrier, thus there is a limit for how thick the screen can be for it to be useful despite the increasing light output. In addition, there are material considerations for the scintillating screen in that materials that are more expensive can create higher light output and better resolution images, yet this has its own associated costs. The error for the scintillating screens is highly material dependent, with several examples presented in the experimental section.
3) Camera Lens: the camera lens can introduce errors in the final image from deviations in the lens curvature, yet modern lenses are made with a very high quality and introduce limited defects. The value of the MTF curve for a particular lens is dependent on the lens.
After determining the MTF curves for the x-ray tube, the scintillating screen, and the camera lens, the three can be multiplied together to find the net MTF curve for the system.
3.2 Putting it All Together
To determine the needs of the imaging system, all of the above factors in the efficiency and resolution analysis must be taken into consideration in conjunction with the design specifications. As discussed, it is hoped that TB nodules of 1 cm in diameter and larger can be imaged and distinguished from surrounding tissues. For this to be possible, the x-ray image will have to be able to detect the 19% attenuation of x-ray in the tuberculosis tissue within the imaging setup. These needs will be discussed later in the thesis with the specific imaging setups which reflect the
- 31 -
constraints of the system. The analysis presented in this section is further aimed to assist in future x-ray imaging and x-ray imaging equipment analysis and improvement.
- 32 -
Chapter 4: Design Approach
The design approach of this thesis was framed by first optimizing safety, and then cost and usability in the context of low resource settings. In order to frame safety, it was determined how low of a dose was needed to make sure the x-ray imager effectively posed no threat to the health of the patients, and would not accidentally lead to any harm. This dosage was based on the current standards for medical imaging dosing.
Cost
In conceptualizing the cost optimization, there are several key components that cost large amount of money. It is determined which will quality of components be suitable for creating x-ray images which are of sufficient quality for medical imaging. The three components which make up a majority of the cost are the x-ray tube, the scintillating screen, and the camera/imaging device itself. The camera and the scintillating screen, as described previously, largely contribute to most of the error in the setup, and based on initial analysis it seems likely that a very high resolution camera is not needed to take x-ray images. This is because the resolution of the camera is relatively high for this imaging, and the camera has the capacity to take photos with resolution on the order of 100-200 microns, smaller than is needed for x-ray imaging. Further, the lens defects are not a significant contributor to the error in the image.
To estimate the cost, the components of the experimental setup with the highest imaging resolution were used, specifically in terms of scintillating screen, camera, and lens, and an affordable and workable x-ray tube. The total estimated cost comes out to $1,565.00 as shown in Table 2. This cost is solely based on the price to presently purchase the materials used, and does not take into account any discounts for bulk orders or price decreases with increased production volumes.
- 33 -
Table 2: Estimated costs for the total x-ray imaging system using the most expensive and highest resolution x-ray imaging setup used in this study [28] [29] [30] [31].
Usability
Modern x-ray machines are designed to be able to take images on all sides of a patient who is lying in a bed so that all angles and various different body parts can be imaged with minimal patient movement. As this study is exploring an x-ray imager that is supposed to be more preventative and catch diseases in their earlier stages, the machine is designed to largely be able to take chest x-rays yet could be used for other purposes. Chest x-rays are the focused for this initial design. Further, this device will not work well for patients lying on a bed as it is meant to be largely preventative, and thus patients with tuberculosis who are stuck in a bed are already likely on treatment, and it is the patients who do not yet have the disease to an large extent that the work of this study aims to capture. In order to be able to image patients who are not able to leave bed, it would require a significant amount of extra effort to be able to image through the bed and work around the existing infrastructure. Thus, this device is focused on imaging patients who are able to stand.
The design of this device is such that it can be used with a single button press so as to remove room for human error, and make the training for use relatively simple in low-resource environments. This single-use functionality will be such that it can accommodate the largest range of patients while still being usable, functional, and safe. Given the nature of x-ray imaging, it is expected that across patients imaged with x-rays of 100 kV, there will be a variation across the samples, with the most error in patients who have the largest chest depth. The high end of the chest depth is 26.8cm, of which it will be assumed the 2/3 is chest tissue while the remaining 1/3 is open space (or 17.9 cm of tissue). The design thus must take into account up to a 97.8% attenuation of x-rays passing through the human chest.
Scintillating Screen $ 281.01 f/1.4 lens $ 329.00 DSLR Camera $ 289.99 X-ray Tube $ 465.00 All Other Equipment $ 200.00
Total $ 1,565.00
- 34 - Safety
As stated in section 2.4, this project abides by the “ALARA”, or “as low as reasonably achievable” principle in radiation exposure. The images taken for this project were taken with an x-ray tube at 100 kVp, or an approximate of 40 kV average, and for at least 1/30th of a second. Taking the chest
to be about 1/100 of the solid angle carved out by the x-ray tube radiation (approximately 0.95% of the total spherical solid angle if the person is 3’ from the x-ray source), it is possible to calculate the approximate dosage to the person being imaged. The calculated dose is approximately 1.4 mGy given these conditions, very close to the 1.5 mGy standard for chest x-rays and 1000x below the lethal dose for radiation.
𝐷𝑜𝑠𝑒 (𝐺𝑦) = 10𝑚𝐴 ∗ 40𝑘𝑉 ∗ 1 30∗ 1 𝑠∗ 1 25(𝑔𝑒𝑜𝑚𝑒𝑡𝑟𝑖𝑐 𝑓𝑎𝑐𝑡𝑜𝑟) 70𝑘𝑔 ∗ 19% 𝑎𝑡𝑡𝑒𝑛𝑢𝑎𝑡𝑖𝑜𝑛 ≅ 1.4 𝑚𝐺𝑦 Experimental Specifications
Incorporating the various design specifications, a test imaging setup was built, shown below in Figure 11. This setup was such that both a Nikon D810 (with a Nikkor 50mm f/1.4 lens) and a iPhone 5S Camera could take photos, and different scintillating screens could be swapped out for each other, all for more versatile and complete testing. The Nikon D810 with a 50mm and f/1.4 Nikkor lens and iPhone 5S with an f/2.2 lens were selected as the represent two ends of the spectrum of being able to collect a significant amount of light and only being able to collect a small amount of light. As the iPhone lens has a wider field of view than the Nikkor lens (and thus will be closer to the scintillating screen when imaging), the constraining factor was the distance needed for a full field of view of the screen with the Nikkor, which is exactly 20.0”. The mirror used in the experimental setup was smaller than would be needed to capture the full 17”x14” area for experimental simplicity, and was sufficient for all of the experiments done in this study.
- 35 - a) Nikon D810 with 50mm f/1.4 lens
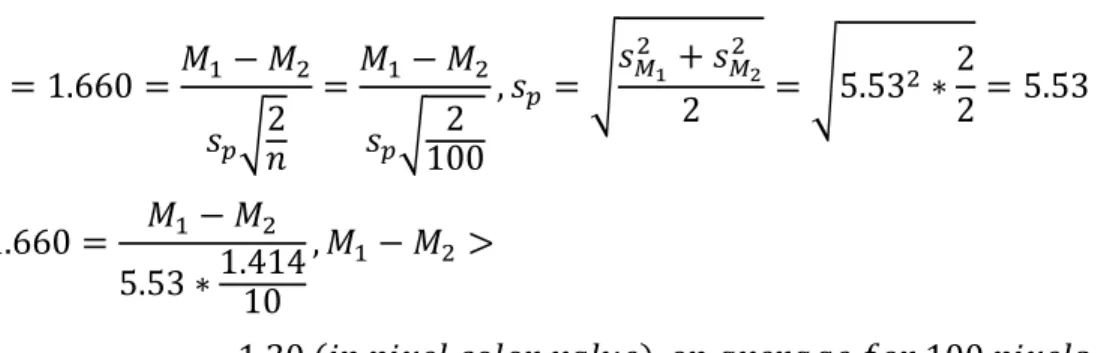
Shown below in Figure 8 is the MTF curve for the 50mm f/1.4 lens. For this study it is estimated that this lens has an MTF value of 0.8 for 10 LPM and 0.5 for 30 LPM. The read noise inherent in the Nikon D810 camera is 5.53 (units of pixel value variations), and this is the standard deviation of the pixels values summed across all 3 color inputs. In order to distinguish a TB nodule from surrounding tissue, the t-test is used to determine the necessary difference in brightness:
𝑡 = 1.660 =𝑀1− 𝑀2 𝑠𝑝√2 𝑛 =𝑀1− 𝑀2 𝑠𝑝√ 2 100 , 𝑠𝑝 = √𝑠𝑀1 2 + 𝑠 𝑀2 2 2 = √5.532 ∗ 2 2= 5.53 1.660 = 𝑀1− 𝑀2 5.53 ∗1.41410 , 𝑀1− 𝑀2 > = 1.30 (𝑖𝑛 𝑝𝑖𝑥𝑒𝑙 𝑐𝑜𝑙𝑜𝑟 𝑣𝑎𝑙𝑢𝑒), 𝑜𝑛 𝑎𝑣𝑒𝑟𝑎𝑔𝑒 𝑓𝑜𝑟 100 𝑝𝑖𝑥𝑒𝑙𝑠
Figure 8: MTF curve for the Nikkor f/1.4 50mm lens. The y-axis is the MTF value and the x-axis is the measure of mm from the center of the image to the edge. Shown are two different measurements at 10 LPM and 30 LPM (red and blue, respectively) for sagittal and meridional measurements. For the purposes of this study, it is assumed that this lens has an MTF value of 0.8 for 10 LPM and 0.5 for 30 LPM
- 36 - b) iPhone 5S
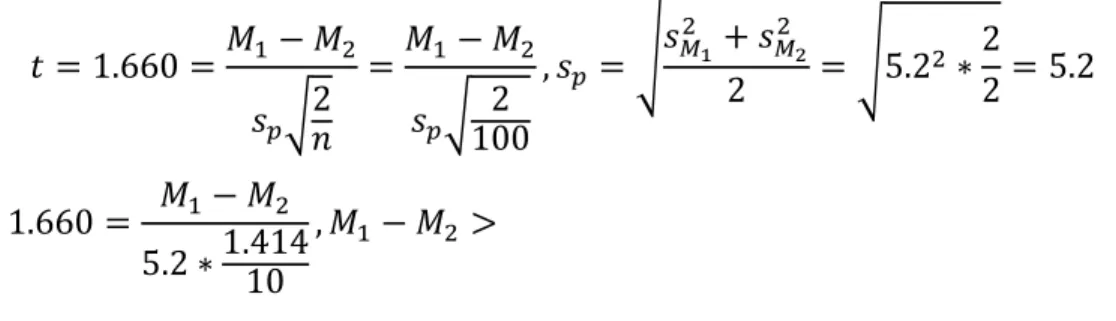
The iPhone 5S is a relatively good yet cheap phone camera, representing some of the higher quality in cheaper consumer electronics. The iPhone 5S lens is 6mm and f/2.2. The read noise inherent in the iPhone 5S camera is 5.2, and this is the standard deviation of the pixels values summed across all 3 color inputs. In order to distinguish a TB nodule from surrounding tissue, the t-test is used to determine the necessary difference in brightness:
𝑡 = 1.660 =𝑀1− 𝑀2 𝑠𝑝√2 𝑛 =𝑀1− 𝑀2 𝑠𝑝√ 2 100 , 𝑠𝑝 = √𝑠𝑀1 2 + 𝑠 𝑀2 2 2 = √5.22 ∗ 2 2= 5.2 1.660 = 𝑀1− 𝑀2 5.2 ∗1.41410 , 𝑀1− 𝑀2 > = 1.22 (𝑖𝑛 𝑝𝑖𝑥𝑒𝑙 𝑐𝑜𝑙𝑜𝑟 𝑣𝑎𝑙𝑢𝑒), 𝑜𝑛 𝑎𝑣𝑒𝑟𝑎𝑔𝑒, 𝑓𝑜𝑟 100 𝑝𝑖𝑥𝑒𝑙𝑠
The iPhone 5S camera has an experimentally measured MTF curve shown in Figure 9.
Figure 9: MTF curve measured for an iPhone 5S and fit with a 3rd degree polynomial to a high degree of precision (R2=0.96).
- 37 -
c) MCI Optonix DRZ-High Scintillating Screen, Luminex Ultrafine Scintillating Screen, and Luminex Medium Scintillating Screen
The three scintillating screens, the MCI Optonix DRZ-High Scintillating Screen, Luminex Ultrafine Scintillating Screen, and Luminex Medium Scintillating Screen, all have published MTF values which are shown below in Figure 10 with extrapolated lines of best fit.
Figure 10: MTF values for three scintillating screens: MCI Optonix DRZ-High Scintillating Screen, Luminex Ultrafine Scintillating Screen, and Luminex Medium Scintillating Screen [32] [33]. Linear fits are extrapolated from these data points to get a sense of the MTF curve.
Experimental Setup
The experiment was setup as shown in Figure 11. The setup was built with a rigid frame to prevent movement, and was set to be able to house the Nikon D810 and Nikkor f/1.4 50mm lens with its 20” screen to lens requirement. Further, the frame itself was similar in size to what would be expected for the final project. The overall frame also allowed for use of the iPhone 5S camera at a distance of 13.6”. Figure 12 displays the x-ray containment where the x-ray images were taken.
- 38 -
Figure 11: photo of the experimental setup with which x-ray images were taken. The distance of 20 inches from the camera to the screen is representative of how far away the camera has to be to capture a 17”x14” chest x-ray image on a scintillating screen. Visible on the scintillating screen itself are ½ inch markings, put in place to be able to focus the camera, as well as test the visible light resolution of the camera in non-x-ray imaging conditions. In this image, all of the components are mounted on the frame so that the frame can be easily moved into the x-ray imaging chamber. The imaging portion of the x-ray imaging device itself would need to be roughly this size for the real model.
- 39 -
Figure 12: Image of the x-ray imaging enclosure. The x-ray source itself is an electrically powered x-ray source that was run at 14 mA and 100 kV for the totality of the experiment. The outside containment is made of led to prevent ray from escaping the box, and the x-ray imaging setup was rested on the support platform. When imaging, the whole x-x-ray imaging setup would be put in the box, the door would be locked, the x-ray source would be turned on, and then an image would be taken.
Experimental Procedure
The Nikon D810 with the Nikkor f/1.4 50mm lens was set up 20” from the scintillating screen (the MCI Optonix DRZ High screen) with the intervening mirror setup as shown in Figure 11 and placed in the enclosure shown in Figure 12. The enclosure was locked and shielded with a 1” lead enclosure, blocking any radiation escape. The object being imaged was placed on top of the scintillating screen in between the x-ray tube and the scintillating screen. The x-ray tube was turned
- 40 -
on and run for a period of 20 seconds at 100 kVp and a current of 14 mA while photos were taken
at varying exposure times. A Cornish hen with a TB model, a camera, a watch, and a tomato were all imaged for proof-of-concept imaging. An x-ray resolution screen as imaged as well to quantitatively measure the performance of the setup. The scintillating screen was switched out for the Scintacor Luminex Medium scintillating screen after which images were taken, and was then switched out for the Scintacor Luminex Ultrafine scintillating screen after which more images were taken. The Nikon D810 was then substituted for the iPhone 5S Camera at a distance of 13.6” for sufficient distance to image a 17”x14” area, and the whole procedure was repeated. For the iPhone 5S, images were taken in video mode so that the image was automatically focused. Each x-ray photograph thus represents 1/30th of a second as the video was run at 30 FPS.
- 41 -
Chapter 5: Results
In this study, imaging with all possible permutations of the Nikon D800 and an iPhone 6S using MCI Optonix DRZ High, Scintacor Luminex Medium, and Scintacor Luminex Ultrafine screens was conducted to determine the range of effects of varying both the scintillating screen and the imaging device and to have a better overall understanding of the combined variations.
5.1 Initial “Proof of Concept” Results
An early prototype was setup for a nuclear science and engineering project design class (MIT Course Number 22.033) in Fall of 2017, in which the author collaborated with two other students (Rossana Iturbide and Gilberto Mota) on “Project PRISM” and took several images using the MCI Optonix DRZ High scintillating screen along with the iPhone 5S camera (f/2.2) and the Nikon D810 with a 50mm, f/1.4 lens. This project spun off this initial effort, and images taken by the author and collaborators in Project PRISM with this first setup, the initial “proof of concept” design, are included for their qualitative proof that this setup is effective in capturing nuanced x-ray images of organic and inorganic matter.
Images Taken with iPhone 5S
Two x-ray images below, shown in Figure 13 and Figure 14, display x-ray images taken with the iPhone 5S. Figure 13 displays an image of the Nikon D810 camera with all of the internal workings, as is visible on the MCI Optonix DRZ High Screen. Relatively good special resolution are visible as many of the smaller components that are approximately 1mm or less in size are visible. Figure 14 shows an image of a Cornish hen also taken on the MCI Optonix DRZ High Screen. Many of the larger bones are clearly visible and the TB model is visible in the middle. This image is presented without an photographic enhancement or image subtraction which would normally be present in medical x-ray images, and thus the contrast expected in the final version would be much higher than is visible in this image.
- 42 -
Figure 13: Image of a Nikon D810 Camera taken in the x-ray imaging apparatus. This image was captured with a 100 kV x-ray tube at 14 mA, a DCI Optonix DRZ High Screen, and an iPhone 6S. All the of internal workings as well as some of the circuitry is clearly visible. The contrast is relatively large on the component of this image as the camera is composed of both metals and carbon based plastics. As x-rays are attenuated much more in high Z materials, the metals will stand out clearly [24].
Figure 14: x-ray image of a frozen Cornish hen, taken with an iPhone 6S f/2.2 lens, the MCI Optonix DRZ High lens, and a 100 kV, 14 mA x-ray tube. Visible on the image are several bones of the Cornish hen, as well as a gradient from the various tissues within the Cornish hen. Also visible on the image is a TB model, an almond-filled M&M candy, with a diameter of 1.5 cm. This is roughly the size of TB and of similar composition, and given
- 43 -
that this image is taken with minimum exposure and x-ray intensity, this is a good indication that TB imaging with this setup will be successful [24].
Images Taken with Nikon D810 and a 50mm, f/1.4 lens
Images taken with the Nikon D810 with a f/1.4 50mm lens and the MCI Optonix DRZ High scintillating screen are displayed below in Figure 15 and Figure 16. Figure 15 shows an x-ray image of a watch. Many of the minute detail are visible, a number of which are less than 1mm in size and the watch face itself is 2 cm in diameter. These features include the watch frame, circuitry, and the hand of the watch. Figure 16 shows an x-ray image of a tomato that was approximately 3.5” long along the largest direction. The solid and aqueous regions are all visible in the tomato, indicating that fine details can be imaged, even in an object as small as a tomato. Both of these images are presented without any photographic enhancement, and are thus not as clear as they could be with additional enhancement. Standard x-ray imaging modifies the x-ray images to remove background and increase image contrast, which would make more details visible in the two images.
- 44 -
Figure 15: X-ray image of a watch taken with a Nikon D810 and Nikkor f/1.4 50mm lens, a MCI Optonix DRZ High scintillating screen, and a 100 kV, 14 mA x-ray tube. It is clear that many details within the watch are visible including one of the gears of the watch face and the thin plastic of the watchband [24].
- 45 -
Figure 16: X-ray image of a tomato taken with a Nikon D810 and Nikkor 50mm f/1.4 lens, a MCI Optonix DRZ High scintillating screen, and a 100 kV, 14 mA x-ray tube. The solid and aqueous parts of the tomato are distinct in visible in this image that shows a cross-section of the tomato. This visibility indicates that even smaller variations in density are visible using this x-ray imaging setup [24].
Quantitative Results with Two Imaging Devices and Three Scintillating Screens
Quantitative results of the relative performances of the iPhone 5S and Nikon D810 were collected, as described in the procedure, for all permutations of the imaging devices (iPhone 5S and Nikon D810) and the scintillating screens (MCI Optonix DRZ High, Scintacor Luminex Medium, and Scintacor Luminex Ultrafine). The results from the Nikon D810 and f/1.4 50mm lens are detailed in Figure 17 and the results from the images from the iPhone 5S are detailed in Figure 18. The lines of best fit are all recorded in Table 2. The results show that, in general, the Nikon D810 resolution images do follow a relatively linear trajectory with R2 of greater than 0.8. The iPhone
5S results are not quite as linear, as indicted by the low R2 values which are all less than 0.9, two well below at 0.6 and 0.3. In both the Nikon D810 results and the iPhone 5S results, the MCI Optonix DRZ High screen begins with very high MTF values yet rapidly drops low, almost to 0 around 0.9-1.0 LPM, whereas the Scintacor screens have more gradual MTF curve decrements.
- 46 -
Further, it appears that the Scintacor Ultrafine screen has the best performance, although this cannot be said for the iPhone 5S given the error of the line of best fit. In general, the Nikon D810 did better than the iPhone 5S, as seen in the MTF decrements.
Figure 17: MTF Curve of a Nikon D810 camera (f/1.4, 50mm lens) imaging three different scintillating screens (MCI Optonix DRZ High, Scintacor Luminex Medium, and Scintacor Luminex Ultrafine). It is seen that all of the MTF curves have roughly linear fits with R2 of more than 0.8 for each.
- 47 -
Figure 18: MTF Curve of iPhone5S (f/2.2 lens) camera imaging three different scintillating screens (MCI Optonix DRZ High, Scintacor Luminex Medium, and Scintacor Luminex Ultrafine). It is seen that all of the MTF curves are very variable and don’t have linear fits, with R2 mostly well below 0.9.
Table 2: Lines of best fit for each of the MTF values above shown in Figure 17 and Figure 18.
Nikon D810 iPhone 5S
Scintacor DRZ Ultrafine -33.6(LPM)+88.4 -35.8(LPM)+68.0
Scintacor DRZ Medium -46.4(LPM)+80.5 -23.7(LPM)+53.4
MCI Optonix DRZ High -222(LPM)+195 -218(LPM)+214
- 48 -
Chapter 6: Discussion
The current design of this project is such that it is capable of taking x-ray images that contain clinically relevant information for diagnosis or treatment. The provided analysis of the tradeoffs in cost and quality of the x-ray images is the basis for designing an appropriate x-ray imager depending on the needs of the imager. For the purposes of taking chest x-rays, the analysis indicates that it would ideal to use any of the provided screens and the Nikon D810 coupled together. It is currently unclear if the iPhone 5S would be able to take images of the chest to the necessary resolution and contrast to be able to detect TB. Taking images at 14 mA and 100 kV, and at a shutter speed of 0.025 seconds or faster led to images which had sufficient clarify to be able to distinguish the objects of interest. These imaging setups lead to an approximate dose of 1.4 mGy per patient per image which is, relative to existing dosages, lower than the current standard for these x-rays.
The experimental results show that, in general, as expected, the Nikon D810 had less of a MTF curve decrement (and thus a better performance) than the iPhone 5S. The results from the iPhone 5S were noisy, and could not be fit with linear fits very well, likely as a result of the poor light collection for the iPhone from such a small lens. In the experimental results for the Nikon D810 and the iPhone 5S both had rapidly decreasing MTF curves for the MCI Optonix High
scintillating screen, with resolution cutoffs around 0.9 LPM for both. This is apparently at odds with the qualitative results in that fine details could be seen using this scintillating screen, and the details that could be seen did not match up with such low MTF values. Despite this apparent discrepancy, the MTF values measured for this screen did match up with the screen’s MTF curve as described by the manufacturer in Chapter 4. For the two Scintacor screens, the approximate resolution was around 2 LPM with the existing setup.
In order to reach a final product, consideration has to go into how to obtain cheaper x-ray tubes and more thought about which power requirements would best meet the needs of the x-ray source, particularly in terms of battery power to meet the needs settings with inconsistent power. The current design project is largely focused on meeting the needs of the imager itself which is the
- 49 -
more complicated component and the component with the most variable parts. The imager portion in conjunction with the x-ray tube and the power source need to go through more refinement in putting the components together and creating a design that would be well suited to the material resources available in the target areas of the world. The hope for this project is that the final construction will not need specialized equipment for construction or repair, or that the more specialized component will be shippable and durable enough that they will be easily accessible in rural areas of the world.
As a next step in the research, a prototype built exactly to the design specifications and with a custom power source and x-ray tube, as a single standalone product and ideally within or near the aim of the design budget, would be best. This creation of a fully functional prototype would be the step that would link the present research to the final commercialized product. Tangentially, a better model of the human chest should be developed for x-ray imaging and ideally, images taken of a human should be carried out as a full proof of concept of the feasibility of the final product. After complete testing of the product, the final step will be implementing the product in low resource environments and developing a system for its training and use in medical environments.


![Figure 5: patient with late-stage TB in Nigeria. Notable are the signs of weight loss to a point that is a health hazard to the patient [24]](https://thumb-eu.123doks.com/thumbv2/123doknet/14677427.558314/24.918.268.647.113.337/figure-patient-nigeria-notable-weight-health-hazard-patient.webp)

![Table 2: Estimated costs for the total x-ray imaging system using the most expensive and highest resolution x-ray imaging setup used in this study [28] [29] [30] [31]](https://thumb-eu.123doks.com/thumbv2/123doknet/14677427.558314/33.918.341.579.109.256/table-estimated-costs-imaging-expensive-highest-resolution-imaging.webp)