HAL Id: hal-02122740
https://hal.archives-ouvertes.fr/hal-02122740
Submitted on 8 Nov 2019HAL is a multi-disciplinary open access archive for the deposit and dissemination of sci-entific research documents, whether they are pub-lished or not. The documents may come from teaching and research institutions in France or abroad, or from public or private research centers.
L’archive ouverte pluridisciplinaire HAL, est destinée au dépôt et à la diffusion de documents scientifiques de niveau recherche, publiés ou non, émanant des établissements d’enseignement et de recherche français ou étrangers, des laboratoires publics ou privés.
Developmental control of plant Rho GTPase
nano-organization by the lipid phosphatidylserine
Matthieu Pierre Platre, Vincent Bayle, Laia Armengot, Joseph Bareille, Maria
del Mar Marquès-Bueno, Audrey Creff, Lilly Maneta-Peyret, Jean-Bernard
Fiche, Marcelo Nollmann, Christine Miege, et al.
To cite this version:
Matthieu Pierre Platre, Vincent Bayle, Laia Armengot, Joseph Bareille, Maria del Mar Marquès-Bueno, et al.. Developmental control of plant Rho GTPase nano-organization by the lipid phos-phatidylserine. Science, American Association for the Advancement of Science, 2019, 364 (6435), pp.57-62. �10.1126/science.aav9959�. �hal-02122740�
1
Title:
Developmental control of plant Rho GTPase nano-organization by the
lipid phosphatidylserine
Authors: Matthieu Pierre Platre1, Vincent Bayle1, Laia Armengot1, Joseph Bareille1, Maria Mar
Marques-Bueno1, Audrey Creff1, Lilly Maneta-Peyret2, Jean-Bernard Fiche3, Marcelo Nolmann3,
5
Christine Miège1, Patrick Moreau2,4, Alexandre Martinière5 and Yvon Jaillais1*
Affiliations:
1Laboratoire Reproduction et Développement des Plantes, Université de Lyon, ENS de Lyon,
UCB Lyon 1, CNRS, INRA, F-69342 Lyon, France.
2UMR 5200 Membrane Biogenesis Laboratory, CNRS-University of Bordeaux, Bâtiment A3 -
10
INRA Bordeaux Aquitaine, 71 Avenue Edouard Bourlaux- CS 20032, 33140 Villenave d’Ornon, France.
3Centre de Biochimie Structurale, CNRS UMR5048, INSERM U1054, Université de
Montpellier, 29 Rue de Navacelles, 34090, Montpellier, France.
4Bordeaux Imaging Center, UMS 3420 CNRS, US4 INSERM, University of Bordeaux, 33000
15
Bordeaux, France.
5BPMP, Univ Montpellier, CNRS, INRA, Montpellier SupAgro, Montpellier, France.
*Correspondence to: yvon.jaillais@ens-lyon.fr 20
Changes made during the revisions are highlighted in green
Abstract:
Rho GTPases are master regulators of cell signaling, but how they are regulated depending on the cellular context is unclear. Here, we show that the phospholipid phosphatidylserine acts as a 25
developmentally-controlled lipid rheostat that tunes Rho GTPase signaling in Arabidopsis. Live super-resolution single molecule imaging revealed that RHO-OF-PLANT6 (ROP6) is stabilized by phosphatidylserine into plasma membrane nanodomains, which is required for auxin signaling. Furthermore, we uncovered that the plasma membrane phosphatidylserine content varies during plant root development and that the level of phosphatidylserine modulates the quantity of ROP6 30
nanoclusters induced by auxin and hence downstream signaling, including regulation of endocytosis and gravitropism. Our work reveals that variations in phosphatidylserine levels are a physiological process that may be leveraged to regulate small GTPase signaling during development.
One Sentence Summary:
35
Phosphatidylserine acts as a developmentally-controlled lipid rheostat that regulates auxin sensitivity and plant development.
2
Main Text:
Proteins from the Rho/Ras superfamily are small GTPases that regulate fundamental eukaryotic functions, including cell signaling, cell polarity, intracellular trafficking and cytoskeleton dynamics (1, 2). Furthermore, they control the morphology and behavior of cells and organisms by integrating signaling pathways at the cell surface into various cellular outputs. The small 5
GTPase paradigm stipulates that they are in an “inactive” form when bound to GDP, and in an “active” form when bound to GTP. However, emerging evidence suggest that this view is likely oversimplified, since their membrane environment also dictates the signaling capacity of these GTPases (2). For example, Ras/Rho signaling is intimately linked with membrane lipids in all eukaryotes. Interaction with anionic lipids is important for their plasma membrane targeting (3, 4), 10
but also mediates the clustering of these small GTPases at the cell surface into nanometer scale membrane domains (5-8). In particular, the phospholipid phosphatidylserine is involved in the nanoclustering and signaling of some GTPase, such as K-Ras in human and Cdc42 in yeast (2, 7,
8). By contrast to other anionic phospholipids, phosphatidylserine is relatively abundant,
representing up to 10-20% of the total phospholipids at the plasma membrane inner leaflet (9). In 15
addition, phosphatidylserine is not constantly modified by specialized metabolizing enzymes and its subcellular repartition is thought to be relatively stable across cell types (9, 10). Therefore, phosphatidylserine appears to be a structural component of the membrane, which is required for K-Ras/Cdc42 nanoclustering. It is unknown, however, whether phosphatidylserine also has a regulatory role in vivo in modulating nanocluster formation and subsequent signaling. In other 20
words, is phosphatidylserine function in GTPase nanoclustering rate limiting? And if yes, are phosphatidylserine levels regulated during development and what are the consequences of such changes on small GTPases signaling capacity? Here, we addressed these questions using the
Arabidopsis thaliana root as a model system, because it is a genetically tractable multicellular
organ, with a variety of cell types and cell differentiation states and amenable to live imaging. 25
In plants, there is a single protein family in the Ras/Rho GTPase superclade, called ROP for RHO-OF-PLANT(11). ROPs are master regulators of cell polarity and cell morphogenesis, but they also sit at the nexus of plant hormone signaling (including auxin and abscisic acid), cell wall sensing pathways and receptor-like kinase signaling (involved in development, reproduction and immunity) (11-18). Here, we show that auxin triggers ROP6 nanoclustering within minutes, in a 30
phosphatidylserine dependent manner. Furthermore, we found that phosphatidylserine is required for ROP6 signaling, and variations in the cellular phosphatidylserine content directly impact the quantity of ROP6 nanoclusters and thereby subsequent downstream auxin signaling, including the regulation of endocytosis and root gravitropism. Therefore, phosphatidylserine is not a mere structural component of the membrane, it is a bona fide signaling lipid that acts as a 35
developmentally-controlled lipid rheostat to regulate small GTPases in a cell-context dependent manner.
Results and discussion
Phosphatidylserine localization varies during root cell differentiation.
40
Phosphatidylserine is an anionic phospholipid that partitions between the cytosolic leaflets of the plasma membrane and endosomes (10). Bulk phosphatidylserine measurements in Arabidopsis
thaliana suggested that the relative phosphatidylserine concentration can vary in vivo depending
3
distribution, we recently validated the use of two phosphatidylserine reporters in Arabidopsis, the C2 domain of Lactadherin (C2Lact) and the PH domain of EVECTIN2 (2xPHEVCT2) (10, 20). In
both cases, the proportion of phosphatidylserine sensors was markedly more pronounced at the plasma membrane than endosomes in the root basal meristem compared to cells in the elongation zone (Fig. 1A, Fig. S1). This developmental gradient appeared to be in part regulated by the plant 5
hormone auxin, as relatively short treatment (60min) with the synthetic auxin naphthalene-1-acetic acid (NAA) increased the level of both phosphatidylserine sensors at the plasma membrane at the expense of their endosomal localization in the elongation zone (Fig. 1B, Fig. S1C). Therefore, not only the overall phosphatidylserine level varies depending on the organ but there are also local variations of the phosphatidylserine content at the plasma membrane within an organ, during cell 10
differentiation and in response to hormonal cues.
Graded phosphatidylserine levels tune ROP6 signaling.
In order to test the potential impact of phosphatidylserine variations during development, we experimentally manipulated the plant phosphatidylserine content, from no phosphatidylserine 15
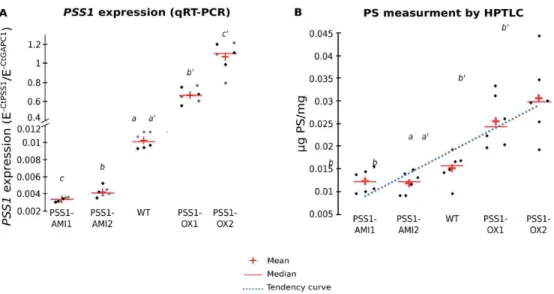
biosynthesis in the phosphatidylserine synthase1 (pss1) mutant (10), to mild phosphatidylserine levels in transgenic lines expressing artificial microRNAs against PSS1 (amiPSS1), and high phosphatidylserine levels in transgenic lines overexpressing PSS1 (PSS1-OX) (Fig. S2). The changes in phosphatidylserine content measured in amiPSS1 and PSS1-OX lines of about ±2-fold were in the physiological range, since phosphatidylserine levels in Arabidopsis vary about 5-fold 20
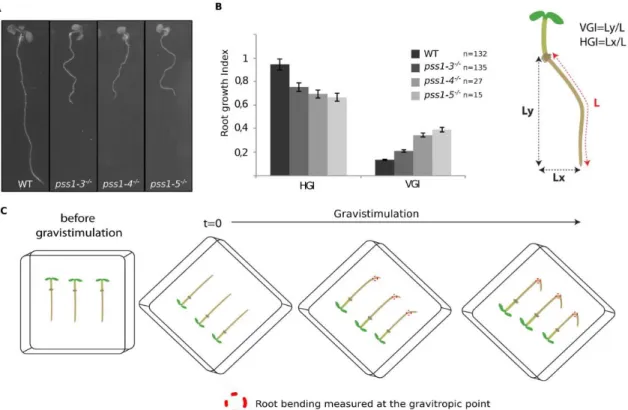
between roots and leaves tissues (19). The pss1 mutant showed defects in root gravitropism (Fig. S3A-B). Quantitative analyses of root bending following gravistimulation (Fig. S3C) revealed that the pss1-3 mutant had no gravitropic response (Fig. 2A), amiPSS1 lines had an attenuated response, while PSS1-OX lines were hypergravitropic (Fig. 2B). These opposite gravitropic phenotypes of PSS1 loss- and gain-of-function resembled those of ROP6, a Rho-Of-Plant (ROP) 25
GTPase, which is activated by auxin and regulates root gravitropism (15, 16). Like PSS1-OX lines, lines overexpressing either ROP6 (ROP6-OX) or constitutive active GTP-lock ROP6 (ROP6CA)
showed a hypergravitropic phenotype, which were abolished in a pss1-3 background (Fig 2A). During root gravitropism, ROP6 acts downstream of auxin to inhibit endocytosis and regulate microtubule orientation (15, 16, 21). Similar to rop6 (15, 16, 21), we observed that in pss1-3: i) 30
FM4-64 and PIN2-GFP uptake in the presence of BrefeldinA (BFA) was increased (Fig. 2C, Fig. S4A-D), ii) auxin failed to inhibit FM4-64 and PIN2-GFP endocytosis (Fig. 2C, Fig. S4A-D), iii) CLATHRIN-LIGHT-CHAIN plasma membrane association was insensitive to auxin treatment (Fig. S4E), and iv) auxin-triggered microtubule reorientation was abolished (Fig. S4F). FM4-64 uptake in pss1-3xROP6CA was identical to that of pss1-3 single mutant and opposite to ROP6CA
35
(Fig. 2C), showing that PSS1 is required for ROP6-mediated inhibition of endocytosis. Furthermore, transgenic lines with low phosphatidylserine content (amiPSS1) had decreased auxin-mediated inhibition of endocytosis, while lines with heightened-phosphatidylserine content (PSS1-OX) mimicked ROP6CA phenotypes with pronounced inhibition of endocytosis upon auxin
treatment (Fig. 2D, Fig. S4G-I). Together, our analyses suggest that i) phosphatidylserine is 40
required for auxin-mediated ROP6 signaling during root gravitropism and ii) phosphatidylserine levels impact the strength of ROP6 signaling output in a dose-dependent manner.
Auxin triggers ROP6 nanoclustering.
PS and ROP6 both accumulate at the plasma membrane, suggesting that phosphatidylserine may 45
4
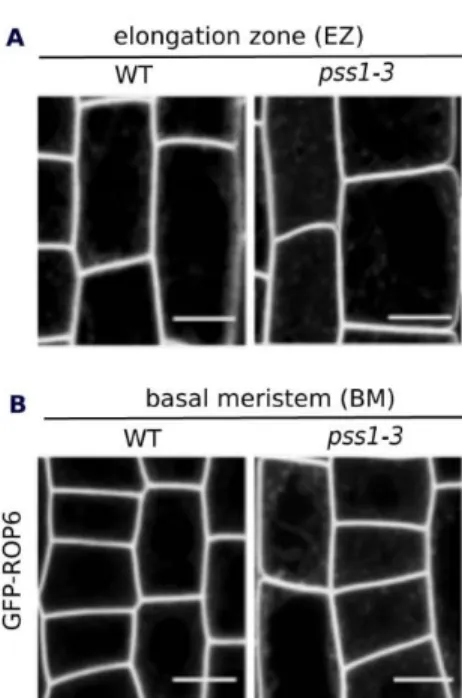
microscopy, was almost identical in pss1-3 and wild-type plants, being mainly at the plasma membrane and only faintly delocalized in intracellular compartments in pss1-3 (Fig. S5). In leaves, ROP6CA was previously shown to be confined in membrane domains (22), raising the possibility
that phosphatidylserine could contribute to ROP6 signaling by regulating its lateral segregation at the plasma membrane. To analyze ROP6 plasma membrane partitioning in root cells and in the 5
context of auxin response, we developed several microscopy-based assays, including Fluorescence Recovery After Photobleaching (FRAP), Total Internal Reflection Fluorescence Microscopy (TIRFM) and PhotoActivated Localization Microscopy (PALM) (Fig. S6). As shown for ROP6CA
in leaf (22), activation of ROP6 (here using auxin treatment) delayed GFP-ROP6 fluorescence recovery after photobleaching in roots, and increased the proportion of immobile GFP-ROP6 (Fig. 10
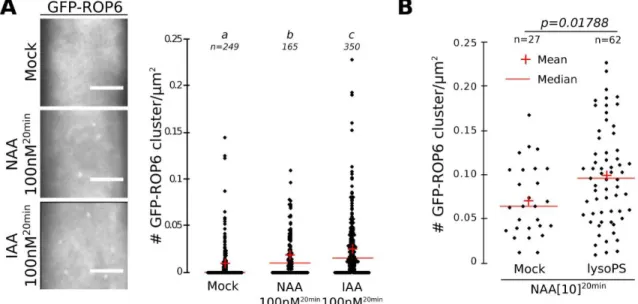
3A and Fig. S7). TIRFM on root tip epidermal cells allowed to focus only on the plane of the plasma membrane with a 100nm axial resolution (Fig. S6B) and revealed that GFP-ROP6 mostly localized uniformly at the plasma membrane (Fig. 3B). By contrast, in auxin-treated plants (both with NAA or the naturally-occurring auxin indole-3-acetic acid, IAA), GFP-ROP6 additionally resided in diffraction-limited spots present in the plane of the plasma membrane (Fig. 3B and Fig. 15
S8A), suggesting that auxin treatment triggers the clustering of ROP6 in membrane domains. By using stochastic photoswitching on live roots, single particle tracking PALM (sptPALM) experiments provided tracks of single molecule localization through time, and therefore allowed us to analyze the diffusion behavior of single ROP6 molecule in response to auxin (Fig. S6D). While ROP6 molecules in the untreated condition were almost exclusively diffusing, mEos-20
ROP6 molecules in plants treated for 5 minutes with NAA or IAA (or mEos-ROP6CA molecules)
existed in two states at the plasma membrane of epidermal cells: immobile or diffusing (Fig. 3C-D, Fig. S9 and Supplementary Video 1). Clustering analyses on live PALM images (23) showed that auxin triggered the clustering of mEos-ROP6 in plasma membrane-nanodomains of about 50 to 70 nm wide (Fig. 3E-F and Fig. S10). Together, our data indicate that activation, either 25
genetically (i.e. ROP6CA) or by an endogenous activator (i.e. auxin), triggers ROP6 recruitment,
immobilization and stabilization into nanodomains and that these events happen minutes following auxin treatment.
Dose-dependent regulation of ROP6 nanoclustering by phosphatidylserine.
30
Next, we tested the impact of phosphatidylserine on ROP6 plasma membrane dynamics. In FRAP experiments, GFP-ROP6 sensitivity to auxin was reduced in pss1-3 (Fig. 4A and Fig. S7), suggesting that phosphatidylserine is critical for the immobilization of ROP6 by auxin. In wild-type plants, NAA-induced GFP-ROP6 presence in nanodomains was more pronounced in the basal meristem than in the elongation zone in TIRFM experiments (Fig. 4B), which correlated with the 35
observed differential presence of phosphatidylserine content at the plasma membrane in these regions (Fig. 1A). To analyze whether this differential auxin sensitivity was dependent on the amount of phosphatidylserine present in these cells, we performed phosphatidylserine loss- and gain-of-function experiments. First, auxin failed to induce GFP-ROP6 nanodomains in both region of the root in pss1-3 (Fig. 4C), suggesting that phosphatidylserine is indeed required for auxin-40
triggered ROP6 nanoclustering. Second, exogenous treatment with lysophosphatidylserine, a more soluble lipid than phosphatidylserine but with an identical head group (10), boosted the number of auxin-induced GFP-ROP6 nanodomains observed in TIRFM in wild-type plants (Fig. S8B). Third, sptPALM analyses showed that the fraction of immobile mEos-ROP6CA (for which all ROP6
molecules are loaded with GTP) was significantly enhanced in PSS1-OX lines compared to the 45
5
wild type (Fig. 4D and Fig. S11). Together these data suggest that the quantity of phosphatidylserine at the plasma membrane impacts ROP6 nanoclustering.
While phosphatidylserine was required for auxin-triggered ROP6 nanoclustering, a certain amount of ROP6 was still found in plasma membrane domains in pss1, independent of the presence of auxin (Fig. 4C). Kymograph analyses revealed that ROP6-containing nanodomains observed by 5
TIRFM in the presence of auxin were immobile in both wild-type and pss1-3 background (Fig. 4E). Photobleaching experiments showed that GFP-ROP6 was highly stable in these nanodomains in the wild type (i.e. no fluorescence recovery of GFP-ROP6 in nanodomains, and fast recovery of fluorescence outside of these domains) (Fig. 4E and Supplementary Video 2). By contrast, GFP-ROP6 fluorescence in nanodomains was rapidly recovered in pss1-3, suggesting that GFP-ROP6 was 10
not stabilized into nanodomains in the absence of phosphatidylserine (Fig. 4E and Supplementary Video 3). Together, our results show that phosphatidylserine is necessary for both ROP6 stabilization into nanodomains and downstream ROP6 signaling, including regulation of endocytosis and root gravitropism.
15
Immobile phosphatidylserine molecules accumulate in nanodomains.
Next, we addressed whether phosphatidylserine, like ROP6, also localizes in nanodomains. Using sptPALM and clustering analyses, we found that in both absence or presence of exogenous auxin: i) the phosphatidylserine reporter mEos-2xPHEVCT2 segregated into nanodomains at the plasma
membrane of root epidermal cells (Fig. 5A) and ii) about 50% of mEos-2xPHEVCT2 molecules were
20
present as a slow-diffusible population (Fig. 5B and Fig S12). mEos-2xPHEVCT2 apparent diffusion
coefficient in the absence and presence of auxin was similar to that of immobile mEos-ROP6 ROP6 in the presence of auxin (Fig. 3D), suggesting that ROP6 may cluster in preexisting PS nanodomains. Accordingly, co-visualization of GFP-ROP6 and the phosphatidylserine sensor 2xmCHERRY-C2Lact in TIRFM confirmed that they at least partially reside in the same
25
nanodomains in response to auxin, while only 2xmCHERRY-C2Lact was present in nanocluster in
the absence of auxin (Fig. 5C and S12D).
Direct ROP6-lipid interactions control nanoclustering and signaling.
ROP6 possess in its C-terminus a polybasic region adjacent to a prenylation site (Fig. S13A). Such 30
polybasic region is anticipated to bind to anionic phospholipids, including phosphatidylserine (3,
4, 6), which we confirmed in protein-lipid overlay experiments (Fig. S13B). Substitution of seven
lysines into neutral glutamines in ROP6 C-terminus (ROP67Q) abolished in vitro interactions with
all anionic lipids (Fig. S13B). In planta, diminishing the net positive charges of ROP6 C-terminus or the net negative charge of the plasma membrane gradually induced ROP6 mislocalization into 35
intracellular compartments (Fig. S13C-D). To test the functionality of ROP67Q at the plasma
membrane, we selected transgenic lines that had strong expression level to compensate for their intracellular localization and therefore have comparable levels of ROP67Q and ROP6 at the plasma
membrane (Fig. S14A and D-F). ROP67Q mutants were not functional in planta (Fig. 5D-E, Fig.
S14B-C), even though the 7Q mutations had no impact on ROP6 intrinsic GTPase activity in vitro 40
and ROP6-GTP conformation in vivo (Fig. S15). We next analyzed the dynamics of mEos-ROP67Q
at the plasma membrane of wild-type roots by sptPALM experiments and found that it had the same proportion of immobile molecules than mEos-ROP6 in pss1-3, and that in both cases they were insensitive to auxin (Fig. 5F, Fig. S16). Therefore, impairing PS/ROP6 interaction by either removing phosphatidylserine from the membranes (pss1 mutant), or by mutating the anionic lipid-45
6
binding site on ROP6 (ROP67Q) similarly impacted ROP6 signaling and its auxin-induced
nanoclustering.
Conclusions.
Here, we showed that in root tip epidermal cells: i) ROP6 is immobilized in plasma membrane 5
localized nanodomains upon activation by auxin, ii) phosphatidylserine is necessary for both ROP6 stabilization into nanodomains and signaling, iii) ROP6 directly interacts with anionic lipids, including phosphatidylserine, and iv) phosphatidylserine itself is present and immobile in these nanodomains, suggesting that stabilized ROP6 in phosphatidylserine-containing nanoclusters constitutes the functional signaling unit of this GTPase. Our imaging pipeline revealed that ROP6 10
nano-organization is rapidly remodeled by auxin and as such will provide a quantitative in vivo read-out to re-evaluate how auxin may be perceived upstream of ROP6 activation. Plants have 11 ROPs, which can respond to a wide range of signals (11), raising the question whether nanoclustering is specific to auxin response or common to other signals and to various ROPs, and to what extent it may contribute to signal integration by plant Rho GTPases. All ROP proteins 15
have polybasic clusters at their C-terminus (Fig. S17A), and phosphatidylserine could therefore potentially regulate additional member of this family. In addition to root gravitropic defects, pss1 had many developmental phenotypes that may be linked to altered ROP function (e.g. pavement cell and root hair morphology, planar polarity defects, see Fig. S17B-F) but that are not found in
rop6 single mutant and could therefore involve additional ROP proteins. Furthermore, we found
20
that ROP6 interacts with phosphoinositides and phosphatidic acid, which are required for its proper targeting to the plasma membrane (Fig. S13). Additional studies are required to determine whether these anionic phospholipids may participate to ROP nanoclustering, perhaps in synergy with phosphatidylserine. Nanoclustering is a shared feature of several yeast and animal small GTPases, including K-Ras, Rac1 and Cdc42 (5-8), and both K-Ras and Cdc42 require phosphatidylserine 25
for nanoclustering (2, 6-8). Here, we showed the dependence of ROP6 function on PS level. This opens the possibility that variations of the phosphatidylserine concentration at the plasma membrane of both animal and plant systems may have specific regulatory functions and could control the signaling capacity of small GTPases during either normal or pathological development. 30
References and Notes:
1. S. Etienne-Manneville, A. Hall, Rho GTPases in cell biology. Nature 420, 629-635 (2002).
2. Y. Zhou, J. F. Hancock, Deciphering lipid codes: K-Ras as a paradigm. Traffic 19, 157-165 (2018).
35
3. W. D. Heo et al., PI(3,4,5)P3 and PI(4,5)P2 lipids target proteins with polybasic clusters to the plasma membrane. Science 314, 1458-1461 (2006).
4. T. Yeung et al., Membrane phosphatidylserine regulates surface charge and protein localization. Science 319, 210-213 (2008).
5. A. Remorino et al., Gradients of Rac1 Nanoclusters Support Spatial Patterns of Rac1 40
Signaling. Cell reports 21, 1922-1935 (2017).
6. Y. Zhou et al., Lipid-Sorting Specificity Encoded in K-Ras Membrane Anchor Regulates Signal Output. Cell 168, 239-251 e216 (2017).
7
7. E. Sartorel et al., Phosphatidylserine and GTPase activation control Cdc42 nanoclustering to counter dissipative diffusion. Molecular biology of the cell, mbcE18010051 (2018).
8. J. Meca et al., Avidity-driven polarity establishment via multivalent lipid-GTPase module interactions. The EMBO journal, (2018).
5
9. P. A. Leventis, S. Grinstein, The distribution and function of phosphatidylserine in cellular membranes. Annual review of biophysics 39, 407-427 (2010).
10. M. P. Platre et al., A Combinatorial Lipid Code Shapes the Electrostatic Landscape of Plant Endomembranes. Developmental cell 45, 465-480 e411 (2018).
11. G. Feiguelman, Y. Fu, S. Yalovsky, ROP GTPases Structure-Function and Signaling 10
Pathways. Plant physiology 176, 57-79 (2018).
12. L. Z. Tao, A. Y. Cheung, H. M. Wu, Plant Rac-like GTPases are activated by auxin and mediate auxin-responsive gene expression. The Plant cell 14, 2745-2760 (2002). 13. T. Xu et al., Cell surface- and rho GTPase-based auxin signaling controls cellular
interdigitation in Arabidopsis. Cell 143, 99-110 (2010). 15
14. Q. Duan, D. Kita, C. Li, A. Y. Cheung, H. M. Wu, FERONIA receptor-like kinase regulates RHO GTPase signaling of root hair development. Proceedings of the National
Academy of Sciences of the United States of America 107, 17821-17826 (2010).
15. X. Chen et al., ABP1 and ROP6 GTPase signaling regulate clathrin-mediated endocytosis in Arabidopsis roots. Current biology : CB 22, 1326-1332 (2012).
20
16. D. Lin et al., A ROP GTPase-dependent auxin signaling pathway regulates the subcellular distribution of PIN2 in Arabidopsis roots. Current biology : CB 22, 1319-1325 (2012).
17. T. Xu et al., Cell surface ABP1-TMK auxin-sensing complex activates ROP GTPase signaling. Science 343, 1025-1028 (2014).
25
18. L. Poraty-Gavra et al., The Arabidopsis Rho of plants GTPase AtROP6 functions in developmental and pathogen response pathways. Plant physiology 161, 1172-1188 (2013).
19. Y. Yamaoka et al., PHOSPHATIDYLSERINE SYNTHASE1 is required for microspore development in Arabidopsis thaliana. The Plant journal : for cell and molecular biology 30
67, 648-661 (2011).
20. M. L. Simon et al., A PtdIns(4)P-driven electrostatic field controls cell membrane identity and signalling in plants. Nat Plants 2, 16089 (2016).
21. X. Chen et al., Inhibition of cell expansion by rapid ABP1-mediated auxin effect on microtubules. Nature 516, 90-93 (2014).
35
22. N. Sorek et al., An S-acylation switch of conserved G domain cysteines is required for polarity signaling by ROP GTPases. Current biology : CB 20, 914-920 (2010).
23. J. Gronnier et al., Structural basis for plant plasma membrane protein dynamics and organization into functional nanodomains. eLife 6, (2017).
24. I. A. Sparkes, J. Runions, A. Kearns, C. Hawes, Rapid, transient expression of 40
fluorescent fusion proteins in tobacco plants and generation of stably transformed plants.
Nature protocols 1, 2019-2025 (2006).
25. M. L. Simon et al., A multi-colour/multi-affinity marker set to visualize phosphoinositide dynamics in Arabidopsis. The Plant journal : for cell and molecular biology 77, 322-337 (2014).
8
26. K. Elsayad et al., Mapping the subcellular mechanical properties of live cells in tissues with fluorescence emission-Brillouin imaging. Science signaling 9, rs5 (2016).
27. C. A. Konopka, S. K. Backues, S. Y. Bednarek, Dynamics of Arabidopsis dynamin-related protein 1C and a clathrin light chain at the plasma membrane. The Plant cell 20, 1363-1380 (2008).
5
28. J. Xu, B. Scheres, Dissection of Arabidopsis ADP-RIBOSYLATION FACTOR 1 function in epidermal cell polarity. The Plant cell 17, 525-536 (2005).
29. E. Hosy, A. Martiniere, D. Choquet, C. Maurel, D. T. Luu, Super-resolved and dynamic imaging of membrane proteins in plant cells reveal contrasting kinetic profiles and multiple confinement mechanisms. Molecular plant 8, 339-342 (2015).
10
30. A. Martiniere et al., Cell wall constrains lateral diffusion of plant plasma-membrane proteins. Proceedings of the National Academy of Sciences of the United States of
America 109, 12805-12810 (2012).
31. A. Martiniere, P. Gayral, C. Hawes, J. Runions, Building bridges: formin1 of Arabidopsis forms a connection between the cell wall and the actin cytoskeleton. The Plant journal : 15
for cell and molecular biology 66, 354-365 (2011).
32. C. A. Schneider, W. S. Rasband, K. W. Eliceiri, NIH Image to ImageJ: 25 years of image analysis. Nature methods 9, 671-675 (2012).
33. A. Serge, N. Bertaux, H. Rigneault, D. Marguet, Dynamic multiple-target tracing to probe spatiotemporal cartography of cell membranes. Nature methods 5, 687-694 (2008). 20
34. A. Martinière et al, Osmotic stress activates two ROS pathways with distinct impacts on protein nanodomains and diffusion. Plant Physiology in press, (2019).
35. H. Yoshizaki et al., Activity of Rho-family GTPases during cell division as visualized with FRET-based probes. The Journal of cell biology 162, 223-232 (2003).
36. K. Kurokawa, R. E. Itoh, H. Yoshizaki, Y. O. Nakamura, M. Matsuda, Coactivation of 25
Rac1 and Cdc42 at lamellipodia and membrane ruffles induced by epidermal growth factor. Molecular biology of the cell 15, 1003-1010 (2004).
37. R. E. Itoh et al., Activation of rac and cdc42 video imaged by fluorescent resonance energy transfer-based single-molecule probes in the membrane of living cells. Molecular
and cellular biology 22, 6582-6591 (2002).
30
38. A. Akamatsu et al., An OsCEBiP/OsCERK1-OsRacGEF1-OsRac1 module is an essential early component of chitin-induced rice immunity. Cell host & microbe 13, 465-476 (2013).
39. M. M. Marques-Bueno et al., A versatile Multisite Gateway-compatible promoter and transgenic line collection for cell type-specific functional genomics in Arabidopsis. The 35
Plant journal : for cell and molecular biology 85, 320-333 (2016).
40. Y. Jaillais et al., Tyrosine phosphorylation controls brassinosteroid receptor activation by triggering membrane release of its kinase inhibitor. Genes & development 25, 232-237 (2011).
41. M. Karimi, A. Bleys, R. Vanderhaeghen, P. Hilson, Building blocks for plant gene 40
assembly. Plant physiology 145, 1183-1191 (2007).
42. K. Nito, C. C. Wong, J. R. Yates, 3rd, J. Chory, Tyrosine phosphorylation regulates the activity of phytochrome photoreceptors. Cell reports 3, 1970-1979 (2013).
43. A. M. Heape, H. Juguelin, F. Boiron, C. Cassagne, Improved one-dimensional thin-layer chromatographic technique for polar lipids. J Chromatogr 322, 391-395 (1985).
9
44. L. J. Macala, R. K. Yu, S. Ando, Analysis of brain lipids by high performance thin-layer chromatography and densitometry. Journal of lipid research 24, 1243-1250 (1983). 45. J. Schindelin et al., Fiji: an open-source platform for biological-image analysis. Nature
methods 9, 676-682 (2012).
46. A. French, S. Ubeda-Tomas, T. J. Holman, M. J. Bennett, T. Pridmore, High-throughput 5
quantification of root growth using a novel image-analysis tool. Plant physiology 150, 1784-1795 (2009).
47. A. Grabov et al., Morphometric analysis of root shape. The New phytologist 165, 641-651 (2005).
48. A. Boudaoud et al., FibrilTool, an ImageJ plug-in to quantify fibrillar structures in raw 10
microscopy images. Nature protocols 9, 457-463 (2014).
49. V. Bayle, M. P. Platre, Y. Jaillais, Automatic Quantification of the Number of
Intracellular Compartments in Arabidopsis thaliana Root Cells. Bio-protocol 7, (2017). 50. F. Levet et al., SR-Tesseler: a method to segment and quantify localization-based
super-resolution microscopy data. Nature methods 12, 1065-1071 (2015). 15
51. A. Johnson, G. Vert, Single Event Resolution of Plant Plasma Membrane Protein Endocytosis by TIRF Microscopy. Frontiers in plant science 8, 612 (2017).
52. K. Maeda et al., Interactome map uncovers phosphatidylserine transport by oxysterol-binding proteins. Nature 501, 257-261 (2013).
53. J. Chung et al., PI4P/phosphatidylserine countertransport at ORP5- and ORP8-mediated 20
ER-plasma membrane contacts. Science 349, 428-432 (2015).
54. J. Moser von Filseck et al., Phosphatidylserine transport by ORP/Osh proteins is driven by phosphatidylinositol 4-phosphate. Science 349, 432-436 (2015).
55. R. Raghupathy et al., Transbilayer lipid interactions mediate nanoclustering of lipid-anchored proteins. Cell 161, 581-594 (2015).
25
56. T. Yeung et al., Receptor activation alters inner surface potential during phagocytosis.
Science 313, 347-351 (2006).
57. G. R. Hammond et al., PI4P and PI(4,5)P2 are essential but independent lipid determinants of membrane identity. Science 337, 727-730 (2012).
30
Acknowledgments: We thank M. Dreux, E. Bayer, O. Hamant, S. Mongrand, Y. Boutté, J.
Gronnier, J. Reed, T. Vernoux and the SiCE group for discussions and comments, T. Stanislas for help with root hair phenotyping, C. Burny for help with statistics, B. Peret for sharing his root template, S. Bednarek, S. Yalovsky, B. Scheres and the NASC collection for providing transgenic
Arabidopsis lines, A. Lacroix, J. Berger and P. Bolland for plant care, J.C. Mulatier for help in
35
preparing lipids. We acknowledge the contribution of SFR Biosciences (UMS3444/CNRS, US8/Inserm, ENS de Lyon, UCBL) facilities: C. Lionnet, E. Chattre, and C. Chamot at the LBI-PLATIM-MICROSCOPY for assistance with imaging and V. Guegen-Chaignon at the Protein Science Facility for assistance with protein purification. We thank the PHIV and MRI platform for access to microscopes. Funding: Y.J. is funded by ERC no. 3363360-APPL under FP/2007-2013; 40
Y.J and A.M. by the innovative project iRhobot from the department of “Biologie et Amélioration des Plantes” (BAP) of INRA. Author contributions: M.P.P. generated all transgenic material, and was responsible for all experiments. V.B., M.P.P. and A.M. conceived, performed and analyzed super-resolution imaging. V.B. performed and analyzed TIRFM and FRAP imaging. L.M-P and P.M. performed lipid measurements. A.M. imaged Raichu-ROP6 sensors. J.B. 45
10
overlay experiments. M.M.M-B., and C.M. assisted with phenotyping and cloning, A.C. performed qRT-PCR analyses, J-B.F. and M.N. designed the sptPALM analyses pipeline, M.P.P., V.B. and Y.J. conceived the study, designed experiments and wrote the manuscript and all the authors discussed the results and commented on the manuscript. Correspondence and requests for materials should be addressed to Y.J. Competing interests: Authors declare no competing 5
interests. Data and materials availability: All data is available in the main text or the supplementary materials
Supplementary Materials:
Materials and Methods 10
Figures S1-S17 Movies S1-S3 References (24-57) 15
11
Figures
Figure 1. Plasma membrane phosphatidylserine levels vary during root cell differentiation. A-B Confocal images and quantification of the plasma membrane (PM)/cytosol ratio of
mCIT-C2LACT (phosphatidylserine (PS) sensor) root epidermis in: (A) basal meristem (BM) and
5
elongation zone (EZ) and (B) absence/presence of NAA (10µM, 60min), (n=150 cells). Scale bars 10µm. Red crosses represent the mean, red lines the median, letters indicate statistical differences (see methods for details on statistical tests).
12
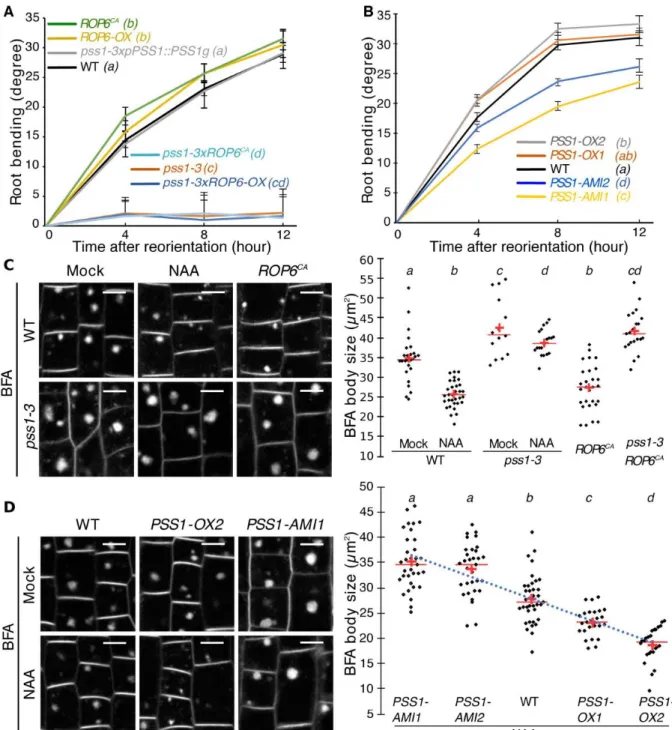
Figure 2. Variation in phosphatidylserine concentration tunes ROP6-mediated auxin response. A-B, Quantification of root bending after gravistimulation (mean +/- sem, from top:
n=40,28,39,33,70,64,51 in A, n=40,52,65,77,57 in B)). C-D, Confocal images of FM4-64 staining
in root epidermis (BFA: 25µM; NAA: 5µM), and related quantification (n=26,37,14,21,28,21 in 5
C, n=33,32,36,25,24 in D). Scale bars 10µm. Red crosses represent the mean, red lines the median, doted blue line the tendency curve, n the number of roots analyzed, letters indicate statistical differences (see methods for details on statistical tests).
13
Figure 3. Auxin triggers ROP6 nanoclustering at the plasma membrane of root epidermal cells. A, kymograph images of GFP-ROP6 during FRAP experiments (NAA: 100nM, 30 min),
and quantification of GFP-ROP6 immobile fraction determine by FRAP analyzes (n=48,34). Red arrowhead indicates bleaching and white arrow is a 9s timescale. B, TIRFM micrograph of GFP-5
ROP6 (NAA: 10µM, 20 min) and related quantification (n=151,277). C, Representative mEos-ROP6 trajectories obtained by sptPALM analyses. Immobile molecules are in blue, mobile molecules in orange. D, Distribution of mEos-ROP6 molecules according to their apparent diffusion coefficient obtained by analyzing sptPALM trajectories (NAA: 10µM, 5 min), and related quantification (n=14,14,14). E, Live PALM analysis of mEos-ROP6 molecules density by 10
tessellation-based automatic segmentation of super-resolution images (NAA: 10µM, 5 min). F, Distribution of mEos-ROP6 molecules according to their local density and related quantification (n=24,24,34). Scale bars: 5 µm (A-B), 1 µm (E). Red crosses represent the mean, red lines the median, n the number of ROIs (A, B), or independent acquisitions (different cells) (D and F) analyzed, letters indicate statistical difference (see methods for details on statistical tests).
14
Figure 4. Phosphatidylserine is necessary for auxin-induced stabilization of ROP6 into nanodomains. A, Quantification of FRAP experiments in wild-type (WT) and pss1-3 root
epidermal cells (NAA: 1nM and 100nM, 30 min, n=48,54,34,36,54,64). B-C, Quantification of TIRFM experiment in WT (n=65,78,149,116) and pss1-3 (n=68,170,73,168) root epidermal cells 5
(NAA, 10µM, 20 min) in basal meristem (BM) and elongation zone (EZ) (data are the same as in Fig3B but split into its respective zone). D, Distribution of mEos-ROP6CA molecules according to
their apparent diffusion coefficient obtained by analyzing sptPALM trajectories in the wild-type (WT) and PSS1-OX background (n=18,18). E, Kymograph of GFP-ROP6 localization obtained by TIRFM, with images of a single GFP-ROP6 nanocluster (9s interval) and related quantification 10
(n=282,121,195,91). The black arrow is a 12s timescale, the red arrowhead indicates bleaching, * indicates GFP-ROP6-containing nanodomains. Scale bars: 5 µm. Red crosses represent the mean, red lines the median, n the number of ROIs (A-C), independent acquisition (D) or GFP-ROP6 nanodomains (E) analyzed, letters indicate statistical difference (see methods for details on statistical tests).
15
Figure 5. ROP6 nanoclustering in response to auxin and downstream signaling requires interaction with anionic phospholipids. A, Live PALM analysis of mEos-2xPHEVCT2 molecules density by tessellation-based automatic segmentation of super-resolution images (NAA, 10µM, 5 min) in root epidermal cells and B, distribution of mEos-2xPHEVCT2 molecules according to their
5
apparent diffusion coefficient obtained by analyzing sptPALM trajectories (n=24,34). C, TIRFM micrograph of root cells co-expressing GFP-ROP6 with the phosphatidylserine marker 2xmCH-C2LACT (NAA: 10µM, 20 min). Arrow indicates PS-containing nanodomains in the absence of
16
Quantification of (D) root bending after gravistimulation (n=49,43,42) and (E) the size of FM4-64-stained BFA bodies (data in wild type (WT) are the same as in Figure 2C, n=26,29,22). F, Distribution of mEos-ROP6 molecules in pss1-3 (left) and mEos-ROP67Q molecules in wild-type
(WT) (right) roots according to their apparent diffusion coefficient obtained by analyzing sptPALM trajectories (NAA: 10µM, 5 min), and related quantification (n=22,22,13,15). Scale bars 5
1µm (A), 5µm (C), 10µm (E). Red crosses represent the mean, red lines the median, n the number of acquisitions (independent cells) (B, F) or roots analyzed (D-E), letter indicates statistical difference (see methods for details on statistical tests).
17
Supplementary
Materials for
5
Developmental control of plant Rho GTPase nano-organization by the lipid
phosphatidylserine
Matthieu Pierre Platre, Vincent Bayle, Laia Armengot, Joseph Bareille, Maria Mar Marques-Bueno, Audrey Creff, Lilly Maneta-Peyret, Jean-Bernard Fiche, Marcelo Nolmann, Christine 10
Miège, Patrick Moreau, Alexandre Martinière and Yvon Jaillais
correspondence to: yvon.jaillais@ens-lyon.fr 15
This PDF file includes:
Materials and Methods Figs. S1 to S17
Captions for Movies S1 to S3 20
Other Supplementary Materials for this manuscript includes the following:
Movies S1 to S3 25
18
Materials and Methods
Growth condition and plant materials.
Arabidopsis thaliana Col-0 accession was used as the wild-type (WT) reference background
throughout this study. Plants were grown in soil under long-day conditions at 21°C and 70% 5
humidity and in vitro on Murashige and Skoog (MS) Basal Medium supplemented with 0.8% plant agar (pH 5.7) in continuous light conditions at 21°C. Every plant used for experiments are homozygous lines or F2 crosses. Nicotiana tabacum cv. Petit Havana plants were grown and used in transient transformation experiments as described (24). The following lines were published before: pss1-3, pss1-4, pss1-5, pss1-3xPSS1prom::PSS1genomic; UBQ10prom::mCHERRY-10
C2Lact (NASC# N2107778), UBQ10prom::mCITRINE-2xPHEVCT2 (NASC# N2107779),
UBQ10prom::mCITRINE-1xPASS (NASC# N2107781) (10); UBQ10prom::mCITRINE-C2Lact
(NASC# N2107347), UBQ10prom::mCITRINE-KA1MARK1 (NASC# N2107345),
UBQ10prom::mCITRINE-P4M (NASC# N2107346) (20); UBQ10prom::mCITRINE-2xPHFAPP1
(NASC# N2105607), UBQ10prom::mCITRINE-2xPHPLC (NASC# N2105613),
15
UBQ10prom::mCITRINE-TUBBY-C (NASC# N2105610) (25); UBQ10prom::2xmCHERRY-Lti6b (26); 35Sprom::GFP-ROP6, 35Sprom::GFP-ROP6CA (22); rop6-2 (16);CLC2prom::CLC2-GFP
(27); 35S::GFP-TUA6 (NASC# N6551); PIN2prom::PIN2-GFP (28); UBQ10prom::PIP2a-mEos (29).
20
Microscopy setup.
All imaging experiments were performed with the following spinning disk confocal microscope set up, except when indicated otherwise (see below): inverted Zeiss microscope (AxioObserver Z1, Carl Zeiss Group, http://www.zeiss.com/) equipped with a spinning disk module (CSU-W1-T3, Yokogawa, www.yokogawa.com) and a ProEM+ 1024B camera (Princeton Instrument, 25
http://www.princetoninstruments.com/) using a 63x Plan-Apochromat objective (numerical aperture 1.4, oil immersion). GFP was excited with a 488nm laser (150mW) and fluorescence emission was filtered by a 525/50 nm BrightLine® single-band bandpass filter (Semrock, http://www.semrock.com/). YFP/mCITRINE were excited with a 515nm laser (60mW) and fluorescence emission was filtered by a 578/105nm BrightLine® single-band bandpass filter 30
(Semrock, http://www.semrock.com/). mCHERRY and FM4-64 were excited with a 561nm laser (80 mW) and fluorescence emission was filtered by a 609/54 nm BrightLine® single-band bandpass filter (Semrock, http://www.semrock.com/). 488 or 515nm lasers were used to excite GFP or YFP/mCITRINE. For quantitative imaging, pictures of epidermal root meristem cells were taken with detector settings optimized for low background and no pixel saturation. Care was taken 35
to use similar confocal settings when comparing fluorescence intensity or for quantification. Tabaco leaves expressing raichu FRET sensors were observed with an inverted Leica SP8 laser scanning microscope using a 40x Plan-Apochromat objective (numerical aperture 1.1, water immersion). Fluorescent proteins were excited with 458 nm line of a Ne-Ag laser and light were 40
collected simultaneously from 467 to 493 nm for CFP channel and from 538 to 573 for YFP channel. The HyD spectral detector was set to avoid bleed through of CFP fluorescence in the YFPFRET channel. A pinhole of 1 Airy unit was defined. Pixel size and dwell time was respectively
0.143µm and 1.2µs. Those settings were defined to record no signal on non-transformed leaves and kept similar for Raichu constructs tested.
45
19
FRAP experiments.
Fluorescence in a rectangle region of interest (ROI) (50 μm2, 15 μm long) was bleached in the
plasma membrane optical section by four successive scans at full laser power (150 W) using the iLas2 FRAP module (Roper scientific, http://www.biovis.com/ilas.htm) of our spinning disc microscope (cf description of the system above). FRAP was recorded continuously during 90 s 5
with a delay of 0.3 s between frames. Fluorescence recovery was subsequently analyzed in the bleached ROIs and in controlled ROIs (rectangle with the same dimension in unbleached area). Fluorescence intensity of an ROI (same size as the bleached region) was systematically measured outside the root and subtracted to plasma membrane as background correction. Fluorescence intensity data were normalized as previously described (30, 31). Briefly, fluorescence intensity 10
data were normalized using the equation: In=[(It-Imin)/(Imax-Imin)]x100. Where In is the normalized
intensity, It is the intensity at any time t, Imin is the minimum post-photobleaching intensity and
Imax is the mean pre-photobleaching intensity. Normalized recovery data were then fitted to an
exponential recovery fitting curve using the Curve Fitting Tool in ImageJ (https://imagej.nih.gov/ij/) (32). Fitted coefficient were then used to calculate halftime of recovery 15
as the time at which fluorescence intensity reaches half of the final recovered intensity. In graphs, relative to halftime of recovery after photobleaching, “n” represents the number of regions of interest (ROI) used for quantification.
TIRF and FRAP experiments in TIRF mode. 20
Total Internal Reflection Fluorescence (TIRF) Microscopy was done using the inverted Zeiss microscope previously described (AxioObserver Z1) equipped with azimuthal-TIRF iLas2 system (Roper Scientific) and a 100x Plan-Apochromat objective (numerical aperture 1.46, oil immersion). Pixel size was 0.13µm. The azimuth calibration was performed using the manufacturer recommendation and the iLas2 module in Metamorph software. The optimum 25
critical angle was determined as giving the best signal-to-noise ratio. Images were acquired with 200ms exposure time, and 300ms between frames in time-lapse experiments. The photobleaching of ROP6 microdomains was achieved on circular ROIs (15µm diameter) by two successive scans at full laser power (150 W) using the iLas2 FRAP module. Pre- and post-acquisitions were recorded in TIRF during 5 minutes with a delay of 0.3 s between frames. In graphs, relative to 30
domain recovery after photobleaching, “n” represents the number of regions of interest (ROI) used for quantification.
sptPALM.
Imaging was performed on a Zeiss Elyra PS1 system with a 100x Apo (numerical aperture 1.46 35
Oil objective), in TIRF mode. The optimum critical angle was determined as giving the best signal-to-noise ratio. Pixel size was 0.107µm. mEOS was photoconverted using 405nm UV laser power and resulting photoconverted fluorophores were excited using 561nm laser. UV laser power was adjusted to have significant number of tracks without too high density to facilitate further analyses (0.01 to 0.08%). 10,000 images time series were recorded at 50 frames per second (20ms exposure 40
time) on a 256 x 256-pixel region of interest. Single molecule detection and tracks reconstruction were made using MTT algorithm (33) and further computational analyses of tracks were made using CBS sptPALM analyzer (34).
FM4-64, BFA, NAA, IAA, PAO, R59022 and lysophosphatidylserine treatments.
20
For BFA body size quantification, the plasma membrane and endosomes of 7 to 10-day old transgenic lines were stained by incubating roots with 1 μM FM4-64 (thermofisher scientific, https://www.thermofisher.com) concomitantly with Brefeldin A at 25 μM (BFA, Sigma, www.sigmaaldrich.com, BFA stock solution at 50 mM in DMSO) in liquid MS solution for 60 min. For the auxin analog, Naphthaleneacetic acid (NAA) effect on BFA body size, plants were 5
pretreated with NAA for 30 minutes at 5 μM (Sigma, http://www.sigmaaldrich.com/, NAA stock at 10 mM in DMSO) and then the plasma membrane and endosomes of 5 to 10-day old transgenic lines were stained by incubating roots with 1 μM FM4-64 concomitantly with BFA at 25 μM and NAA at 5 μM in liquid MS solution for 60 min. For NAA effect on microtubule orientation, 10-12-day old seedlings expressing GFP-TUA6 were treated with NAA at 100 nM for 60 minutes. 10
NAA at 5 μM for 30 minutes was applied on 10 to 12-day old seedlings to quantify the percentage of cell showing CLC2 at the plasma membrane. For PIN2 endocytosis, transgenic lines expressing PIN2-GFP (10 to 12 days-old seedlings), were treated with BFA at the indicated time (60 min or 120 min) and concentration (10µM, 25µM or 50µM) in 12-well plates. For NAA effect on endocytosis, PIN2-GFP expressing lines were pretreated with NAA at 10 μM for 30 minutes and 15
then concomitantly treated with NAA at 10 μM and BFA at 50 μM for 60 min in 12-well plates. For NAA effect on phosphatidylserine biosensors mCITRINE-C2LACT and mCITRINE-2xPHEVCT2,
5 to 7-day old seedlings were treated with 10 μM NAA for 60 min. 5 to 7 day old seedlings expressing 35Sprom::GFP-ROP6 (GFP-ROP6), ROP6prom::mCITRINE-ROP6 (mCit-ROP6) and UBQ10prom::mCITRINE-ROP6-c-term (mCit-ROP6Cter) were incubated in wells containing
20
12.5 μM R59022 for 60 min or PAO at 30μM for 30 minutes. Plants observed in TIRFM were treated with NAA at 100nM or 10µM for 20 minutes, or IAA at 100nM for 20 minutes (IAA stock at 10mM in DMSO). For sptPALM experiment, plants were incubated in DMSO for 20 minutes in 12-well plates and then NAA or IAA treatment was performed at 10µM (stock solution 100mM in DMSO) for 5 minutes. For FRAP experiment, NAA was applied at 1nm and 100nm for 30 min. 25
For each treatment, the mock condition corresponds to incubation of plants in well supplemented with a volume of DMSO equivalent to the highest drug/hormone concentration used and for the same time as the actual treatment. Roots were imaged within a 5-minute time frame window around the indicated time. Lysophosphatidylserine treatments were performed as described (10). 30
Cloning: preparation of gateway compatible entry clones (entry vector). Published gateway compatible entry vectors are listed below.
The ROP6 promoter (ROP6prom) was amplified from Col0 genomic DNA. Gateway compatible PCR products were introduced into pDONRP4R-P1 vectors (Thermofisher, 35
www.thermofisher.com, cat# 12537023) by BP recombination using the following primers:
ROP6prom_F (ttttttgtacaaacttgcctttctctccttcttcaaacttc) and ROP6prom_R (gtatagaaaagttgctaacaagctttcagaaaagaggatg) to give ROP6prom/pDONRP4RP1.
The ROP6 genomic sequence (ROP6g – At4g35020) from the ATG to its 3’UTR was amplified 40
from Col0 genomic DNA. Gateway compatible PCR products were introduced into
pDONRP2R-P3 (Thermofisher, www.thermofisher.com, cat# 12537023) vectors by BP recombination using
the following primers: ROP6-B2R (ggggacagctttcttgtacaaagtggctatgagtgcttcaaggtttatcaagtg) and
ROP6-B3w3'UTR (ggggacaactttgtataataaagttgccttaagacaattggtgtgaatctagg) to give
ROP6g/pDONRP2RP3.
21
Mutation in ROP6 were obtained by successive site directed mutagenesis using the following partially overlapping forward and reverse primers:
ROP6-CA-fw (gtcggcgacgttgctgttggaaagacttgtc) and ROP6-CA-Rev (tccaacagcaacgtcgccgacagtgacacacttgataaacc) using ROP6g/pDONRP2RP3 as template to give
ROP6g-CA/pDONRP2RP3.
5
Mutations in ROP6g-PBR were obtained by ligation using the following 5’-phosphorylated primers:
ROP6g-7Q_F (gctgctgctggttttttggtggctggagaacgac) and ROP6g-7Q_R
(agcagcaacaatctcagaaaggttgttctatactc) using ROP6g/pDONRP2RP3 as template to give
ROP6g7Q/pDONRP2RP3.
10
ROP6g-3Q_F (ccaaaaaacaagcagaagcagaagcagaaatctcagaaaggttgttc) and ROP6g-3Q_R
(gagatttctgcttctgcttctgcttgttttttggtggctggagaacgacc) using ROP6g/pDONRP2RP3 as template to give ROP6g3Q/pDONRP2RP3.
The ROP6 coding sequence (CDS) was amplified from Col0 cDNA. Gateway compatible PCR 15
products were introduced into pDONRP221 (Thermofisher, www.thermofisher.com, cat# 12536017) vectors by BP recombination using the following primers: ROP6-B1 (ggggacaagtttgtacaaaaaagcaggcttaatgagtgcttcaaggtttatcaagtg) and ROP6-B2wSTOP
(ggggaccactttgtacaagaaagctgggtatcagagtatagaacaacctttctgag) to give
ROP6cDNA/pDONRP221.
20
Mutations in ROP6cDNA-PBR were obtained by ligation using the 7Q_F and
ROP6g-7Q_R 5’ phosphorylated primers and ROP6cDNA/pDONRP221 as template to give ROP67QcDNA/pDONRP221.
The ROP6 C-terminal tail, wild type and mutated ones were generated using the following 5’ 25
phosphorylated primers followed by a ligation:
ROP6C-term_F (aaaatctcagaaaggttgttctatactctaagcaactttattatacaaagttggc) and ROP6Cterm_R
(gctgctgctggttttttggagccactttgtacaagaaagttgaacg) using mCITRINE/pDONRP2RP3 as template to give ROP6-C-term/pDONRP2RP3.
ROP6-3Q-C-term_F (agaaatctcagaaaggttgttctatactctaagcaactttattatacaaagttggc) and ROP6-30
3QCterm_R (gcttctgcttctgcttgttttttggagccactttgtacaagaaagttgaacg) using
mCITRINE/pDONRP2RP3 as template to give ROP63Q-C-term/pDONRP2RP3.
ROP6-7Q-C-term_F (agcagcaacaatctcagaaaggttgttctatactctaagc) and ROP6-7QCterm_R (gctgctgctggttttttggagccactttgtacaagaaagttgaacg) using mCITRINE/pDONRP2RP3 as template to give ROP67Q-C-term/pDONRP2RP3.
35
mEos/pDONRP221 was obtained by amplifying mEos using the following primers: mEOS_F
(ggggacaagtttgtacaaaaaagcaggcttaatgagtgcgattaagccagacatgaag) and mEOS_R
(ggggaccactttgtacaagaaagctgggtattatcgtctggcattgtcaggcaatc) followed by BP cloning into
pDONRP221.
40
The PSS1 (At1g15110) coding sequence was amplified from Col0 cDNA. Gateway compatible PCR products were introduced into pDONRP221 vectors by BP recombination using the following primers: PSS1-OX_F (ggggacaagtttgtacaaaaaagcaggcttaaccatggaacccaatgggtacaggaaa) and
PSS1-OX_R (ggggaccactttgtacaagaaagctgggtaacgtctcttttgcgcgaggatcttct) to give 45
22
PSS1 artificial microRNAs were generated using WMD3-Web MicroRNA designer (Ossowski
Stephan, Fitz Joffrey, Schwab Rebecca, Riester Markus and Weigel Detlef, personal communication). The PSS1-AMI1_B1_B2 and PSS1-AMI2_B1_B2 were produced by IDT to be introduced into pDONRP221 vectors by BP recombination.
5 PSS1-AMI1_B1_B2: Acaagtttgtacaaaaaagcaggctcaaacacacgctcggacgcatattacacatgttcatacacttaatactcgctgttttgaattgatgttttag gaatatatatgtagataataatgatgcgcttaacgttcacaggtcgtgatatgattcaattagcttccgactcattcatccaaataccgagtcgcca aaattcaaactagactcgttaaatgaatgaatgatgcggtagacaaattggatcattgattctctttgaacgttaagcgcatcattattatctctct 10 tttgtattccaattttcttgattaatctttcctgcacaaaaacatgcttgatccactaagtgacatatatgctgccttcgtatatatagttctggta aaattaacattttgggtttatctttatttaaggcatcgccatgacccagctttcttgtacaaagtggt PSS1-AMI2_B1_B2: acaagtttgtacaaaaaagcaggctcaaacacacgctcggacgcatattacacatgttcatacacttaatactcgctgttttgaattgatgttttag 15 gaatatatatgtagatttaacgtctcttttgcgcgctcacaggtcgtgatatgattcaattagcttccgactcattcatccaaataccgagtcgcca aaattcaaactagactcgttaaatgaatgaatgatgcggtagacaaattggatcattgattctctttgagcgcgcaaaagagacgttaaatctctct tttgtattccaattttcttgattaatctttcctgcacaaaaacatgcttgatccactaagtgacatatatgctgccttcgtatatatagttctggta aaattaacattttgggtttatctttatttaaggcatcgccatgacccagctttcttgtacaaagtggt 20
The RaichuROP6 constructs were based on Raichu-Rac1 and Raichu-Cdc42 constructs (35-37). In Raichu-Rac1/Cdc42 sensors, the CRIB domain of human PAK1 is cloned in tandem with Rac1 or Cdc42 (interspaced by an appropriate linker) and flanked by two fluorescent protein FRET pairs (Venus and ECFP) (35-37). The CRIB domain interacts specifically with activated Rac1/Cdc42 (i.e. GTP-bound Rac1 or Cdc42), which induces a conformational change in the sensor and 25
enhances the FRET efficiency between the two fluorescent proteins. We used a similar design for the Raichu-ROP6 sensor. Because the CRIB domain of human PAK1 is known to also interact with plants GTP-bound ROPs (12, 38), we used this domain as a generic probe for ROP6-GTP conformation. To clone the RaichuROP6 constructs, we first ordered a synthetic gene with the following sequence and flanked by AttB1 and AttB2 regions and subsequently cloned it into 30 pDONR221 by BP recombination: ggggacaagtttgtacaaaaaagcaggcttagaattcggcatggtatccaaaggtgaagaattatttacgggagtcgtgccaatacttgtcgagttg gacggtgatgtgaacgggcataaattttcagtaagcggggagggagagggtgacgctacatacggaaaattaactttgaaactaatctgtaccacag gaaaactgcctgtaccgtggcctactctcgtaacaacacttggttacggtttacaatgttttgcacgttaccccgaccatatgaaacaacatgactt 35 cttcaaatctgcgatgcccgagggctatgttcaagaaaggactatattcttcaaggacgacggtaattacaaaactagagctgaagtcaagttcgaa ggagacacgctcgtgaataggatcgagttaaagggaatcgacttcaaagaagatggaaacattctgggacacaaattggagtacaactataattccc ataacgtttacatcaccgccgacaaacaaaagaacgggataaaggcaaacttcaagattaggcacaatattgaggatgggggagtccagttagccga tcactaccagcaaaatactcccataggtgacgggcccgtgctgcttcccgataatcattatctatcataccagtctgcgcttagcaaagaccctaac gagaagagagatcacatggtcttgttggaattcgtaacagctgccctcgagaaagagaaagagcggccagagatttctctcccttcagattttgaac 40 acacaattcatgtcggttttgatgctgtcacaggggagtttacgggaatgccagagcagtgggcccgcttgcttcagacatcaaatatcactaagtc ggagcagaagaaaaacccgcaggctgttctggatgtgttggagttttacaactcgaagaagacatccaacagccagaaatacatgagctttacagat aagtcagcttccggaggtggaaccggtggtggaggtaccatgagtgcttcaaggtttatcaagtgtgtcactgtcggcgacggtgctgttggaaaga cttgtcttctcatctcctacactagcaacactttccccacggattatgtgccaactgtgttcgataatttcagtgccaatgtgattgttgatggcaa cactatcaacttgggattgtgggatactgcagggcaagaggactacaatagactaagacctttgagctatcgcggtgcagatgtcttcttacttgca 45 ttctcacttgtcagcaaagctagctatgaaaatgtttctaaaaagtgggttcctgaactgagacattatgctcctggtgttcccatcatcctcgttg gaacaaagcttgatcttcgagatgataagcaattctttgccgagcaccctggtgctgtgcctatctctaccgctcagggtgaagaactaaagaagct gattggggcgcctgcttatatcgaatgcagtgcaaaaactcaacagaatgtgaaagcagtgtttgatgcggctatcaaggtcgttcgcggccgcatg gtgtccaagggagaagaactttttaccggagtagtacctatacttgtcgagctcgatggggatgtcaatggtcaccgtttctcagtcagcggggaag gcgagggtgacgcgacttacgggaaattaaccctaaaatttatatgcaccacgggaaagctgccagtaccctggcccaccctggtcaccaccctaac 50 ctggggcgtccagtgtttctcacgataccctgaccacatgaagcaacacgatttcttcaaatcagctatgcccgaggggtatgtccaggagagaacg atattttttaaggatgatgggaattacaagactagggctgaggttaagttcgaaggggatacgcttgtgaacaggatagagttaaaaggcattggct ttaaggaggatggtaacatccttggccacaaactagagtataactacatcagtcataacgtgtacataacggccgataagcagaagaatggtattaa ggcacattttaagataagacacaacatcgaagatggtggggtccaactggctgatcattaccagcaaaatactcctatcggcgacggccctgtattg ctaccggacaatcactacctaagtactcaaagcgcgttatccaaggaccctaacgagaagagagatcacatggttctgcttgaatttgtgaccgcag 55 ctggaatcacgcttggaatggacgaactgtctagagtcgctatcaaggtcgttctccagccaccaaaaaacaagaagaagaagaagagaaaatctca gaaaggttgttctatactctagggatcctacccagctttcttgtacaaagtggtcccc
23
RaichuROP6/pDONR221 was then used as template for PCR amplification by the ROP6-CA_F
and ROP6-CA_R primers to give RaichuROP6CA/pDONR221.
RaichuROP6CA/pDONR221 was then used as template for PCR amplification by the 5’
phosphorylated RaichuROP6-7Q_F (caacaatctcagaaaggttgttctatactctagggatcctacccagctttcttgtac) and RaichuROP6-7Q_R (ctgctgctgctgctggttttttggtggctggagaacgaccttgatagcgactctagac) primers 5
followed by ligation to give RaichuROP6CA-7Q/pDONR221.
Cloning: construction of destination clones (destination vector).
The following gateway entry vectors were previously published: pTNT-HA-ccdb (20); UBQ10prom/pDONR P4P1R (NASC# N2106315) (39), 2x35sprom/pDONR P4P1R (NASC#
10
N2106316) (39), mCITRINEnoSTOP/pDONR221 (NASC# N2106287) (40); and
2xPHEVCT2/pDONR P2RP3 (10).
Binary destination vectors for plant transformation were obtained using the multisite LR recombination system (life technologies, http://www.thermofisher.com/) using the pB7m34GW (basta resistant) or pK7m34GW (Kanamycin resistant) (41) as destination vectors, and the donor 15
vectors describe above to give:
pROP6prom::mCITRINE-ROP6/pB7m34GW, pROP6prom::mCITRINE-ROP63Q/pB7m34GW,
pROP6prom::mCITRINE-ROP67Q/pB7m34GW, 2x35sprom::mEOS-ROP6/pB7m34GW,
2x35sprom::mEOS-ROP67Q/pB7m34GW, 2x35sprom::mEOS-ROP6CA/pB7m34GW,
UBQ10prom::mCITRINE-ROP6C-term/pB7m34GW, UBQ10prom::mCITRINE-ROP6
3Q-C-20
term/pB7m34GW, UBQ10prom::mCITRINE-ROP67Q-C-term/pB7m34GW,
2x35sprom::mEOS-2xPHEVCT2/pB7m34GW, promUBQ10::PSS1cDNA-mCITRINE/pB7m34GW (PSS1-OX),
promUBQ10::PSS1-AMI1/pK7m34GW (PSS1-AMI1), promUBQ10::PSS1-AMI2/pK7m34GW (PSS1-AMI2), prom2x35S::RaichuROP6/pB7m34GW, prom2x35S::RaichuROP6CA/pB7m34GW,
prom2x35S::RaichuROP6CA-7Q/pB7m34GW.
25
Transgenic lines were obtained as described in (39). Each transgenic line was used as follow:
UBQ10prom::mCitrine-C2LACT (20): Fig. 1A and B, Fig. S1F.
UBQ10prom::mCitrine-2xPHEVCT2 (10): Fig. S1B and C, Fig S1F.
30
UBQ10prom::Lti6b-2xmCHERRY (26): Fig. S1D and F.
UBQ10prom::mCitrine-2xPHFAPP1 (25): Fig. S1D.
UBQ10prom::mCitrine-P4M (20): Fig. S1D and E.
UBQ10prom::mCitrine-2xPHPLC (25): Fig. S1D.
UBQ10prom::mCitrine-TUBBYC (25): Fig. S1D.
35
UBQ10prom::mCitrine-1xPASS (10): Fig. S1D and E.
UBQ10prom::mCitrine-KA1MARK1 (20): Fig. S1D and E.
pss1-3xUBQ10prom::Lti6b-2xmCHERRY(25): Fig. S1D and F.
pss1-3xUBQ10prom::mCitrine-2xPHFAPP1 (25): Fig. S1D.
pss1-3xUBQ10prom::mCitrine-P4M (25): Fig. S1D and E.
40
pss1-3xUBQ10prom::mCitrine-2xPHPLC (25): Fig. S1D.
pss1-3xUBQ10prom::mCitrine-TUBBYC (25): Fig. S1D.
pss1-3xUBQ10prom::mCitrine-1xPASS (10): Fig. S1D and E.
pss1-3xUBQ10prom::mCitrine-KA1MARK1 (10): Fig. S1D and E.
pss1-3 (10): Fig. 2A and C, Fig. 4A-C and E, Fig. 5F, Fig. S1D and E, Fig. S3A and B, Fig.
S4A-45
24
pss1-4 (10): Fig. S3B, Fig. S17B-F. pss1-5 (10): Fig. S3B, Fig. S17B-E.
pss1-3xpPSS1::PSS1g (pss1-3xPSS1prom::PSS1genomic) (10): Fig. 2A, Fig. S4A, Fig. S17C and
D.
GFP-ROP6 (2x35S::GFP-ROP6) (22): Fig. 3A-B, Fig. 4A, B and E, Fig. S5A-B, Fig. S7A-C, E
5
and F, Fig. S8A-B, Fig. S13D, Fig. S17C and D.
pss1-3xGFP-ROP6: Fig. 4A, C and E, Fig. S5A and B, Fig. S7A, B, E-F
UBQ10prom::2xmCherry-C2LACTx2x35S::GFP-ROP6: Fig. 5C
GFP-ROP6CA (2x35S::GFP-ROP6-CA) (22): Fig. S17C and D.
PSS1-OX (UBQ10prom::PSS1-mCitrine): Fig. 2B and D, Fig. S2A-B, Fig. S4G-I.
10
PSS1-AMI (UBQ10prom::AMI1 and UBQ10prom::AMI2): Fig. 2B and D, Fig. S2A-B, Fig.
S4G-I.
CLC2-GFP (pCLC2::CLC2-GFP) (27) and pss1-3xCLC2-GFP: Fig. S4E. GFP-TUA6 (35S::GFP-TUA6, NASC #6551) and pss1-3xTUA6-GFP: Fig. S4F.
mEos-ROP6 (also called ROP6-OX for phenotypic analyses, 2x35prom::mEos-ROP6): Fig. 2A,
15
Fig. 3C-F, Fig. 5D and E, Fig. S9B-F, Fig. S10B-C and E, Fig. S14D-F.
pss1-3xmEos-ROP6 (also called pss1-3xROP6-OX for phenotypic analyses): Fig. 2A, Fig. 5F,
Fig. S10E, Fig. S16C and D.
mEos-ROP6CA (also called ROP6CA for phenotypic analyses, 2x35S::mEos-ROP6CA): Fig. 2A and
C, Fig. 3D and F, Fig. 4D, Fig. S9A, Fig. S10A and E, Fig. S11A and C. 20
mEos-ROP6CAxpss1-3: Fig. 2A and C
mEos-ROP6CAxPSS1-OX: Fig. 4D, Fig. S11B and C.
mEos-ROP67Q (also called ROP67Q-OX for phenotypic analyses,2x35S::mEos-ROP67Q): Fig.
5D-F, Fig. S14D-5D-F, Fig. S16A and B.
mEos-2xPHEVCT2 (2x35S::mEos-2xPHEVCT2): Fig. 5A and B, Fig. S12A-C.
25
rop6-2 (16): Fig. S14B and C, Fig. S17C and D.
PIN2-GFP (28) (pPIN2::PIN2-GFP) and pss1-3xPIN2-GFP: Fig. S4B-D. rop6-2xPIN2-GFP: Fig. S4B-C.
rop6-2xROP6prom::mCitrine-ROP6: Fig. S13C and D, Fig. S14A-C.
rop6-2xROP6prom::mCitrine-ROP63Q: Fig. S13C.
30
rop6-2xROP6prom::mCitrine-ROP67Q: Fig. S13C and Fig. S14A-C.
UBQ10prom::mCitrine-ROP6-C-term: Fig. S13C and D.
UBQ10prom::mCitrine-ROP63Q-C-term: Fig. S13C.
UBQ10prom::mCitrine-ROP67Q-C-term: Fig. S13C.
PIP2a-mEos (pUBQ10::PIP2a-mEOS) (29): Fig. S14F.
35
Recombinant protein expression and lipid-protein overlay assays.
The expression plasmids pTNT::HA-ROP6cDNA and pTNT::HA-ROP67QcDNA were obtained by
LR recombination between ROP6cDNA/pDONR221, ROP67QcDNA/pDONR221 entry vectors and
the pTNT-HA-ccdb destination vector (42). The expression plasmids pTNT::HA-ROP6cDNA and 40
pTNT::HA-ROP67QcDNA were used as DNA template for in vitro transcription and translation
using the TNT® SP6 High-Yield Wheat Germ Protein Expression System (Promega, www.promega.com), following manufacturer’s instructions. 5μl of the total reaction were used to analyze protein expression levels by western-blot using 1:1000 anti-HA (www.boehringer-ingelheim.com) primary antibody and 1:5000 secondary anti-mouse (GE Healthcare Life Sciences, 45
25
nitrocellulose membranes containing immobilized purified lipids (PIPstrip P-6001, Echelon Bioscience, http://echelon-inc.com/) were incubated for 60 min in blocking solution (TBST (50 mM Tris, 150 mM NaCl, 0,05% Tween 20, pH 7.6) + 3% BSA). Membranes were then incubated for 2h with 10mL of blocking solution containing 40 μl of in vitro synthesized proteins. After three washing steps using blocking solution, membranes were incubated for 120 min at room 5
temperature with primary antibodies diluted in blocking solution, rinsed three times with blocking solution and incubated for 60 min at room temperature with the secondary antibody also diluted in blocking solution. Antibodies and dilutions are the same as described above.
Recombinant protein expression and purification for enzymology assay. 10
The full length ROP6 WT and ROP67Q coding sequences were inserted in pET28a+ between NdeI
and NotI for overexpression in Escherichia coli (DE3) Rosetta pLysS (Novagen, www.merckmillipore.com/). The bacterial culture (2xTY medium, www.sigmaaldrich.com) from overnight preculture was incubated at 37°C. The induction was performed at OD 0.55 with 0.5mM IPTG + 5% glycerol and incubated at 18°C overnight. The cells were pelleted, resuspended in 15
20mM Tris, 400mM NaCl, 5mM beta-mercaptoethanol and flash frozen. After thawing, the cells were lysed by sonication and centrifuged at 15,000g for 35 minutes at 4°C. The supernatant was applied on a Nickel Immobilized Metal ion Affinity Chromatography at room temperature. The beads were washed with 10 volumes of 20mM Tris, 400mM NaCl, 20mM imidazole and then with 5 volumes of 20mM Tris, 400mM NaCl, 60mM imidazole. The beads were then eluted with 20mM 20
Tris, 150mM NaCl, 0.4M imidazole. The elution fraction was centrifuged at 20,000g for 20 minutes at 4°C before purification by the Size Exclusion Chromatography (SEC) column Superdex 75 16/60 in 20mM Tris, NaCl 150mM pH 8 at 1mL/min. The fractions corresponding to ROP6 both pure and non-aggregated are pooled and concentrated at 50 µM.
25
GTPase assay.
The ROP6 proteins used for the assays were never frozen and used less than 24 hours after their purification. GTP hydrolysis was detected using Biomol Green (Enzo lifescience, www.enzolifesciences.com/) following the 1mL sample commercial protocol. The concentrations used for the reactions were 80µM GTP, 10µM ROP6, 10µM BSA in 20mM Tris, NaCl 150mM, 30
2mM MgCl2 pH 8. The GTPase reactions were incubated at 22°C for 75 minutes. The measures were repeated three time, with independent ROP6 purification and independent phosphate calibration for each set of experiments.
Western blot. 35
20μl of the total reaction were used to analyze protein expression levels by western-blot using 1:2000 anti-Eos (A010-mEOS2, https://badrilla.com) and 1:10000 anti H3 (www.boehringer-ingelheim.com) primary antibodies incubated overnight at 4°C. 1:5000 secondary anti-rabbit-HRP antibody was applied at room temperature for 60 min (www.thermofisher.com). For revelation, ECL prime was applied for 30 seconds.
40
qRT-PCR.
Total RNA was extracted using the Spectrum Plant Total RNA Kit (Sigma). Total RNAs were digested with Turbo DNA-free DNase I (Ambion) according to the manufacturer's instructions. RNA was reverse transcribed using the SuperScript VILO cDNA Synthesis Kit (Invitrogen) 45