Behavioral Management Patterns: Small Firms’ Recipe for Growth
byFadi Abou Chacra
Master of Business Administration and
Joshua Rocha
Bachelor of Science in Business Administration; Finance & Project Management SUBMITTED TO THE PROGRAM IN SUPPLY CHAIN MANAGEMENT IN PARTIAL FULFILLMENT OF THE REQUIREMENTS FOR THE DEGREE OF
MASTER OF APPLIED SCIENCE IN SUPPLY CHAIN MANAGEMENT AT THE
MASSACHUSETTS INSTITUTE OF TECHNOLOGY JUNE 2019
© 2019 Fadi Abou Chacra & Joshua Rocha. All rights reserved.
The authors hereby grant to MIT permission to reproduce and to distribute publicly paper and electronic copies of this capstone document in whole or in part in any medium now known or hereafter created. Signature of Author: ____________________________________________________________________
Fadi Abou Chacra Department of Supply Chain Management
May 10, 2019 Signature of Author: ____________________________________________________________________ Joshua Rocha Department of Supply Chain Management
May 10, 2019 Certified by: __________________________________________________________________________ Dr. Josué C. Velázquez-Martínez Executive Director, Supply Chain Management Residential Program Capstone Advisor Certified by: __________________________________________________________________________ Dr. Cansu Tayaksi Postdoctoral Associate Capstone Co-Advisor Accepted by: __________________________________________________________________________ Dr. Yossi Sheffi Director, Center for Transportation and Logistics Elisha Gray II Professor of Engineering Systems Professor, Civil and Environmental Engineering
Behavioral Management Patterns: Small Firms’ Recipe for Growth by
Fadi Abou Chacra and Joshua Rocha
Submitted to the Program in Supply Chain Management on May 10, 2019 in Partial Fulfillment of the
Requirements for the Degree of Master of Applied Science in Supply Chain Management
ABSTRACT
More than 99% of the companies in the world are micro, small, or medium size enterprises and account for ~70% of the jobs, on average, in OECD countries. However, due to a lack of productivity, among other factors, only a third of them survive beyond 42 months. This paper explores the potential associations between behavioral management patterns and business growth and productivity in micro and small enterprises in Latin America. We analyze survey data collected from Mexico and Colombia and observations from company visits and workshops conducted in Mexico with managers of micro and small firms. We observe that risk, delegation, and goal setting are all influential predictive features for business growth and productivity. We also find that the associations between business performance and these behavioral patterns are better captured through non-linear models when compared to linear models. For example, when evaluating the out-of-sample accuracy for revenue growth, the non-linear model performs ~27.29% better than the linear model. This suggests that behavioral patterns are not independent from each other, but rather interact and combine in ways that can create different formulas for successful behavioral management. In addition, our results suggest that behavioral patterns should not always be viewed in terms of extreme terms such as “high” or “low”, as suggested by linear models; but rather that there are optimal, potentially moderate, bounds for the levels of each behavior. For example, the non-linear model for employee growth shows that managers with moderate levels of risk-tolerance have an increased probability of high growth compared to those who exhibit risk levels outside of the optimal bounds. Last, we also observe evidence that suggests that the willingness to adopt new technologies and processes as a behavioral management pattern has little predictive contribution to business growth and productivity, and may instead, be an indicator of the manager’s inability to perform a particular task or job well.
Capstone Advisor: Josué C. Velázquez Martínez
Title: Executive Director, Supply Chain Management Residential Program Capstone Co-Advisor: Cansu Tayaksi
ACKNOWLEDGMENTS
This project and our graduation would not be possible without the many people who have supported us along the way.
We would like to thank our mentor and advisor, Josué C. Velázquez Martínez, for his insightful guidance and for allowing us to collaborate on this important research initiative seeking to improve Latin America’s economic growth and productivity.
We would like to thank our co-advisor, Cansu Tayaksi, for constantly providing insightful feedback and support in developing the work.
We would like to thank Bernarda Serrano and Denise Chin for going above and beyond in assisting and supporting us, and our research project.
We would like to thank the Massachusetts Institute of Technology Enterprise Forum (MITEF), especially Marcelo Tedesco, Francisco Ramos, Mitzi Pineda, Samantha Sencion and Nancy Díaz Cabañas for their gracious reception and support during our stay in Mexico.
We would like to thank the Monterrey Institute of Technology and Higher Education (ITESM) campus Guadalajara, especially Víctor Manuel Rayas Carbajal, José Antonio Rentería Salcedo, Mariana Luna Medina, José David López Aceves, Luis Carlos García Sandoval, Carlos Alberto Delgado Medrano, Martina Vallarta De la Peña and Perla Jazmín Haro Ruiz for supporting and facilitating our research in Mexico.
We would like to thank all 31 MSE business owners – specifically the 3 companies that we visited – for welcoming us into their place of business and taking the time to share their operational and strategic information with us.
We would like to thank our classmates and professors here at MIT for creating an environment of continual learning and challenging us to push the limits of what is possible.
Finally, we would like to thank our families and friends, who encouraged us before we ever started this work, supported us through the journey, and continue to do so after.
Table of Contents
List of Figures ... 6
List of Tables ... 7
1. Introduction ... 8
2. Literature Review ... 10
3. Data and Methodology ... 13
3.1 Company Visits ... 13
3.2 Interactive Workshops ... 14
3.3 Structured-Disguised Survey ... 18
3.4 Classification Tree Analysis & Logistic Regression ... 24
4. Results and Findings ... 28
4.1 Descriptive Statistics ... 28
4.2 Findings from Qualitative Observations – Tower Challenge ... 30
4.3 Findings from Qualitative Observations – Company Visits ... 37
4.4 Findings from Logistic Regression ... 40
4.5 Findings from CART ... 43
4.6 Findings from LOOCV ... 48
5. Discussion and Future Research ... 51
6. Conclusion ... 55
References ... 58
Appendix... 60
Exhibit A – Survey Questions Template ... 60
Exhibit B – Explanation of Survey Questions ... 70
List of Figures
Figure 1. Tower Challenge – Ending cash on-hand by round, by participant ... 31
Figure 2. Tower Challenge – $ Amount of supplies purchased by round, by participant ... 32
Figure 3. Tower Challenge – Tower height by round, by participant ... 32
Figure 4. Decision tree model for revenue growth category ... 44
Figure 5. Decision tree model for employee growth category ... 44
Figure 6. Decision tree model for productivity category ... 45
Figure 7. Scatter plot for decision tree model for revenue growth category ... 46
Figure 8. Scatter plot for decision tree model for revenue growth category (survey goals branch) ... 46
Figure 9. Scatter plot for decision tree model for employee growth category ... 47
Figure 10. Scatter plot for decision tree model for productivity category ... 47
Figure 11. Optimized logistic regression threshold ROC points for each target ... 50
Figure 12. Optimized CART threshold ROC points for each target ... 50
List of Tables
Table 1. Example of Positive-Positive structured survey question... 20
Table 2. Example of Positive-Negative structured survey question ... 21
Table 3. Example of Positive-Positive structured survey question with associated scores ... 22
Table 4. Example of aggregated average scores for each behavioral pattern category... 23
Table 5. Overview of scores associated with respective hypothesis ... 23
Table 6. Descriptive statistics for sample population ... 28
Table 7. Descriptive statistics for target variables ... 29
Table 8. Descriptive statistics for behavioral patterns ... 29
Table 9. School, Inc. - behavioral pattern scores and organization metrics ... 38
Table 10. Jewelry, Inc. - behavioral pattern scores and organization metrics ... 39
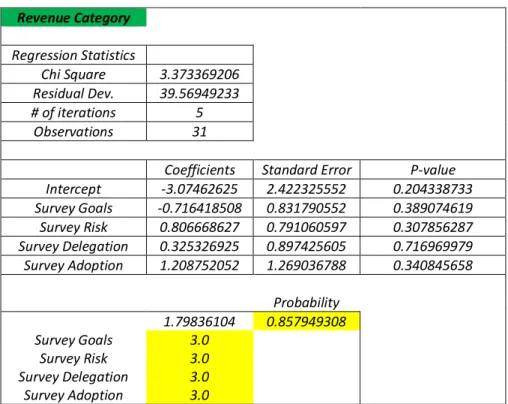
Table 11. Logistic regression output for revenue growth target variable ... 41
Table 12. Logistic regression output for employee growth target variable... 41
Table 13. Logistic regression output for productivity target variable ... 42
1.
Introduction
More than 99% of the companies in the world are micro, small, or medium size enterprises (MSMEs) and account for ~70% of the jobs on average in OECD countries. Additionally, MSMEs in OECD countries represent, on average, more than half of total exports in value added terms. (Organization for Economic Cooperation and Development, 2017). However, due to a lack of productivity, among other factors, only a fraction of them survives and develops into high-growth firms.
The purpose of this study is to explore and identify which behavioral management patterns may contribute to the growth and productivity of micro and small enterprises (MSEs) in Latin America. Abiding by the OECD definition, we define MSEs as firms with no more than 50 employees. MSEs are significant because of the important role they play in the economies of developing countries. An International Labor Organization (ILO) study (2003) specifically found that firms with fewer than 10 employees make up more than 50% of all employment in countries such as Mexico, Paraguay, and Bolivia.
Many MSEs either fail to grow, or simply fail altogether, contributing to instability and inefficiencies throughout many supply chains. A 2005 study conducted by the Global Entrepreneurship Monitor (GEM) found that the survival rates for firms beyond 42 months were only ~33% for Latin American countries such as Argentina, Venezuela, Chile, and Mexico (Von Broembsen, Wood, & Harrington, 2005). Many studies have found that Latin America’s stagnation in macroeconomic performance in recent decades is the result of low labor productivity (Cole, Ohanian, Riascos, Schmitz Jr, 2005; Lederman, Messina, Pienknagura, Rigolini, 2014).
While much research has been conducted related to MSEs in recent decades, we find that there is an opportunity to contribute to the growing research literature by expanding the understanding of behavioral management patterns and their potential effects on the growth and performance of MSEs. In an ever-changing marketplace, organizational growth and productivity improvements are key for a firm’s
survival. To this end, we focus our research on four key behavioral management patterns; 1. Risk (tolerance vs. aversion), 2. Goal setting, and one’s belief in their innate ability to achieve goals (self-efficacy or an internal locus of control), 3. Delegation of tasks to employees, and 4. The willingness to adopt new processes and technologies.
We test the following hypotheses:
1. Higher levels of risk-tolerance are associated with increased productivity and growth in MSEs.
2. Higher levels of goal-setting and self-efficacy are associated with increased productivity and growth in MSEs.
3. Higher levels of delegation of tasks to employees is associated with increased productivity and growth in MSEs.
4. Higher levels of adoption of new processes and technologies is associated with increased productivity and growth in MSEs.
We measure growth by analyzing sales revenues and employee counts in 2018 compared to 2016. Sales revenues and employee counts are usually the few reliable metrics that can be gathered within MSEs since many MSE managers do not have access to advanced technology resources and typically do not implement advanced business management practices. Past research has found these metrics to be common forms of measurement, and relatively methodologically uncontroversial (Delmar et al., 2003; Freel and Robson, 2004; Robson and Bennett 2000; Dobbs and Hamilton, 2007).
Since productivity is a key factor for the success of a firm (Cole et al., 2005), in this study we present a productivity index that is calculated from the few metrics available to us. “The central mission of a productivity index is to illuminate how a business can get more units of output per labor hour, per machine, and/or per pound of materials than its competitors” (Chew, 1988, para. 9). We will measure
productivity by taking a ratio of annual sales revenues divided by employee count for each of the three years (i.e., 2018, 2017, and 2016). We then calculate the average ratio from these three years to better capture the business’s productivity across time. The resulting ratio allows us to measure output (sales) given a certain input (employees) and create a comparable productivity metric.
We utilize both qualitative and quantitative methodologies to analyze the potential associations of behavioral management patterns to growth and productivity. For the quantitative methodologies specifically, we utilize logistic regression as well as classification and regression tree (CART) modeling and compare the models on classification accuracy and model generalizability.
Our research is performed in conjunction with the MIT GeneSys project – a research initiative started in 2016 that focuses on contributing to small business growth in the developing countries by improving supply chain management and business expertise (https://ctl.mit.edu/mit-genesys). At the time of this research, the MIT GeneSys project has partnerships with 16 universities and one government institution in Latin America.
2.
Literature Review
An increasing number of studies have been conducted related to MSEs in recent decades. Churchill and Lewis (1983) published a key article in the field of small business nearly 40 years ago, analyzing the five stages of small business growth. Since then, small business research has received increasing interest from the academic and regulatory arenas. For example, the OECD, as well as the ILO, have made small business a key research focus within their organizations, each publishing annual reports related to small businesses. We explore the research conducted in this field as well as research conducted in the field of psychology since we are inherently studying behavioral management patterns.
Bloom and Van Reenen (2007) challenged the basic assumption of whether management practices matter in the performance and growth of medium-sized firms. Their research concludes that, in fact, better-managed firms do perform better in terms of both productivity and sales. They also find that the quality of management practices strongly correlates to per-capita income at the country level. McKenzie and Woodruff (2016) pose the same basic question but explore the realm of MSEs rather than medium size firms. They find that the effects of management practices on MSEs is very similar to those found for medium size firms.
Further, McKenzie and Woodruff (2016) propose that management practices should be segmented into two realms; “human relations” and “business practices.” They build on this concept by concluding that “human relations” practices are more important for medium and large firms, and less important for MSEs. On the other hand, they claim that “business practices” such as marketing, record keeping, financial planning, and stock control are more important for MSEs. They find that an increase of one standard deviation in business practice scores, is associated with a 35% increase in labor productivity and a 23% increase in overall productivity. Building upon this research, we analyze if and what behavioral management patterns may potentially lead to, and predict, better “business practices,” and therefore, increased productivity and growth.
Mel, McKenzie, and Woodruff (2014) assess the impacts of two factors on MSE growth: managerial training and capital infusion. They find that both factors have only a temporary positive impact on small business growth that diminishes rapidly after the trials end. The authors suggest that selecting factors based on managerial ability or aspirations may provide better predictive insights into MSE’s ability to sustain business growth.
Sharma and Tarp (2018) find that MSEs in Vietnam that display higher levels of risk aversion are more likely to experience lower revenues. Additionally, Hanifzadeh, Talebi and Sajadi (2017) research the
same hypothesis, but in a positive correlative form. They find that small and medium enterprises in the Tehran Province that exhibit higher levels of risk taking achieve higher levels of growth than those who do not. Our first hypothesis regarding risk tolerance/aversion will test these findings in Latin American countries and build upon this research.
Sharma and Tarp (2018) also find that managers who exhibit higher levels of locus of control are more likely to obtain higher levels of revenue. Our second hypothesis assessing goals and self-efficacy is derived from the concept of locus of control. Locus of control was first coined by Rotter (1966). Later, Bandura (1977) built on this psychological concept by coining the term “self-efficacy”. Both terms allude to one’s innate belief in their ability to accomplish difficult tasks or goals. The underlying concept posed by Bandura is that perceived self-efficacy creates perceived outcomes. In other words, those who have low self-efficacy, or an external locus of control will tend to perceive difficult tasks or goals as unobtainable, and they may never attempt to accomplish them. Whereas those who have high self-efficacy or an internal locus of control, will be more likely to perceive difficult tasks or goals as obtainable, creating self-motivation and a movement to action.
Sharma and Tarp (2018) also find that innovativeness is not only associated with higher chances for increased revenues, but it is also associated with an increased probability of product innovations. They describe innovativeness as “openness and creativity of individuals, and a willingness to look for new ways and solutions” (Sharma and Tarp, p.2). From this description, the concept of innovativeness encompasses a vast area of topics, including product innovations. Therefore, we attempt to breakdown this idea of innovativeness into a smaller subset, and focus on one aspect of innovativeness, namely; a manager’s willingness to adopt new technologies or processes.
Nunes and Paulino (2018) present a system dynamics model that hypothesizes that organizations can only grow as much as they have available in capacity, and therefore, there can be no growth without,
first, an increase in capacity. Increased capacity is not only needed for equipment and machinery, but also in the form of human capital; hiring, training, and delegation.
Arizaleta-Valera and Zhu (2018) reinforce the research of Nunes and Paulino (2018) and also build on the research of Churchill and Lewis (1983). They suggest that as a firm grows, a small business owner must be able to trust others with certain tasks and responsibilities in the organization if the business is going to grow beyond the individual owner’s capabilities and capacities. We will test this concept of trust and delegation as a variable on growth and productivity.
3.
Data and Methodology
Our research explores and evaluates behavioral management patterns and business performance, each of which inherently include both qualitative and quantitative aspects. Therefore, in order to properly evaluate these concepts, our research methodology combines both qualitative and quantitative methodologies. There are two qualitative methodologies: 1. Company visits and 2. Interactive workshops. There are two quantitative methodologies: 1. Structured-disguised survey and 2. Classification and Regression Tree (CART) Analysis as well as Logistic Regression Analysis. We will explain each methodology in detail in the following four sections. A visual depiction of the research methodology is provided in Appendix C.
3.1 Company Visits
In order to obtain a better understanding of the day-to-day operations and challenges that MSEs face, we visited three companies within Latin America, namely in Mexico. These visits allowed us to examine the company at a micro level where we were able to examine details of the products, equipment, services, and environments found within the firm. All three companies that we visited were from the retail
trade industry and the types of services and products included stationery, hand-made jewelry, and cosmetics. During our visits we utilized two techniques to gather relevant information.
The first technique was visual observation, which allowed us to observe the company’s assets and operations such as products, equipment, processes and customer interactions. Additionally, we were able to analyze processes such as manufacturing, packaging, selling, inventory management and administrative work. Furthermore, we observed the relationships and behaviors between the owners, employees, and customers. This technique gave us a general idea of how the businesses are operating overall and shed light upon organizational strengths and potential areas of improvement.
The second technique was the use of open-ended questioning to gain additional insights from the owners and employees. This inductive method was conducted in parallel with our visual observation. We used this Q&A interaction to obtain more information about the business practices that are not immediately apparent through passive observation. Many of the questions aim to provide insights around the four behavioral and managerial patterns outlined earlier in the paper: Risk tolerance/aversion, goal-setting and self-efficacy, delegation of tasks to employees, and the willingness to adopt new processes and technologies.
3.2 Interactive Workshops
In addition to the company visits, we also conducted a workshop in Guadalajara, Mexico, with the participation of 25 MSE owners. The workshop was organized with the following three segments: 1. an introduction and overview about the MIT GeneSys project, and a discussion about the current status of MSEs in Latin America; 2. an interactive activity that we have named “The Tower Challenge” (adapted from the Marshmallow Challenge, Wujec, 2010); and 3. an interactive, reflective group discussion where participants are encouraged to share their personal insights and observations.
The first segment provides the participants with an introduction to the workshop and explains the goals of the research for the MIT GeneSys project. As stated by Velázquez Martínez, et al. (2018), the objective of MIT GeneSys is to provide a “framework of managerial insights aimed at improving productivity and competitive advantage in the small firms.” Additionally, the participants are provided with information around previous research conducted through MIT GeneSys and how their participation will help to continue the research in the future.
The second segment includes what we have named “The Tower Challenge”. The Tower Challenge is our modified version of what is commonly known as the “The Marshmallow Challenge” and aims to simulate a small business environment that allows MSE owners to make businesslike decisions. The Marshmallow Challenge is a team challenge designed by Peter Skillman in the early 2000’s. Tom Wujec (2010) discussed this challenge in his TED Talk, “Build a Tower, Build a Team.” The Marshmallow Challenge is relatively simple; a team of 4 is provided with 20 spaghetti noodles, 1 yard of tape, 1 yard of string, and one marshmallow. The objective is for the team to build the tallest free-standing structure by using the provided supplies in 18 minutes. The main constraint is that the one marshmallow has to be placed on top of the tower, and the tower must remain standing on its own.
Wujec (2010) concludes that in order to have a high rate of success in this challenge, teams must recognize the importance of the iterative creation process and build fast, successive prototypes, starting with the marshmallow. The hypothesis is that this iterative process helps the respective team formulate a more cohesive structure around the marshmallow.
We have redesigned Skillman’s “Marshmallow Challenge” to be more aligned with our research in business and behavioral management patterns. This simulation acts as a medium for us to observe how the participants actually behave when faced with business decisions similar to those in real life. The Tower
Challenge will help us to test the potential biases that may exist in the participant’s responses of the structured-disguised survey (discussed in Section 3.3).
We have strategically integrated some of the survey questions into the Tower Challenge as actionable decisions. As the participants are making decisions throughout the Tower Challenge, they are also, unknowingly, answering many of the survey questions through real decision-making. This allows us to compare the participant’s survey responses with their actual behaviors exhibited during the challenge.
The Tower Challenge is played individually rather than in teams, as is done in the Marshmallow Challenge. Additionally, we introduce monetary incentives and financial markets into the Tower Challenge. The objective of the Tower Challenge is not to necessarily create the tallest tower overall (although it does help), but rather to have the most cash on hand at the end of the challenge. At the beginning of the challenge, each participant is supplied with 10 spaghetti noodles, 20 medium-sized marshmallows, and a goals/budget worksheet where participants can keep track of their financial transactions and goals (the sheet is collected at the end of the workshop to examine the level of goals/KPIs that the participant adopted for the challenge).
The Tower Challenge includes three 15-minute rounds, with a ten-minute break in between each round to let participants buy supplies and change or develop new strategies. The participants are awarded $0.10 for every centimeter in tower height at the end of each round. Participants are also given the opportunity to purchase additional supplies such as spaghetti noodles and marshmallows for the price of $0.25 each and a ruler at the price of $1. Moreover, players can take out bank loans up to $5 with 20% compound interest rate accrued each round it is unpaid; however, a contestant cannot take out another loan if he or she already has an outstanding loan balance. An outline of each round is shown here:
§ Round One: Participants are given the option to receive $3 at the beginning of Round One or wait and receive $5 at the beginning of Round Two. Towers are measured at the end of the round and the money is awarded respective to the participant’s tower height.
§ Round Two: New supplies are introduced in addition to the original supplies. Participants now have the option to purchase straws and Styrofoam cups at a cost of $0.50 each. Furthermore, a tower design guide can be purchased for $3. In this round, we are imitating new market dynamics to measure the participant’s levels of adoption of new processes/technologies. Towers are measured at the end of the round and the money is rewarded respective to the participant’s tower height.
§ Round Three: What was applicable in Round Two is applicable in this round with no changes. Towers are measured at the end of the round and the money is rewarded respective to the participant’s tower height. At the end of this round, all unpaid bank loans will be due and deducted from total winnings, and the participant with the most cash on-hand wins.
We close the workshop with an interactive, reflective session where we elicit feedback from the participants and ask about their own internal observations of their behavioral patterns and strategies. Some of the questions we ask are:
§ Who took $3 at the beginning of round one and why? Who instead waited until round two to get $5 and why?
§ Who made goals? Did you achieve them? Were they important? § Who kept a budget and tracked all transactions? Was it helpful? § Who took a bank loan? When and Why?
The closing session is important as it allows us to extract internal information from the participants that can’t be observed during the activity. Moreover, conducting this session minimizes the probability of misinterpreting the participants’ behavior in the workshop.
3.3 Structured-Disguised Survey
In addition to our observational methodologies, we also apply quantitative methodologies through the administration of a survey in Mexico and Colombia. This survey allows us to explore the behavioral management patterns from the internal perspective of the participant, rather than relying solely on our external observations in the research. We can then superimpose these external and internal observations to derive deeper insights into each participant’s behavioral management patterns. Additionally, because we can only physically visit a limited number of companies, and only a limited number of companies are able to participate in our workshop, this survey significantly increases the number of observations available to us.
It is well known that one of the main challenges in collecting data and information from surveys is the possibility that respondents may provide untruthful or inaccurate responses to survey questions. This tends to happen more frequently when survey questions contain sensitive topics or contain an aspect of “social desirability” (Tourangeau & Yan, 2007; Rosenfeld, Imai, & Shapiro, 2016; Brenner & DeLamater, 2016). Social desirability is the extent to which a survey question elicits a response that is seen to be socially (un)acceptable or socially (un)desirable (Tourangeau et al., 2000). Brenner et al. (2016) further hypothesize that identity theory also introduces potential bias in survey respondents. “Because these behaviors are valued and widely seen as good—for the individual, his or her community, or society—they are claimed on surveys even when the respondent’s behavior does not support such claims” (Brenner & DeLamater, 2016, p. 1).
Given that our research explores the realm of behavioral management, we are aware that our research could be susceptible to some levels of social-desirability and identity-theory biases. The research
literature surrounding social desirability bias and identity theory bias is large, and we do not seek to provide a comprehensive review of the literature within this paper, rather we simply use them as foundational theories for the structure of our survey.
Velázquez Martínez, et al. (2018) also realized the potential of these biases when developing the survey model and data collection guidelines for the MIT GeneSys project. Therefore, in an attempt to mitigate this bias, they incorporated “validation” questions.
The MIT GeneSys survey consists of many direct questions that usually reference a specific business management practice, such as comparing product price offerings to the competitor’s product price offerings. The direct question would elicit a simple yes or no response; e.g. the respondent either does or does not compare prices. The validation questions are asked after a direct question and are meant to confirm the response to the direct question. This validation question is usually framed as an open-ended question and requires the respondent to recall some fact about the referenced business practice, e.g. how frequently are you comparing prices with your competitors?
Taking guidance from the vast literature on social desirability bias and identity theory bias, as well as guidance from the MIT GeneSys leadership experiences, we have developed what we call a “structured-disguised” survey. A structured survey is one that “…consists of a set of standardized questions with a fixed scheme, which specifies the exact wording and order of the questions, for gathering information from respondents” (Cheung, 2014, p. 6400). Disguised methods are usually referenced when describing observational surveys, where the participants do not know that they are being observed. However, our survey is not observational in nature, but we have applied the concept of a disguised method to it. Simply put, we do not tell the participants what the specific purpose of the survey is, and we disguise our questions so the participants cannot easily identify what our objectives are for the survey.
The survey was administered online, and the web link was provided to each manager via email. This method allowed the participants to complete the survey on their own time and in the comfort of their own environments. The survey consists of 33 questions, of which the first 13 questions are descriptive and demographic in nature, including: name, gender, company name, industry, city/country, annual revenues, and annual employee counts.
The last 20 questions are structured-disguised questions, which can all be found in Appendix B with detailed information for each question. The 20 structured-disguised questions consist of five questions for each of the four behavioral management patterns: goals, risk, delegation, and adoption of new technologies/processes. All 20 structured-disguised survey questions are multiple-choice with scaled responses. Most structured-disguised questions provided the participant with two statements, along with four options to select from on a typical Likert scale (strongly agree, agree, etc.).
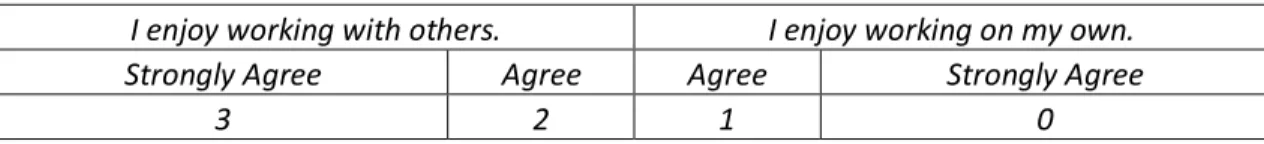
The structured-disguised questions are written such that the available choices are phrased in a positive reference, in an effort to avoid loaded, leading, or biased statements. For example, the structured-disguised question shown in Table 1 provides two positive statements that seem neutral to the participant, mitigating potential bias towards either response.
Table 1. Example of Positive-Positive structured survey question
I enjoy working with others. I enjoy working on my own.
Strongly Agree Agree Agree Strongly Agree
This is in contrast to the structured-disguised question shown in Table 2 which provides a positive and negative option for the participant to select from on the Likert scale. This positive-negative question structure may lead to bias towards the positive response under the identity theory and social desirability theory structures.
Table 2. Example of Positive-Negative structured survey question
I enjoy working with others. I do not enjoy working with others.
Strongly Agree Agree Agree Strongly Agree
It is important to note here that three of the five structured-disguised questions in the risk section are somewhat different from the typical Likert scale shown in tables one and two. For these three specific risk questions, we provided the participant with a scenario and multiple options to select from in response to that scenario. The economics research community has provided a vast amount of literature around the measurement of individual risk aversion and risk tolerance. One of the most common forms of individual risk measurement that is utilized is asking a survey participant for the reservation price of a hypothetical lottery ticket (Ding, Hartog, and Sun, 2010; Donkers, Melenberg, Van Soest, 2001). Our version of this lottery scenario is written as: “Assume that if you buy a lottery ticket, you will have a 10% chance of winning $1,000 USD. If you had exactly $1,000 USD in your savings account, how much would you be willing to pay for the lottery ticket?”
However, we believe that this hypothetical lottery scenario has two underlying assumptions that prevent us from accurately measuring an individual’s true comprehensive risk profile based on this scenario alone. The first assumption is that everyone is willing to gamble in a lottery. A person may view gambling as against their religious or personal ideologies, and therefore, would likely respond to the lottery question with $0 based solely on personal ideologies. This could be misinterpreted as the participant being highly risk averse.
A second assumption in the lottery scenario is that personal gambling risk is the same as other risks. Weber, Blais, and Betz (2002) challenge this assumption and find “…that risk-taking is indeed content-specific”. Their research expanded to include five content domains for risk measurement: financial decisions, health/safety, recreational, ethical, and social. We too have expanded our risk profile
measurements, but we will use four domains instead of five. Our four domains are segmented as: personal finance, business finance, family finance, and general safety. We believe these four domains will allow us to capture a more complete picture of a participant’s risk profile. The remaining 17 Likert-scale questions are explained in Appendix B.
With the survey responses, we are able to compile behavioral management profiles for each participant and for each area of focus (goals, risk, delegation, adoption of new technology/processes) by converting the responses into quantifiable “scores.” For the 17 Likert-scale structured-disguised questions, we simply record the response as 0, 1, 2, or 3. A score of three would represent a response that supports the respective hypothesis, whereas a score of zero would represent a response that is opposite of the hypothesis. If we use the same example from Table 2 above, the scores associated with each respective response would be as shown in Table 3 below.
Table 3. Example of Positive-Positive structured survey question with associated scores I enjoy working with others. I enjoy working on my own.
Strongly Agree Agree Agree Strongly Agree
3 2 1 0
The question shown in Table 3 is categorized within the delegation category. Our hypothesis is that higher levels of delegation of tasks to employees is associated with increased productivity and growth in MSEs. The question shown in Table 3 posits that those who enjoy working with others are more likely to be delegators. This is not to say that those who prefer to work on their own are poor delegators. Rather, we argue that those who prefer to work on their own are less likely to hire additional employees, and therefore, will have fewer people to delegate to, resulting in a more centralized organizational structure, and therefore, lower levels of overall delegation. Therefore, participants who “Strongly Agree” with the statement, “I enjoy working with others,” would score a three on the Likert scale, whereas participants who “Strongly Agree” with the statement, “I enjoy working on my own,” would score a zero.
Once we convert all responses to the respective scores, we simply calculate the average score for all five questions from each of the four sections. The resulting score output for individual participants will look like the output shown in Table 4. With this method, a participant’s score will always be rangebound between zero and three. Within Table 4, we would derive that participant 18 is highly goal-oriented based on their high goals score of 3.0, while participant 13 is on the low end of the goals scale with a score of 1.0, making them more task-oriented. The same logic can be applied to all four areas in relation to the respective hypothesis. Table 5 shows a high-level, comprehensive score scale for each of the four areas.
Table 4. Example of aggregated average scores for each behavioral pattern category Participant # Goals Risks Delegation Adoption
18 3.00 1.98 1.80 2.40
1 2.20 1.32 2.40 2.40
13 1.00 1.65 1.00 1.60
27 1.40 1.36 2.20 2.20
3 2.20 1.43 1.80 2.60
Table 5. Overview of scores associated with respective hypothesis
Goal-Oriented 3 2 1 0 Task-Oriented
Risk-Tolerant 3 2 1 0 Risk-Averse
High Delegation 3 2 1 0 Low Delegation
High Adoption 3 2 1 0 Low Adoption
Finally, it is important to note here that the concept of a disguised survey should not be confused with an indirect survey method, which is commonly used in social psychology and economics research. “Indirect questioning/indirect response (IR) techniques are…meant to veil the answers of individual respondents’ engagement in sensitive behaviors to the investigators, enumerators, and other individuals” (Chuang, Dupas, Huillery, and Seban, 2019). As described by Chuang, et.al., IR techniques are meant to disguise the answers of the respondents from the researcher, rather than disguise the purpose of the survey from the respondent, as is the case for our survey.
3.4 Classification Tree Analysis & Logistic Regression
In total, we received 31 completed surveys, 29 from MSE owners located in Mexico and 2 from MSE owners located in Colombia. To analyze these survey results, we utilize logistic regression analysis as well as classification and regression tree (CART) analysis to identify the possible relationships in the data. We first use logistic regression to identify if the relationships are linear in nature, as past research has alluded to. We will then challenge the assumption of linearity through CART analysis which will allow us to observe potential non-linear relationships in the data. We will then compare both of these methods in terms of model prediction accuracy, model strength, and model generalizability.
“CART analysis is a tree-building technique which is unlike traditional data analysis methods… CART is often able to uncover complex interactions between predictors which may be difficult or impossible to uncover using traditional multivariate techniques” (Lewis, 2000). The research literature surrounding logistic regression and CART is vast, and we do not seek to provide a comprehensive review of the literature within this paper, rather we simply use them as foundational models for the structure of our quantitative methodology.
The quantitative methodology includes five stages:
1. Define and quantify the target metrics.
2. Convert the target metrics to binary classifiers. 3. Set target variables and predictive features. 4. Employ logistic regression and CART models.
5. Conduct cross-validation to measure model generalizability and classification accuracy.
Stage 1: Because we are inherently constrained to revenue and employee counts by the limited available data from MSEs, we define business growth through two measures: revenue growth and
employee growth. For both of these growth measures, we calculate the ratio of revenues and employee counts in 2018 to the revenues and employee counts in 2016. Past research has found these metrics to be common forms of measurement, and relatively methodologically uncontroversial (Delmar et al., 2003; Freel and Robson, 2004; Robson and Bennett 2000; Dobbs and Hamilton, 2007).
We can also measure productivity through the use of the same revenue and employee count metrics. Productivity is calculated by taking the ratio of annual revenues divided by the employee counts for each of the three respective years, and then averaged over all three years (2018, 2017, 2016). The resulting ratio allows us to measure output (revenues) provided each input (employees). It is important to note here that all company revenues were reported in the respective business country currency. All currencies were converted to US dollars using the annual average exchange rate for each respective year and each respective country in order to normalize the currencies.
Stage 2: Once the growth and productivity metrics are calculated for each participant, we then convert each of the three-individual metrics to a binary value. To do this, we first calculate the median value for the total sample population for each of the three-individual metrics: revenue growth, employee growth, and productivity. This median value becomes the threshold at which participants are evaluated and classified in respect to the sample population. If a participant’s individual metric value is above the median, they are listed as high growth (HG) or high productivity (HP) (depending on the metric). If the participant’s metric value is equal to or below the median, they are listed as low growth (LG) or low productivity (LP). The respective classifications are applied to each participant and each metric and can be analyzed through the logistic regression and CART models. High growth and high productivity are classified as 1, while low growth and low productivity are classified as 0.
Stage 3: Revenue growth, employee growth, and productivity are set as target variables, and the participant’s four behavioral pattern (goals, risk, delegation, and adoption) scores, derived from the survey, are set as predictive features.
Stage 4: We first apply logistic regression and CART to the full dataset in order to derive a full-sample model that we can use to evaluate which features may be most important in predicting the target variables. The aim for these full-sample models is to provide an overall conceptual framework that describes which behavioral patterns are more likely to lead to increased business growth and/or productivity.
Stage 5: Last, we measure the generalizability and classification accuracy of both models by conducting leave-one-out cross-validation (LOOCV). LOOCV is the most extreme form of the common method, k-fold cross-validation. LOOCV allows for a model to be trained on n-1 observations (where n is equal to the total number of observations). This method allows us to train the models on 30 observations, leaving one observation to be used as the test observation. The process is repeated 31 times, with each observation being used as a test observation exactly once. “Leave-one-out cross-validation provides a sensible model selection criterion as it has been shown to provide an almost unbiased estimate of the true generalization ability of the model” (Cawley and Talbot, 2004).
We selected LOOCV in favor of other cross-validation methods because of the limited number of observations available to us. Because we have 31 total observations available, it is quantitatively expensive for us to remove any number of observations from the dataset for testing, so we limit this cost by using LOOCV. LOOCV becomes more computationally expensive as n increases, but given the limited size of our dataset, computational cost is not an issue for our study.
When utilizing the CART model, we first need to calculate and determine the optimal tree-depth to reduce the risk of overfitting or underfitting. We want the model to be large enough to allow for the
possibility of all four features to be utilized as splits in the tree. Although, at the same time, we need to constrain the tree-depth, and therefore, the number of splits, to reduce the risk of overfitting. We have solved this through a simple optimization model, explained here:
The number of terminal nodes (tn) in a tree can be calculated by taking two to the power of the specified depth (Molnar, 2019). We can then calculate the total number of possible splits (s) as tn - 1. Therefore, we optimize the tree-depth to minimize s with the constraint s >= 4.
If we were to select a tree-depth of two, we would have a maximum of three splits (s = 22 – 1),
only allowing for potentially three of the four features to be used in the model, and not satisfying the constraint. A tree-depth of three, however, allows for a maximum of seven splits (s = 23 - 1), which is the
first instance that satisfies the optimization constraint and the resulting minimized objective. Therefore, a tree-depth of three allows for the possibility of each of the four features to be used in the model at least once, reducing the risk of underfitting, and also reduces the risk of overfitting by minimizing the number of splits, and consequently, the tree-depth.
It is important to note here that this does not guarantee that all four features will actually be used in the model; rather, this only allows for the possibility for all four features to be used in the model. For example, one feature may be substantially stronger in predicting the target variable than another. In this case, the stronger feature may be used multiple times in a decision tree at different splits in place of the other feature(s).
4.
Results and Findings
In this chapter, we discuss the results and findings of our study. We begin by showing descriptive statistics, then present qualitative observations through the tower challenge and company visits, and conclude with quantitative findings from logistic regression, CART and LOOCV.
4.1 Descriptive Statistics
Of the 31 survey participants, 13 participants are female, and 18 participants are male. The most common industries are retail, manufacturing, and wholesale trade, with these three industries making up ~75% of the total sample population. The vast majority of participants are located in Mexico (29), with two participants located in Colombia. Table 6 shows the descriptive statistics for the size of the organizations of the survey population, with the median organization comprising of 13 employees and $187,210 in annual revenues as of 2018.
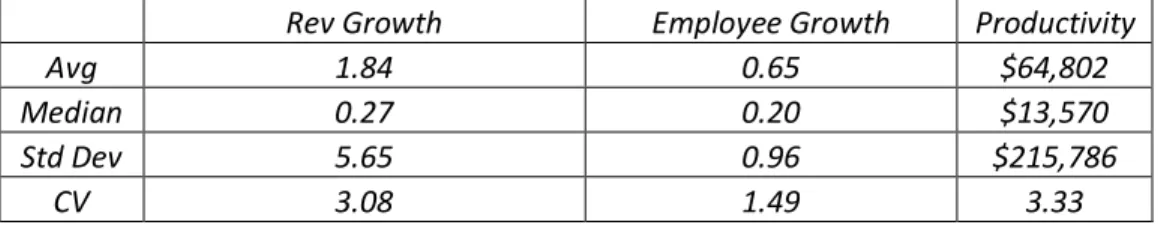
Table 7 shows the median revenue growth rate in 2018 over 2016 to be 27%, while the median employee count growth rate was 20% for the same years. The median productivity averaged over all three years amounts to $13,570 per employee. There is large variation in these measures, as seen in the elevated levels of averages and high coefficients of variation (CV).
Table 6. Descriptive statistics for sample population
Number of employees in 2018 Avg Annual Rev 2018 USD
Avg 13.26 $1,268,706
Median 13.00 $187,210
Std Dev 8.94 $4,566,475
Table 7. Descriptive statistics for target variables
Rev Growth Employee Growth Productivity
Avg 1.84 0.65 $64,802
Median 0.27 0.20 $13,570
Std Dev 5.65 0.96 $215,786
CV 3.08 1.49 3.33
Table 8 shows the sample population statistics for the four behavioral pattern scores derived from the survey responses. Each behavioral pattern is relatively uniform in nature, with relatively low variation in the data. We would expect these lower levels of variation given that the measures are constrained between the values of zero and three. Overall, the median scores for each behavioral pattern are in the range of 1.68 to 2.20. Assuming that a measure of 1.5 depicts an average score, we can conclude that the median group measures slightly above average in all four behavioral patterns.
Table 8. Descriptive statistics for behavioral patterns
Survey Goals Survey Risk Survey Delegation Survey Adoption
Avg 1.90 1.55 1.99 2.05
Median 2.00 1.68 2.20 2.20
Std Dev 0.52 0.52 0.56 0.43
CV 0.27 0.34 0.28 0.21
Risk is found to have the lowest median score of all behavioral patterns, while also having the greatest amount of variation. On the other hand, adoption has the highest median score of all behavioral patterns, and the least amount of variation. Given the characteristics of the risk data, we hypothesize that risk could be a strong feature for classification models. Additionally, based on the same logic, we hypothesize that adoption could be a weak feature for classification models. We will explore these hypotheses later in this section.
4.2 Findings from Qualitative Observations – Tower Challenge
All of the qualitative observations were conducted in the Guadalajara, Mexico, region in February 2019. We will explore each of the observation methods (Interactive Workshop and Company Visits) in chronological order, beginning with the Tower Challenge that was conducted at the workshop with 25 MSE owners from the Guadalajara region. Of the 25 attendees, 20 participated in the Tower Challenge for the entire duration of the challenge. Of the 20 participants, 14 completed the survey in full.
Attending the workshop as volunteers were six undergraduate students from Monterrey Institute of Technology, and six employees from Massachusetts Institute of Technology Enterprise Forum, also known as MITEF. The volunteers helped to organize materials, enforce rules, and facilitate transactions within the Tower Challenge. Additionally, before the workshop, we briefed the volunteers on our research and the objectives of the Tower Challenge for our research. This allowed the volunteers to take observational notes of the participant activities and behaviors throughout the challenge, providing a broader collection of observations for the research.
Additionally, before the workshop, we developed a cloud-based spreadsheet that was shared with the volunteers and would capture all participant decisions and financial transactions throughout the challenge. The volunteers were trained on how to use the spreadsheet before the workshop. This shared spreadsheet allowed the volunteers to capture data and transactions quickly, while also eliminating the need for paper transactions and manual calculations. It also provided us with all of the data in one comprehensive document, providing more accurate data and making the data analysis relatively fast compared to paper tabulation.
Figure 1 shows the ending cash on-hand by round, by participant. Because the objective of the game is to have the most cash on-hand at the end of round three, we have sorted the values by ending cash on-hand for round three, highest to lowest. From this, we can correctly conclude that participant 19 won the challenge overall. Figure 2 and Figure 3 are sorted by the same value. Figure 2 shows the amount
of supplies purchased each round, by participant; while Figure 3 shows the tower height by round, by participant. We will explore this data and the corresponding behavioral patterns through the observational notes compiled during the challenge.
When we compare Figure 1 and Figure 3, we find that having the tallest tower overall does not guarantee a winning position. The top five finalists all had similar tower heights, with third place having the overall tallest tower of the challenge. Additionally, comparing Figure 1 and Figure 2, we find that there is somewhat of an inverse relationship between the amount of supplies purchased and the final cash on-hand amount.
Figure 1. Tower Challenge – Ending cash on-hand by round, by participant $0.00 $5.00 $10.00 $15.00 $20.00 $25.00 $30.00 19 9 10 14 15 3 22 26 18 12 7 11 4 1 5 24 8 25 27 13 CA SH O N -HA N D PARTICIPANT #
Figure 2. Tower Challenge – $ Amount of supplies purchased by round, by participant
Figure 3. Tower Challenge – Tower height by round, by participant
$0.00 $2.00 $4.00 $6.00 $8.00 $10.00 $12.00 $14.00 $0.00 $2.00 $4.00 $6.00 $8.00 $10.00 $12.00 $14.00 19 9 10 14 15 3 22 26 18 12 7 11 4 1 5 24 8 25 27 13 $ AM O U N T PU RCH AS ED PARTICIPANT #
R1 Supplies R2 Supplies R3 Supplies Total Supplies
0.00 20.00 40.00 60.00 80.00 100.00 120.00 140.00 160.00 0.00 20.00 40.00 60.00 80.00 100.00 120.00 140.00 160.00 19 9 10 14 15 3 22 26 18 12 7 11 4 1 5 24 8 25 27 13 CE N TI M ET ER S PARTICIPANT #
Participant 19 seems to have performed above average in tower height and supplies purchased but does not necessarily perform best in any one particular area of the challenge aside from the final ending cash on-hand. Therefore, in order to obtain a better understanding of how participant 19 won the challenge, we turn to the observational notes. Here is an excerpt from the observational notes of a MITEF volunteer for participant 19:
Participant 19 (the winner), said the key to winning was trusting in themselves and avoiding distractions. Participant 19 never bothered peeking at what the other participants were doing. Participant 19 seemed really confident they were going to win at the beginning of the third round. While some participants started building really tall towers, participant 19 asked one of the facilitators "Just to confirm, to win you need to have the most amount of money, right?
By confirming the objective throughout the challenge, and with statements such as “trust in myself” and “avoid distractions”, participant 19 seems to exhibit an internal locus of control and a strong focus on end objectives. Given these characteristics, we argue that participant 19 is goal-oriented rather than task-oriented. The behavioral pattern scores for participant 19 are as follows: Goals = 2.40, Risk = 0.93, Delegation = 3.00, Adoption = 2.60. The goals score is well above average and is 20% greater than the group median, which seems to confirm our hypothesis.
The Tower Challenge also allowed us to observe how the participants make decisions when grappling with the concepts of risk. Risk played a large role in many decisions for the participants in the challenge, and as we will explore later, is also a major factor for their business. One particular encounter with participant 12 provided some insights on the multi-dimensionalities of risk. Participant 12 has recently founded a startup in 2018 that works with small retailers in the Guadalajara region. Participant 12 chose to sit on the front row in the workshop and seemed intensely engaged throughout the first segment of the workshop.
When the Tower Challenge began, participant 12 immediately started to draw structural design sketches and calculate what additional supplies would likely be needed. By the end of round one, participant 12 had the tallest tower, and the second tallest tower by the end of round two. When we analyze the purchased supplies data for participant 12, we find that they decided to make an early, and large, investment in supplies. They chose to wait for the $5 in round two but took a loan in round one to supplement the strategy of purchasing supplies early. Participant 12 made another large investment in supplies in round two, seeing an opportunity with the newly introduced Styrofoam cups in his structural designs.
By the end of round two, participant 12 was in fifth place and had the second tallest tower. At the beginning of round three, participant 12 approached us and asked, “Can I leave my tower as it is, and not build anymore?” We confirmed that all participants have the freedom to choose to leave the tower as it was from the previous round or that one could also continue to build if they preferred to try and make it taller. As we continued to observe participant 12, it was evident that they were struggling with this scenario. Should they play it safe and hope the tower was tall enough to win, or take a risk and try and make it taller to improve the chances of winning?
If we analyze this scenario at a deeper level, we find that a participant’s levels of risk-tolerance, self-efficacy, and locus of control all influence the final decision. For example, a risk-tolerant participant with high self-efficacy and an internal locus of control would view this decision as a risk worth taking; believing in their ability to make the tower taller. This participant may say something like, “I have been successful in building the tower this tall so far, so I am sure I can make it even taller. If I become content, others might build taller towers and pass me in the standings.”
On the other hand, a risk-averse participant with low self-efficacy and an external locus of control would likely be content with the existing situation, leaving the outcome of the challenge to be decided by
the other participant’s abilities to do better. This participant might say something like, “I know I have done a good job, and it is not worth the risk to try and build a taller tower. I hope it is good enough to win, but if I’m not meant to win, then I’m not meant to win.”
After contemplating this decision for a few minutes, participant 12 eventually decided to take a risk and try to make a taller tower. Participant 12 purchased a small amount of additional supplies and disassembled half of the tower to reinforce the base structure needed for a taller tower. From the data shown in Figure 3, we can see that this decision did not work out for participant 12 in the end. The newly constructed tower toppled to the ground and left the participant with only a small part of the tower standing. Participant 12 ended in tenth place, exactly average, but five spots lower than where they had been at the beginning of round three.
We decided to go back and analyze what would have happened if participant 12 had left their tower as it was. Assuming that the participant would not have purchased an additional $1.00 in supplies at the beginning of round three, participant 12 would had finished in fourth place with a final cash on-hand of $22.70. By this estimate, participant 12 made the right decision if their objective was to win.
Although, it is important to note here that the participants do not have visibility to the other participant’s cash on-hand balances at any point in the challenge. They only have visibility to their own balances throughout the challenge. Therefore, participant 12 would have had to make an estimated guess of the competition’s ability to win and measure that ability to win against their current position. We should also note that there was a lot of excitement in the room as round three began. Many participants were pushing the boundaries of tower height and we believe that participant 12’s decision was likely influenced by this environment.
If we were to hypothesize about participant 12’s behavioral pattern scores based solely on the decision made in round three, we would likely hypothesize that participant 12 is highly risk-tolerant and
goal-oriented. However, this would disregard all of the actions that participant 12 made earlier in the challenge. Recall that participant 12 was very disciplined in planning and decision-making in the first two rounds of the challenge, and actually mitigated risk by conducting such in-depth planning. Participant 12’s behavioral pattern scores from the survey are as follows: Goals = 1.80, Risk = 0.91, Delegation = 2.20, and Adoption = 1.80.
Participant 12’s scores are very similar to participant 19, whom we discussed earlier. However, participant 12 has slightly lower scores for goals and adoption, yet still above average. From the scores we would conclude that participant 12 is highly risk-averse, given the low risk score of 0.91. However, this scenario has shown us that being risk-averse does not necessarily translate to avoiding risk. Rather than avoiding risk altogether, participant 12 choose to, instead, mitigate risks through disciplined planning and scenario analysis. Here is an excerpt of some observational notes from a Monterrey Tech undergraduate student volunteer:
Participant 12 was the only one I saw who drew some sketches before the game began. Participant 12 was also the only one I saw at the table who was organized with their cash flows. On the other hand, participants 1 and 18 were not very organized in these aspects since they asked me to tell them the numbers for investments, earnings, etc.
From these observations, we hypothesize that keeping detailed financial records and being highly disciplined in planning and scenario analysis can mitigate inherent risks, and allow typically risk-averse persons to make, what may seem to others, high-risk decisions. Additionally, a person’s surrounding competitive environment may influence one’s willingness to take risks. Unfortunately, financial planning and competitive environments are beyond the scope of this study. Instead, from this scenario, we aim to provide a basic framework for the concept of risk, and to also highlight some of the limitations to our measure of risk.
Finally, it is important to note here that we do not claim that the Tower Challenge performance is exactly correlated to actual business performance. In fact, we have found that it is not. Trying to simulate a complete business environment would require many more constraints and variables, that we do not attempt to emulate for the sake of simplicity for the participants. Further, some people simply are not great engineers, architects, or builders, but may be great at sales, trade, or any other number of occupations. Recall that the main purpose of the Tower Challenge is to help us test the potential biases that may exist in the participant’s responses of the structured-disguised survey and is solely a supplemental observation method in addition to the company visits that we will discuss next.
4.3 Findings from Qualitative Observations – Company Visits
We visited three companies in the Guadalajara region, all of whom had attended the workshop the previous day. All three companies operate in the retail trade industry and the types of services and products included stationery, hand-made jewelry, and cosmetics. We will explore the observations from two of the three visits in this section.
Our first visit was to the stationary products store focused on school supplies, arts and crafts, and computer services. For the purposes of this study, we will call this company School, Inc. to keep the business and owner anonymous. School, Inc. is located in a suburban town about an hour outside of Guadalajara. The business operates from of a first-floor apartment, approximately 600 square feet in size, and was established four years earlier, at the time of this study. The store had a few metal racks used to display notebooks, pencils, paints, other arts and craft supplies, and toys. The store also had a small register counter, and the bedroom had been converted to a “cybercafé” where customers could pay to use a desktop computer with internet, as well as have access to printing services.
The metrics for the business owner’s behavioral patterns and for the organization are listed in Table 9. The business owner scores well above average on all four behavioral patterns, and the business has grown revenues at twice the rate of the sample population. However, average productivity is below the sample population median of $13,570.
Table 9. School, Inc. - behavioral pattern scores and organization metrics
Goals Risk Delegation Adoption Rev Growth Employee Growth Productivity
2.20 2.01 2.20 2.20 55.4% 100.0% $8,002
The owner of School, Inc. contributes their rapid business growth to exceptional customer service. We were able to confirm this claim as we observed the interactions with customers during our visit. As we proceeded with the open-ended Q&A session, the owner expressed extreme interest in growth and expansion by opening another store location within the next six months. The ultimate goal for the business is to open a distribution center in the suburban region that could supply the stores as well as competitor’s stores. These goals and aspiration seem to confirm the high goals score of 2.20.
Additionally, we observed that the owner has a strong desire to continually learn about, and integrate, new technology. School, Inc., was one of the first locations in the town to offer internet on a desktop and a color printer. This seems to confirm the high adoption score of 2.20. Finally, the owner of School, Inc. has understood when additional employees and capital have been needed to support the business growth and operations. The owner has taken the necessary risks to hire employees and/or take out bank loans at those times. These actions would seem to confirm the high risk and delegation scores of 2.01 and 2.20 respectively.
Our second visit was to a business which offered hand-made jewelry, both through wholesale and retail channels. For the purposes of this study, we call this business Jewelry, Inc. for the same purposes of anonymity. The jewelry making process employed at Jewelry, Inc. is one that has been passed down over
hundreds of years through the generations of the family. The business operates out of the owner’s home and has operated as a business for many years. The metrics for the business owner’s behavioral patterns and for the organization are listed in Table 10.
Table 10. Jewelry, Inc. - behavioral pattern scores and organization metrics
Goals Risks Delegation Adoption Rev Growth Employee Growth Productivity
1.60 0.83 1.60 1.80 -2.9% 0.0% $1,408
Jewelry, Inc. offers hand-made art in the form of small trinkets and sandals embroidered with the special art pieces. The art pieces are all made through the same process from natural clay found in the region. Jewelry, Inc. sells the products to art galleries, museums, and collectors who are interested in the traditional artform. However, most revenues are generated from B2C sales at local expositions. All employees of the company are family members who have been trained in the traditional art making process.
As outlined in Table 10, the company has experienced flat revenues for the last three years, with a minor loss showing in 2018 as a result of currency exchange fluctuations. The owner’s behavioral pattern scores are far below the sample population median scores, with the third lowest risk score of the entire sample population. These scores were all confirmed through the observations during our visit.
The owner of Jewelry, Inc. expressed sincere interest in growth and expansion. This interest seemed to be spurred by recent positive experiences in social media marketing ventures. When we asked the owner how they would like to grow the company, the options were many. The options for growth ranged from opening a local store, to expanding through social media, to expansion of wholesale channels, and more. We asked why they had not yet pursued any of these options more aggressively, to which the owner stated that they are afraid to hire employees because of the risk of not being able to pay them. Although, the owner admitted that this fear was simply of fear from not knowing because they do not