Aspects of Applied Biology 132, 2016 International Advances in Pesticide Application
Studying the impact characteristics of spray droplets on plant
surfaces using a multiphase CFD model
By M A DELELE1, D NUYTTENS2, A AMBAW1, F LEBEAU3, B M NICOLAI1
and P VERBOVEN1
1BIOSYST-MeBioS, KU Leuven, Willem de Croylaan 42, 3001 Heverlee, Belgium 2The Institute for Agricultural and Fisheries Research (ILVO), Technology and Food Science
Unit, Agricultural Engineering, Burgemeester Van Gansberghelaan 115, bus 1, 9820 Merelbeke, Belgium
3University of Liege, Gembloux Agro-BioTech, UMC, Passages des Déportés 2, 5030 Gembloux,
Belgium
Corresponding Author Email: [email protected]
Summary
The impact characteristics of spray droplets on plant surfaces was investigated based on a multiphase computational fluid dynamics (CFD) model using the Volume Of Fluid (VOF) approach. The contact angle of the droplet on different surfaces was measured and included as a model parameter. The model was validated using experimental results that were conducted on different plant surfaces (apple, pear, cabbage and leek) and the model was applied to study the effect of droplet impact velocity, droplet diameter, formulation and surface topology on droplet impact characteristics. For each combination of model parameters, the model was capable of predicting the droplet impact outcome (adherence, rebound, splash and shattering). The results showed that multiphase CFD model has a capacity to predict the behavior of plant protection mixture droplets at impact on target surfaces.
Key words: Plant surface, spray, CFD, volume of fluid, droplet impact, Weber number Introduction
Inefficient spraying of plant protection chemicals can result in a lower biological efficacy, and higher risks for the environment and human health. The impact dynamics of a droplet on a plant surface and its final fate is a complex process that includes retention, rebound or splash/shatter (Dong et al., 2014). The final fate of the droplets after impact is determined by the interaction of many controllable and uncontrollable parameters. To maximise the efficiency of pest control systems, the interaction between application system, the formulation of the plant protection product, the surface morphology of the plant surface and the micro climate conditions must be understood (Yu et al., 2009; Zwertvaegher et al., 2014).
Validated mathematical models can be applied to study the impact behavior of liquid on plant surfaces and the models are good alternatives to the tedious and expensive experimental studies. Empirical as well as physical mathematical models have been used by different researchers to study the interaction between spray droplets and plant surfaces (Dorr et al., 2014, 2008; Endalew et al., 2010; Duga et al., 2015; Mercer et al., 2007; Forster et al., 2005). Some of the physical models assumed a complete adherence of the droplets that are intercepted by the plant surface (Dorr et al.,
2008). Other models used a stochastic collection model (Ayenew & Ashenafi). Recently Dorr et al. (2014) presented a physical model that is capable of predicting whether the droplet is adhered, bounced or shattered. The model was not capable of predicting the dynamic process of the impact process, but only predicts the final output of the impacting process, and assumes that the surface is horizontal and droplets impact only perpendicular to the surface. A mathematical model that is capable of predicting the dynamic behavior of the impact process of liquid droplet on plant surface by taking into account liquid formulation, properties of the impacting droplets, morphology and orientation of the plant surface and microclimate conditions is still lacking.
The aim of this study was to develop a validated CFD model using a Volume of Fluid (VOF) approach that is capable of predicting the dynamic impact behavior of liquid droplets on plant surfaces. The model is applied to study the effect of different sprayer operating parameters and plant surface properties.
Materials and Methods
Experimental studies
Experimental studies of droplet-plant surface interaction were conducted using leaves of apple, pear, cabbage and leek. The leaves of apple and pear were picked after harvest during the month of November from the orchards of KU Leuven in Rillaar, Belgium. The study used only the green matured leaves and to avoid moisture loss the samples were stored in high humidity condition. The cabbage and leek plants were collected from the Provincial Research and Advisory Centre for Agriculture and Horticulture in Rumbeke, Belgium. The plants were young and in good condition. Most of the studies were conducted using distilled water droplets. The results were used for model validation and the measured static contact angle of the droplet was used as model input parameter. Static contact angle of the droplet on the plant surface was measured at the Department of Chemical Engineering of the K.U. Leuven in Belgium using KRÜSS Droplet Shape Analysis System DSA14 (KRÜSS GmbH, Hamburg, Germany). Measured static contact angles of the droplet were 138.2°, 54.9°, 68.1° and 113.7° for cabbage, apple, pear and leek leaves, respectively.
The impact behaviour of the droplet on the plant surface was determined from images/videos that were captured using a high speed camera (Y4 CMOS, Integrated Design Tools, Florida, USA). In this experiment, a leaf sample was placed in between the high speed camera and the light source (19LED, Integrated Design Tools, Florida, USA) (Zwertvaegher et al., 2014). The target surface was positioned under the moving nozzle where it was possible to capture enough representative droplets. There was a 50 cm distance between the light source and target surface. The nozzle was moving at a speed of 2 m s-1, perpendicular to direction of the camera and the light source. The
type and pressure of the nozzles were adjusted to produce a wide spectrum of droplet size and impacting velocity. The camera was set to take 20000 frames per second. The spatial resolution of the camera was 10.8 μm pixel-1. The sample target plant surfaces had size of 0.5–5 cm.
The velocity and diameter of the impacting droplets were determined using image processing with the software Motion Studio (Integrated Design Tools, Florida, USA). The diameter of the droplets was calculated from the product of the pixel number in the images that was taken by manual drawing of a line from one side of the droplet to the other and the spatial resolution of the camera (μm/pixel). The velocity of the droplets was calculated from the product of the difference in the pixel values of the bottom of the droplets in the images for the nth and nth + 10 frames, the
spatial resolution of the camera and the shutter speed of the camera (frames s-1).
The critical Weber number (We = ρDV 2/σ)was used to describe the transition from adherence
to rebound/shatter and rebound to shatter depending on the type of surface. Where ρ is the density of the liquid, D is the droplet diameter, V is the impact velocity of the droplet and σ is the surface tension of the liquid.
Numerical simulation
The model was developed using a VOF method. The method predicts the behaviour of the air and the liquid phases by solving a single set of momentum equations and tracking the volume fraction of each of the phases throughout the computational domain. The continuity and momentum equations of laminar flow for each phase are:
where t, v, p and g are time, velocity vector, pressure and gravitational acceleration, respectively. r,
m, and F are the apparent density, viscosity and surface tension force per unit volume, respectively.
Based on the value of the volume fraction (a1) the liquid phase, the fluid properties and the flow variables in any computational cell represent either one of the phases or a mixture of the phases. The apparent density and viscosity in each cell were calculated using:
where ρ1 and ρa are density of liquid and air respectively; and μ1 and μa are viscosity of liquid and air, respectively. The motion of the interface between the liquid and the air phase was tracked by solving the continuity equation for the volume fraction of the liquid phase:
The volume fraction equation for the air phase was not solved and was computed based on the following constraint:
The surface tension force per unit volume (F) was calculated using a continuum surface force model (Brackbill et al., 1992). The model interprets surface tension as continuous, 3-D effect across an interface, rather than as a boundary value condition on the interface. For a two phase system:
The simulations in this study were conducted using Ansys Fluent 16 (ANSYS, Inc., Pennsylvania, USA). Three dimensional rectangular computational domains were developed and discretised using the appropriate mesh size (Fig. 1). The size of the domain depends on the size of the droplet and its impact velocity. In order to capture all details of the impacting process, droplets with higher diameter and impact speed needs bigger domain size. The study analysed droplets sizes in the range
.
0 t v (1)
.
p 2 t v vv v g F (2)(1
)
l l l aρ α ρ
=
+ −
α ρ
(3)
(1
)
l l l aµ α µ
=
+ −
α µ
(4)
( )
l .( )
lv 0 t α α ∂ + ∇ = ∂ (5) 1 a l α = −α (6)
1 2 l l a k F (7)The curvature (k) is given by:
.k n (8)
The unit normal n is given by:
l l n (9)
of 50–800 µm and impact velocities of 0.1–10 m s-1. Minimum contact surface sizes of 1mm by
1mm and a maximum size of 16 mm by 16 mm were used. Depending on the size of the droplets mesh sizes in the range of 2.5–30 µm (2.5 µm for 50 µm droplet and 30 µm for 800 µm) were used. The domains consisted of up to 4.13 million hexahedral elements.
The plant surface was taken as a no slip wall and the rest of the boundaries were defined as pressure outlets. To predict the contact behaviour of the droplet on the plant surface, the wall adhesion model of (Brackbill et al., 1992) was applied. In this model the contact angle of the droplet on the wall is used to determine the surface normal in cells near the wall. The dynamic boundary condition results in the adjustment of the curvature of the droplet surface near the wall. Initially the droplets were placed above the contact surface and the corresponding impacting velocities were applied.
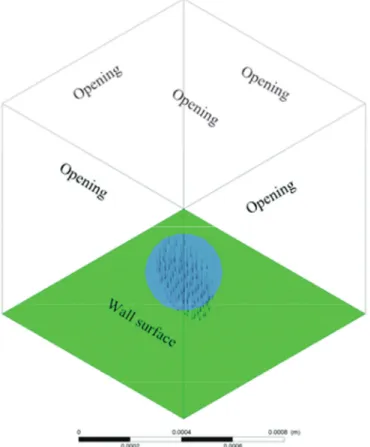
Fig. 1. Typical discretised computational domain showing the initial position of 300 µm droplet with its
impact velocity vector (2 m s-1) and the boundary conditions.
A fractional step algorithm was used for pressure-velocity coupling. The continuity, momentum and volume fraction equations were solved using PRESTO, QUICK and compressive method, respectively for spatial discretization. Time discretization was done using a first order implicit method. A time step size of 1 × 10⁻⁷ s was capable of capturing the important features of the impact
dynamics of the droplet on the plant surface. The calculation was done using 64-bit, Intel® Core™ i7-4790 CPU, 3.60 GHz, 32 Gb RAM, Windows 7 Professional computer and the CPU time of calculation was up to 76 h.
Results
Predicted dynamic behaviour of droplets after perpendicular impact on horizontally oriented pear and cabbage leaves is shown in Fig. 2 and Fig. 3, respectively. The results are for constant droplet diameter (300 µm) and impact velocity (2 m s-1). Typical predicted results with an increase
in droplet diameter and impact velocity are shown in Fig. 4 and Fig. 5. Predicted and measured impact outcome are presented in Fig. 6.
Fig. 2. Adherence: predicted dynamic behavior of a 300 µm diameter water droplet after impact on horizontal
pear leaf at a vertical velocity of 2 m s-1, the time after impact is shown in milliseconds (ms).
Fig. 3. Rebound: predicted dynamic behaviour of 300 µm diameter water droplet after impact on horizontal
cabbage leaf at a vertical velocity of 2 m s-1, the time after impact is shown in milliseconds (ms).
Discussion
As the liquid droplet makes contact with the plant surface, it starts to spread up to the maximum possible spread diameter, then for a relatively moderate impact velocity it starts to recoil back to
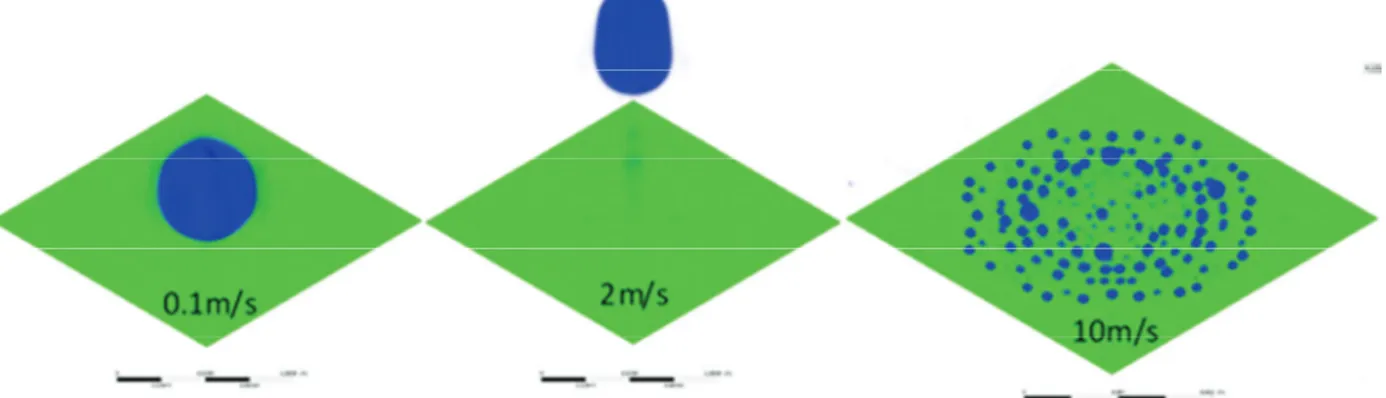
Fig. 4. Predicted behaviour of a 300 µm diameter water droplet after impact on horizontal cabbage leaf with different impact velocities (0.1 m s-1, adherence, 2 m s-1: rebound, 10 m s-1: splash).
Fig. 5. Predicted behaviour of water droplet after impact at a velocity of 0.5 m s-1on a horizontal cabbage
leaf for different droplet diameter (50 µm: adherence, 300 µm: rebound).
a certain diameter (Fig. 2 and Fig. 3). During the spreading period, due to the viscous effect the droplet dissipates its kinetic energy, and the surface tension acts against the spreading and initiates the recoiling process (Mercer et al, 2007; Zwertvaegher et al., 2014). The process is axially symmetric. Depending on the type of plant surface, hydrophilic (Fig. 2) or hydrophobic (Fig. 3), the droplet adhered to the surface or rebounded, respectively.
For a relatively higher impact velocity the impacted droplets splashed and shattered to small fragments (Fig. 4). The shattered small droplets covered relatively larger area of the plant surface. This shows that spray application at relatively higher impact velocity could improve the coverage area and uniformity of crop protection chemicals. For a given impact velocity on a hydrophobic surface, decreasing the size of the droplet increased the tendency of the droplets for adherence (Fig. 5).
The model slightly over predicted the critical Weber number for the transition from adherence to rebound/shatter, but slightly under predicted the critical Weber number for the transition from rebound to splash/shatter (Fig. 6). The predicted critical Weber number for the transition from adherence to rebound and form rebound to splash/shatter for cabbage leaf were 0.3 and 100.7, respectively; whereas the measured values were 0.1 and 116.0, respectively. In the case of pear leaf, the predicted and measured critical Weber number for the transition between adherence to splash/ shatter was 136.8 and 166.7. There was a similar agreement between the predicted and measured impact output on other plant surfaces (apple and leek).
Fig. 6. Measured (left) and predicted (right) outcome of water droplet dynamics with different diameter and impact velocity that was impacted on horizontal cabbage (top) and pear (bottom) leaf surfaces.
The applicability of the model to study the effect of liquid formulation, surface orientation and droplet impact direction was also checked (the results were not presented). Impact characteristics of droplets on a plant surfaces was affected by surface properties and orientation, liquid formulation,
Acknowledgements
The research work of Mulugeta Admasu Delele is supported by the Back to Belgium Grants of the federal Science Policy. The federal Science Policy is gratefully acknowledged.
References
Brackbill J U, Kothe D B, Zamach C. 1992. A continuum Method for Modeling Surface Tension.
Journal of Computational Physics 100:335–354.
Dong X, Zhu H, Yang X. 2014. Characterization of droplet impact and deposit formation on leaf
surfaces. Pest Management Science 71:302–308.
Dorr G J, Kempthorne D M, Mayo L C, Forster W A, Zabkiewicz J A, McCue S W, Belward J, Turner I W, Hanan J. 2014. Towards a model of spray-canopy interactions: Interception,
shatter, bounce and retention of droplets on horizontal leaves. Ecological Modelling 290:94–101.
Duga A, Ruysen K, Dekeyser D, Nuyttens D, Bylemans D, Nicolai B, Verboven P. 2015. Spray
deposition profiles in pome fruit trees: Effects of sprayer design, training system and tree canopy characteristics. Crop Protection 67:200–213.
Forster W A, Kimberley M O, Zabkiewicz J A. 2005. A universal spray droplet adhesion model.
Melese Endalew A, Debaer C, Rutten N, Vercammen J, Delele M, Ramon H, Nicolai B, Verboven P. 2010. Modelling pesticide flow and deposition from air-assisted orchard spraying in
orchards: A new integrated CFD approach. Agricultural and Forest Meteorology 150(10):1383– 1392.
Mercer G, Sweatman W L, Elvin A, Caunce J, Fulford G, Harper S, Pennifold R. 2007. Process
driven models for spray retention by plants. Proceedings of the 2006 Mathematics-In-Industry Study Group, pp. 57–85. Ed. G Wake.
Yu Y, Zhu H, Ozkan H E, Derksen R C, Krause C R. 2009. Evaporation and deposition coverage
area of droplets containing insecticides and spray additives on hydrophilic, hydrophobic, and crabapple leaf surfaces. Transactions of the ASABE 52(1):39–49.
Zwertvaegher I K, Verhaeghe M, Brusselman E, Verboven P, Lebeau F, Massinon M, Nicolai B M, Nuyttens D. 2014. The impact and retention of spray droplets on a horizontal hydrophobic