ENERGIZATION CHARGING
IN TRANSFORMER INSULATION
by
David John Lyon
SUBMITTED TO THE DEPARTMENT OF ELECTRICAL ENGINEERING AND COMPUTER SCIENCE IN PARTIAL
FULFILLMENT OF THE REQUIREMENTS FOR THE
DEGREE OF MASTER OF SCIENCE
at the
MASSACHUSETTS INSTITUTE OF TECHNOLOGY
July 1987
Copyright (c) 1987 Massachusetts Institute of Technology
Signature redacted
Signature of AuthorCertified by
Accepted by _Li
Department of Electrical Engineering and Computer Science July 16, 1987
Signature redacted
6
Si
Professors James R. Melcher *-MAark~ s Zahn Thesi& ervisor
gnature redacted
Of ThGI4?OLO
op,
\2
2
988
Arthur C. Smith Chairman, Graduate Thesis Committee
ENERGIZATION CHARGING
IN TRANSFORMER INSULATION
by
David John Lyon
Submitted to the Department of Electrical Engineering and Computer Science on July 16, 1987 in partial fulfillment of the requirements for the degree of
Master of Science.
Abstract
A number of failures of large oil cooled transformers has been attributed to flow-induced electrification currents. These currents are comprised of convected charges that are separated at liquid/solid interfaces by physical, chemical, and electrical means. A Couette "mixer" is developed which provides measurement of properties needed to predict charge generated by a transformer oil/cellulosic interface under both equilibrium (i.e. no current flows across the interface) and non-equilibrium conditions.
The measured equilibrium charge is used to predict the equilibrium wall-charge using an adaptation of the fully developed equilibrium duct-flow theory of Abedian and Sonin. The dependence of this charge on Reynold's number R is that predicted over the measured range 280 < R < 5040. The application of an external field simulates the effects of transformer
energization and produces non-equilibrium currents, which give rise to charges that are compared to those predicted by a model developed in this work. This migration-based model predicts the effect of external field strength and frequency, as well as flow conditions, on the injection of charge from the boundary into the turbulent flow core. Experimental data displays energization currents which have dependences on frequency, Reynold's number and voltage sufficiently like those predicted to encourage refinement of the injection model to include the effects of what turbulent diffusion there is inside the "laminar sub-layer".
Thesis Supervisor: Professors James R. Melcher & Markus Zahn
Acknowledgements
I would like to thank Professor James Melcher and Professor Markus Zahn for all the time and understanding they gave me during my work on this thesis. Most students would consider themselves fortunate to have a supervisor who is concerned about their needs and is both easy and inspiring to work with; I am at least doubly blessed, not only in having attention from two supervisors, but in having two of the absolute best. My rewards from working with these two men go much deeper and will last much longer than is indicated by anything between these two covers.
I am also extremely grateful for the pleasant and supportive work environment I have enjoyed for the past few years. In particular Paul Warren has been, as he
is for all students in the lab, an invaluable resource, and has saved my experiment from disaster on more than one occasion. I am also indebted to my office-mates, both past and present, for their continuous support and friendly dispositions; of special note are Stephen Bart, Rayomond Kotwal, and Diane Gaylor. People like these make it all worthwhile, or at least bearable. MIT High Voltage Laboratory machinist Rocky Albano is especially acknowledged for his cheerful expertise in all construction aspects of the Couette Electrification Apparatus.
Westinghouse personnel, especially Dr. T.V. Oommen and EPRI advisor D. Crofts of Texas Utilities Electric Co. were very generous in sharing their knowl-edge and experience. We also acknowlknowl-edge the cooperation of M. Franchek of EHV Weidmann for supplying transformer pressboard and Imperial Vetak Glue. Man-ning Paper Co. furnished the kraft paper.
This project was supported by the Electric Power Research Institute under re-search project 1499-8.
Table of Contents
Abstract 1
Acknowledgements 2
1. Introduction 3
1.1 Transformer Electrification 3
1.2 Identification of Practical Mechanisms 4
1.2.1 Four Stages of Electrification 4
1.2.2 List of Influences and Effects 5
1.2.3 Matrix of Stages and Effects 6
1.3 Isolation of Charge Generation Stage 6
1.3.1 Equilibrium and Non-equilibrium Charge Generation 8
1.3.2 Charge Generated by Energization 8
1.3.3 The Duct Flow Approach 8
1.4 The Couette Flow Approach 9
1.4.1 Description of Configuration 9
1.4.2 Equilibrium Charge Density 10
1.4.3 Non-equilibrium Charging in the Couette Mixer 11
2. Couette Electrification Apparatus 12
2.1 The Experimental System 13
2.1.1 The Sampling Approach 13
2.1.2 Charge Settling Chamber and Trap 14
2.1.3 Mounting of Paper 15
2.1.4 Critical Times and Lengths 15
2.2 Absolute Measurement of Charge 20
2.2.1 Other Currents in the Electrification System 20
3. Equilibrium Charging Theory and Experiments 24
3.1 Couette Fluid Mechanics 24
3.1.1 Laminar Flow 24
3.1.2 Cellular Convection 25
3.1.3 Turbulence 26
3.1.4 Sampling Model 27
3.2 Adaptation of Theory of Abedian and Sonin 29
3.3 Experimental Technique 30
3.3.1 Documentation of Parameters 30
3.3.2 Procedure 31
3.4 Experimental Observations 32
3.4.1 Streaming Current Dependence on Rotational Speed 33
3.4.2 Effect of Moisture 33
4. Injection Charging Due to AC Energization 36
4.1 Previously Proposed Model 36
4.2 Turbulent Convection Model 37
4.2.1 Steady State Charge Density Across the Gap 37
4.2.1.1 Effect of Turbulence 38
4.2.2 Current Entering Fully Mixed Sampling Region 44
4.2.3 Dependence of Current on System Variables 47
4.3 Experimental Observations 48
4.3.1 Experimental Technique 48
4.3.2 Data Plots 51
5. Data Correlations, Conclusions, and Recommendations 59
5.1 Flow-induced Currents 59
5.2 Currents Due to AC Energization 60
5.2.1 Frequency Dependence 60
5.2.2 Dependence on Rotational Speed 62
5.2.3 Dependence on Sampling Flow Rate 67
5.2.4 Discussion 67
5.3 Recommendations for Future Work 71
List of Figures
Figure 1-1: The basic processes of flow electrification in a) Van de Graaff 9 generator, where each is spatially distinct, and b) power transformer,
where processes overlap.
Figure 1-2: The Couette flow apparatus. 14
Figure 2-1: The Couette Flow Apparatus 17
Figure 2-2: Couette electrification system showing dry nitrogen pressure drive, 18 fluid reservoir and receiver, charge trap, Couette mixer where inner
cylinder rotates, and measurement of current exiting receiver.
Figure 2-3: Method of wrapping paper onto a) the inner cylinder and b) the 21 outer cylinder. The quartered wrapping cylinder c) is also illustrated.
Figure 2-4: The Couette electrification system, showing surfaces for 27 performing conservation of charge.
Figure 3-1: The three flow regimes of Couette flow: a) laminar flow; b) the 30 so-called Taylor cells; and c) fully turbulent flow.
Figure 3-2: Outlet region of Couette mixer, showing fully mixed region at the 33 top and axial velocity profile.
Figure 3-3: The Couette electrification system. 36
Figure 3-4: Data and theoretical predictions for the streaming current 39 dependence on rotational rate; for dry paper. The solid, theoretical, line
was matched to run #2 (6/7)with a value pw=2.3xl0-3 C/m3.
Figure 3-5: Data and theoretical curve for streaming current dependence on 40 rotation rate; for wetted paper. Theoretical curve was matched to run #8
(7/11) with a value pw=2.2x10⁻³ C/m3.
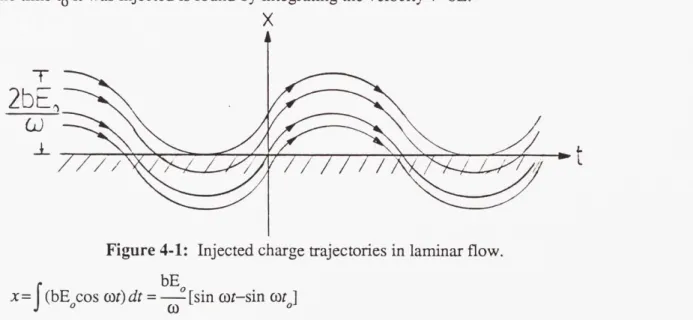
Figure 4-1: Injected charge trajectories in laminar flow. 42
Figure 4-2: Charge trajectories in turbulent flow. 43
Figure 4-3: Conservation of charge in the Couette mixer. 46 Figure 4-4: Charge density in the laminar sub-layer. 48 Figure 4-5: Charge density in the laminar sub-layer when it is thinner than the 49
injection length.
Figure 4-6: Dependence of the AC field induced convection current on 54 frequency of the applied voltage.
Figure 4-7: Dependence of the energization-induced current on the rotational 55 speed of the inner cylinder.
Figure 4-8: Dependence of the energization-induced current on the sampling 56 flow rate through the Couette mixer.
Figure 4-9: The frequency response of the experimental data for dry paper, 57 taken at the peak voltages indicated. All the curves were taken at the same
rotational speed, 1400 RPM.
Figure 4-10: Frequency response of the experimental data for dry paper, taken 58 at the indicated rotational speeds. All curves taken at 6 kV peak.
Figure 4-11: Replot of Figure 4-10: current versus rotational speed at different 59 AC frequencies.
Figure 4-12: Frequency dependence of the injected current with wet paper, 60 taken at different field strengths. All curves taken at 1400 RPM.
Figure 4-13: Frequency dependence at different rotational speeds; wet paper. 61 Applied voltage is VO=6 kV.
Figure 4-14: Current against rotational speed, at different AC frequencies. 62 Data in Figure 4-13, V0= 6 kV.
Figure 4-15: Dependence of the current on the sampling flow rate,
Qv.
Each 63 curve taken with V0=4 kV andf=1 Hz.Figure 5-1: Theoretical predictions (solid lines) and measured currents due to 66 rotation for a) dry paper and b) wet paper. Matched wall charge densities
are pw=2.3x1o-3 and 2.2x10⁻³ C/m3, respectively.
Figure 5-2: Experimental results (a) and theoretical predictions (b) of the 68 frequency dependence of the current at different field strengths for dry
paper. Theoretical curves plotted with pinj=6.5xlO4 C/m3. All curves taken at 1400 RPM.
Figure 5-3: Experimental results (a) and theoretical predictions (b) of the 69 frequency dependence of the current at different field strengths for wet
paper. Theoretical curves plotted with p.nj=8x10⁴ C/m3. 1400 RPM.
Figure 5-4: Experimental results (a) and theoretical predictions (b) of the 70 frequency dependence at different rotational speeds, for dry paper.
Matched pinj=6.5x1O4 C/m3; 6 kV peak.
Figure 5-5: Experimental results (a) and theoretical predictions (b) of the 71 frequency dependence at different rotational speeds, for wet paper.
Matched pinj=9x10⁴ C/m3; 6 kV peak.
Figure 5-6: Experimental results (a) and theoretical predictions (b) of the 73 current dependence on rotational s eed, at different frequencies, for dry
paper. Matched pinj=6.5x10⁴ C/m; 6 kV peak.
Figure 5-7: Experimental results (a) and theoretical predictions (b) of the 74 current dependence on rotational speed, at different frequencies, for wet
paper. Matched pnj=9x10⁴ C/m3; 6 kV peak.
Figure 5-8: Experimental results (a) and theoretical predictions (b) of the 75 current dependence on sampling flow rate, at different rotational speeds,
for wet paper. Matched pinj =4x10⁴ C/m3. 4 kV peak, 1Hz.
Figure A-1: Oil degassing facility. 79
List of Tables
Table 1-I: The Stage-Effects Matrix, indicating which processes are affected 12 by each property
Table 2-I: Various time constants in the Couette system. 26 Table 2-II: Constants of the oil and the geometry of the Couette system at 27
Chapter 1 Introduction
1.1 Transformer Electrification
The flow of semi-insulating liquid coolant through power distribution equipment gives rise to electric fields through the convection of charges that have been separated at liquid/solid interfaces by chemical means. These fields, either alone or in consort with the fields imposed by energization of the equipment, can exceed those anticipated in design and contribute to insulation failure. Examples include freon cooled static power conditioning equipment1,2, where the flow-induced fields can puncture the walls of insulating tubes, and oil cooled transformers3-16, in which the field build-up leads to catastrophic discharges. Both to ensure reliable operation of existing equipment and to guide in the development of the next generation of power apparatus, it is desirable that flow electrification be reduced to an engineering science.
Flow electrification has been attributed to the failure of a number of large power transformers in the U.S. Electrification has been implicated in these failures for two primary reasons: first, the failures occured only when the coolant had been continuously circulating through the unit for a length of time; and second, "autopsies" of the failed equipment revealed tracking on the solid insulation bearing evidence of partial electrical discharges. That the greatest proportion of these tracks were found at the bottom of the windings, where the oil first enters the ducts from the external cooling system, points both to the oil pumps and to the flow conditions peculiar to the inlet region as potential suspects for extreme charge
generation.
The first reports associating electrification with problems in large forced-oil-cooled transformers came from the Japanese in 19795,8,10,11. They described the large-scale transformer models that were used in their tests, and gave evidence of electrification phenomena, including phtographs of electrical discharges. In December, 1983 the first U.S. field transformer failure attributed to flow electrification occurred, and has been followed by about eleven more17,18. Typically, these failures involved flashovers from high voltage windings to low-voltage leads across considerable oil gaps, and upon tear-down of the unit, significant tracking and other evidence of electrification could be found on the insulation. Although it is common in the transformer electrification literature to associate electrification problems with a particular transformer design (usually shell-form), a single manufacturer and a single oil refiner, the situation is not that straightforward: the twelve known failures have occurred in both shell-form and core-form transformers, and have involved at least six manufacturers and five oil refiners.18
1.2 Identification of Practical Mechanisms
1.2.1 Four Stages of Electrification
The roles of electrical and mechanical forces in any system experiencing flow electrification can be analyzed in terms of four basic processes: charge generation, transport and field generation, accumulation, and leakage. These processes are perhaps most easily visualized in the Van de Graaff generator, where each is clearly separated from the others. The charge in Figure 1-1a is generated at the bottom, where it is sprayed onto a moving belt which transports the net charge to a metal dome. Charge accumulates on the metal surface and is
allowed to leak off through an external resistor.
E N
/
accumulation (storage) transport & ield generation charcge generation W accumulation and I Oicaq* 4 + + 4. + + 44 generation 9nrat~l tansport accumul~ation . 1*a&"qeFigure 1-1: The basic processes of flow electrification in a) Van de Graaff generator, where each is spatially distinct, and b) power transformer,
where processes overlap.
Figure 1-lb identifies the same processes in a power transformer, where they are clearly not spatially distinct. Charge generation occurs in both the pumps and in the ducts between coil windings, a region where all four processes can overlap. Here charge can accumulate on the surface of the solid insulation, and can also leak away through this insulation material. Finally, the plenum above the windings allows accumulation of volume charge, as long as the relaxation (leakage) currents in that space are exceeded by convection currents entering from below.
1.2.2 List of Influences and Effects
There are a number of attributes of an operating transformer that have been linked to the degree of electrification activity the unit will suffer through operational and service experience. These attributes are presented below in a summary based on a list detailed by D.W. Crofts18:
1. Charging Tendency - The "charging tendency" of a particular oil is determined by a "standard" measurement technique, and indicates the average charge density created by forcing the oil past a paper filter in a proscribed fashion14. While this technique does not use the solid insulation typically found in transformers, it is widely used to explore the effects of various parameters on electrification. The Couette charger developed here provides a more rigorous approach, which takes into account the role played by the "paper" as well.
2. Flow Turbulence - is generally considered to significantly augment electrification activity.
3. Flow Rate - in smooth ducts turbulence generally sets in for Reynold's numbers (proportional to the flow rate) above 2000-3000.
4. Surface Characteristics of Solid Insulation - Roughness of the solid surface enhances charge generation8.
5. Energization - Transformer energization has been shown to increase electrification currents10'19.
6. Dielectric Strength of Oil - The dielectric strength of oil is obviously important in determining the harmful effects of electrification activity, but is also one mode of charge leakage.
7. Conductivity of Solid Insulation -This parameter is important as it controls the amount of leakage available. It is affected by the migration of moisture between the solid and the oil, which occurs as the relative moisture contents regain equilibrium after temperature or pressure changes; and by surface active agents. In addition to influencing the charging tendency of the oil, surfactants can contribute to a layer of surface conductivity on the solid insulation. This layer provides another path for leakage.
8. External Charging - Streaming currents emanating from a transformer duct are increased by currents entering the duct's inlet from upstream charge generators, namely the pumps. The mixing action of the flow through the pumps has been found to generate currents in the same manner as the oil ducts, increasing suspicion that the pumps may play a significant role in transformer electrification.
9. Contaminants, Surface Active Agents and Particulate Matter - Trace quantities of surfactants are known to significantly alter the charging tendency of an oil.
10. Oil Temperature -The temperature of the oil influences electrification activity through its effect on the oil viscosity and conductivity. Changes in the
temperature inside a transformer are also known to change the moisture equilibrium between the paper and oil, thus affecting the conductivity of the paper.
11. Moisture Content of Oil - High moisture levels in the oil tend to decrease the charging tendency; levels below 15 ppm produce the highest charging effects. 12. Configuration - The physical configuration of the transformer has a great
impact on the degree of electrification to be expected. Location of the pumps, sizes of the plenums above and below the coil windings, the materials comprising the paper/oil interface, and the geometries of the oil ducts all play crucial roles in the electrification process.
1.2.3 Matrix of Stages and Effects
The properties listed above influence different aspects of the electrification process. Table 1-I indicates which of the four basic processes are affected by each property.
1.3 Isolation of Charge Generation Stage
Since the charge generation process provides the fuel, as it were, to the other basic processes, a thorough understanding of it is fundamental to an appreciation of the overall electrification problem. In addition, as indicated in Table 1-I, the generation process is the one affected by the most properties of the transformer system, and thereby reveals most clearly the effects of these properties. It is therefore natural to isolate this process and study it in a regime where the other electrification processes do not come into play.
As will be seen in the following chapters, one result of this isolation is the ability to add to the above list of influences and effects. The two most salient contributions are the effects of
1. presence of obstacles - There is a flow regime peculiar to the Couette configuration in which the even, laminar flow breaks up into cells, as described in Section 3.1.2. This flow is very similar to that encountered around obstacles to the flow, and thus provides an opportunity to investigate the effect of the complex flow around the many spacer blocks in the oil ducts. In any case, protuberances in ducts and secondary convection in transition regions result in charge entrainment similar to that caused by turbulence, but occuring at a much smaller Reynold's number.
2. charge injection -The model proposed in Chapter 4 for studying the effects of
AC energization assumes the existence of a charge injection process at the boundary. The verification of this model is of extreme importance to the study of electrification enhancement due to energization, and is a primary objective in this work.
Table 1-I: The Stage-Effects Matrix, indicating which processes are affected by each property
The Stage-Effects Matrix
generation transport accumulation leakage and insulation
failure
"Charging ECTTendency"
Turbulence Laminar Wall shear sub-layer stress
Flow Rate Streaming Reynold's
current number
Surface Turbulence, drag on wall Characteristics roughness
Energization Charge (AC field) injection
Dielectric puncture
Strength and creep
failure
Conductivity Wall current
of Solid
External Inlet Charging Current
Contaminants, Zeta Potential Enhanced
Surface Active conduction
Agents and Particulate Matter
Temperature Debye Length, Viscosity Conductivity,
Laminar paper/moisture
sub-layer, equilibrium
Arrhenius
Moisture Paper
Configuration Pumps, Pipes Upper plenum, Paper/oil
paper/oil paper/oil interface,
interface interface paper bulk,
1.3.1 Equilibrium and Non-equilibrium Charge Generation
While the transport process inherently overlaps all other processes due to the dependence of electrification on the existence of a flow, charge generation can be separated from accumulation and leakage if it has reached equilibrium. This electrical equilibrium exists if the generated streaming current has reached a steady-state value, referred to as I., and it implies that no current flows to the wall. When these conditions are met the charge density at the wall is the equilibrium value pw, it has no gradient in the direction of the flow, and charge accumulation has therefore stopped.
Systems that are not in equilibrium, that have non-zero currents at the boundaries, can experience the accumulation and leakage phenomena. Charge can accumulate in these regimes by self-precipitating to the walls or by selective adsorption at the interface, leading to. field generation not found in equilibrium charging regions. Leakage through the insulation is inherent to the presence of wall currents, but can be enhanced by accumulated charge, and can even find a new path along the surface due to a surface conductivity developed by this charge. Clearly, systems experiencing non-equilibrium charging find the four basic processes overlapping and prevent isolation of the charge generation phenomenon.
1.3.2 Charge Generated by Energization
In order to obtain a complete understanding of charge generation, effects of energization must be taken into account. Studies have indicated increased electrification activity due to transformer energization20,19, and the present research demonstrates that the AC fields applied during energization augment the flow-induced streaming currents through the charge injection process. In the process hypothesized here, charge is injected into the flow from the boundary by the presence of the applied field; these charges are then acted upon by a combination of fluid and electric forces that can yield a net increase in axial current.
Since the charge injected by this means comes from an external source, it must be transmitted by a wall current, and equilibrium must therefore be destroyed. Indeed, many of the ideas germaine to the analysis of flow-induced currents must now be abandoned, because the applied fields often overwhelm those intrinsic to the equilibrium double layer, disrupting the very source of the original generation process.
1.3.3 The Duct Flow Approach
Many studies of transformer electrification perform experiments on pipe flow models that are designed to simulate the flow between coil windings in a transformer. Both the pipe flow and the flow in the actual oil ducts have development lengths that are even longer then the system, and therefore in both the development process must be taken into account. The wall currents that take part in developing the axial current density are typically detected in pipe flow experiments by measuring image currents either to segmented electrodes that are wrapped around the outer insulating cylinder or to a single electrode covering the entire pipe. This approach enables researchers to examine streaming currents as they develop along the
length of the pipe. It also allows for the generation of substantial electric fields which can become great enough to create discharges both inside the tube and at its edge20,7,11,8. However, it is difficult in these models to rigorously correlate the observed effects with parameters of the system, since the parameter(s) that determine the magnitude of the generated currents may not be the same as those affecting, say, the build up of surface charge or leakage paths. This obfuscation of pertinent parameters is inherent in systems where the basic electrification processes can overlap.
1.4 The Couette Flow Approach
The present research studies a model in which there is a development time, but no development length. All surfaces under examination are in essentially the same state. The spatial development length in pipe flow is here translated into a temporal transient, after which steady conditions are achieved. Although the temporal transient can be used to gleen additional information from the experiment, emphasis here is on two types of steady-state measurements, as explained below.
1.4.1 Description of Configuration
The model used to achieve this steady state is depicted in Figure 1-2. Couette flow is produced by rotation of the inner cylinder, and the generated currents are sampled by a small flow into and out of the Couette apparatus. Variations in the Reynold's number are easily achieved by simply varying the rotational speed of the inner cylinder; the sampling flow rate can remain constant since it does not establish the flow conditions inside the device. Application of an external field is also facilitated, for use in non-equilibrium charge injection experiments.
\/ac
-,xOut Iet
Inlet
1.4.2 Equilibrium Charge Density
As long as the sampling flow rate is small the system, after the start-up transient, is indeed in electrical and mechanical equilibrium: the symmetry in the e-direction allows for no spatial development of current, and therefore no net wall current is required, as long as the currents exiting by the sampling process are negligibly small. Thus, the currents measured are indicators of a purely equilibrium charging process, where no charge accumulation or leakage occurs.
Since it is not appropriate in the present model to think of developing currents convecting charge downstream, the Couette system is best understood in terms of an equilibrium double layer with a much larger Debye length, XT, created by turbulent diffusion. Ignoring the small currents required to account for the measurements, no radial currents exist and the action of the turbulent flow is merely to bring charge from the diffuse double layer into the core of the flow. Since the turbulent core, which extends across almost the entire gap between the cylinders, is a mixed region, the charge density there is assumed to be a constant, po; it is therefore this charge density that is sampled, for the measured current is approximately p0
Qv,
with
Qv the sampling flow rate.
Mathematically, this idea of an enlarged charge double layer is achieved by adding to the molecular diffusion coefficient, Dm, a turbulent diffusion coefficient DT, which represents the mixing action of the turbulent flow. DT is small in the laminar sub-layer, but increases from there to a value DTC that is uniform across the flow core and can be orders of magnitude larger than the molecular diffusion coefficient. As long as the laminar sub-layer is smaller than or comparable to the molecular Debye length, turbulent diffusion can act upon the double layer charges and spread them over a much larger distance, given by
_EDT
where the turbulent diffusion coefficient has replaced DM in the familiar expression for the Debye length. If DT is sufficiently large, the charge double layer can extend across the entire oil gap.
The ratio of the measured charge density p0 to pw, the density at the solid boundary, can be
computed from the Reynold's number of the flow, the liquid conductivity, and the thickness of a molecular diffusion-based laminar sub-layer, using the results of work done by A.A. Sonin and B. Abedian21. The present work investigates in part the validity of using pw as a parameter indicative of the chemistry at the liquid/solid interface, which requires pw to be independent of flow conditions and be determined only by measured properties of the oil and solid material. If its usefulness can be proven, p, can be tabulated for all materials considered for use in power transformers and used as an indicator of their relative charging tendencies. However, pw as a parameter can only be associated with equilibrium charging conditions, for the wall charge varies in developing situations. Thus, to unambiguously test the invariability of the wall charge requires an experiment that can truly measure equilbrium currents.
1.4.3 Non-equilibrium Charging in the Couette Mixer
There are, however, two methods for driving this system out of equilibrium. As will be further discussed in Section 2.1.1, significant wall currents can be required to supply the sampled current if the sampling flow rate is increased. Wall currents are also generated when an applied field is used to augment the flow-induced currents. Both these scenarios destroy the equilibrium that is attained by the unenergized Couette mixer when the sampling flow rate is small, but the symmetry of the Couette device allows these non-equilibrium charging conditions to be investigated in a controlled fashion. Although charge accumulation and leakage may now proceed, no fields tangential to the boundaries can still develop since the charge density varies only in the radial direction. In addition, the degree to which the system is taken out of equilibrium can be precisely controlled, either by the amount of increase in the flow rate through the device or by the electric field strength and frequency.
A major part of the present work is the study of the non-equilibrium charging effects induced by AC energization. Chapter 4 develops a theoretical model to describe the current enhancement that is based on an analysis of the trajectories of injected charges. A rectification process, where charge of only one polarity is injected, is assumed in order to allow a net charge to develop. Turbulence is also assumed to be a major contributor: charges whose trajectories reach into the turbulent core become "trapped" by the turbulence and are mixed across the entire gap. This is a significant effect both because charge over a much larger area is exposed to fluid convection, but also because the radial force exerted by turbulence draws more current from the wall.
A parameter analogous to pw is introduced in this analysis. The injected charge density at the wall is assumed to be a constant, P , and can similarly be used as an indication of the degree of energization activity a particular material interface will contribute.
Chapter 2
Couette Electrification Apparatus
The Couette flow model used to study electrification activity is redrawn in Figure 2-1. Here, the role of the oil ducts between transformer windings is played by the annulus of a compact Couette device consisting of coaxial cylinders, the inner rotating. The choice of this geometry is motivated by a desire for versatility as well as a need for the ability to control and isolate the basic processes at work. The range of speeds at which the inner cylinder can rotate (up to 2000 rpm) provides the ability to study flows varying from the laminar to fully turbulent regimes, and (in the limit where the axial velocity due to the flow through the apparatus is negligible compared to that in the azimuthal direction) the symmetry of the experiment enforces uniformity in the circumferential direction, creating a flow that is fully
developed in both mechanical and electrical senses.
In principle, the total volume of oil required for the experiment is little more than that required to fill the annulus. However, in the work described here, the charge is sampled with
a continuous flow system which itself requires a much greater volume of oil.
Vac
Out le t
Inlet
2.1 The Experimental System
The entire flow system is illustrated by Figure 2-2. Tanks pressurized with dry nitrogen provide the flow, a motor drive system rotates the inner cylinder, and the relaxation chamber on the inlet side traps incoming charge. The outlet of the system is electrically isolated from the fluid reservoir by a short piece of insulating tubing, and the output convection current is then measured by summing the currents from the ensuing metal pipe and the fluid reservoir itself. Through a brush mounted on the rotor, an ac voltage can be applied across the annulus
so that effects of energization on the charging process can be studied.
- .-Fluid Reservoir
Couette
Mixer
Trap Flid R ci vorFigure 2-2: Couette electrification system showing dry nitrogen pressure drive, fluid reservoir and receiver, charge trap, Couette mixer where
inner cylinder rotates, and measurement of current exiting receiver.
2.1.1 The Sampling Approach
There are two flows associated with the system of Figure 2-2: the Couette flow in the central mixer, which establishes the flow conditions for electrification; and the sampling flow entering and exiting the mixer, that allows the charge generated in the device to be measured. As discussed in Section 1.4, these two flows combine to yield a system capable of measuring equilibrium charging currents. The Couette approach differs from pipe flow experiments in that it emphasizes the average charge density across a flow cross-section, rather than the convection current. The rotational flow in the Couette mixer establishes a uniform charge density in the core consistent with the flow conditions and the boundary condition on the charge density at the wall, p,. The flow through the mixer then creates a sampling current proportional to the product of the charge density and the sampling volume flow rate, as long as the current carried by the charge in the thin laminar sub-layers is much smaller than that carried by the core. This withdrawn current is truly a sample of the electrification inside the annulus if it is small compared to the current circulating the mixer.
In order to allow all currents to be accounted for through conservation of charge, the sampling flow is an open loop. Pressure in the fluid reservoir forces the oil through the mixer and into the receiving tank, where it accumulates until the reservoir is emptied. The pressure is then released, and the receiving tank is pressurized to return the oil to the reservoir. In this way, data taken is free from the ambiguities of possible reentrant streaming currents that would be generated in the return path if the loop were closed.
2.1.2 Charge Settling Chamber and Trap
In order for the measured current to accurately reflect charge generated solely in the Couette mixer, the current entering the device must be made negligibly small. This is accomplished in the present system by a relaxation chamber, or charge trap, placed immediately upstream of the mixer, which provides a fluid residence time large enough that any incoming charge can relax or self-precipitate to the grounded wall, greatly reducing the inlet charge density pin. Previous analysis 2 has included molecular diffusion and ohmic conduction to analyze the effectiveness of the charge trap. In the present analysis, diffusion is ignored but the effects of ohmic conduction and charge self-precipitation are combined to calculate pin as a function of the parameters of the system. The thrust of the analysis is a comparison of the fluid residence time in the trap, tresT, to the dielectric relaxation time te and the self-precipitation time tm. If either te or tm is small compared to tresT, any charge entering the
trap has time to leak away before exiting the trap and entering the Couette mixer.
This analysis is carried out in a previous paper22, and yields an expression for the ratio of the charge density in the fluid leaving the trap to the charge density entering. As the charge leaving the trap is the inlet charge to the Couette mixer, it is denoted pin, while the charge entering the trap is pi; the ratio pin/pi is then
.i pin 1
m>>Te rresT Pi resie
Here the migration time tm=E/pb is assumed to be very large, since the charge densities encountered in the trap in our system are small. For values of tresT and te typical of our system (computed in Section 2.1.4), the charge density exiting the trap is about 6% of what enters.
Section 2.2.1 describes how the trap efficiency can be experimentally verified. Although this has not been done, a ceiling can be placed on the current entering the mixer from the current measured with the flow on but with no rotation of the inner cylinder. Since this value is 20-100 times less than the currents measured with rotation, we are assured that rotation and energization effects are dominant. This check, made possible by the independence of the effective Reynold's number of the flow used to sample the charge, is another advantage of the Couette approach. In a duct flow, the degree to which charge enters the duct is likely to depend on the same flow rate that determines the pipe Reynold's number.
2.1.3 Mounting of Paper
An important attribute of the Couette system is the relative ease with which it allows for a meaningful examination of different materials: the small inventory of oil can easily be replaced or altered, and the small surface area exposed in the mixer means that different solid materials can be quickly wrapped on the cylinders. The solid insulation used in transformers consists primarily of sheets of pressboard and layers of kraft paper; in our experiments the kraft paper was chosen for its greater ease of application, though thin pressboards may be used in the future. The actual materials used were chosen to match those used in Westinghouse transformers: the paper is Manning Paper Company's grade 220 insulating kraft, and the glue is Imperial Vetak, supplied by EHV-Weidmann.
The two methods for mounting the paper on the inner and outer surfaces are drawn schematically in Figure 2-3. The inner cylinder has a groove cut down its length to allow one edge of the paper to be firmly wedged into place- by a close-fitting block. The paper is then wrapped once around the cylinder and a strip of glue attaches it back onto itself. The more difficult placement of paper on the outer cylinder is achieved by first preparing a cylinder of paper around an extra, appropriately-sized cylinder and gluing it to itself. This hollow cylinder is cut into quarters and mounted on end caps during the wrapping process, as shown in Figure 2-3. Once the 8-9 layer thick paper roll is dried, the end caps are removed and the cylinder is collapsed, allowing the roll to be easily removed. The paper can then slide snugly into the outer cylinder and is held in place by two steel bands and two lipped sleeves in the inlet and outlet holes. The steel bands expand to press the paper to the metal wall, and the sleeves screw into the external fittings from the inside.
The paper thus installed in the Couette mixer can be oil-impregnated in a vacuum oven to remove the moisture it has naturally absorbed. This impregnation procedure, detailed in Appendix A, is a two-step process: the paper-lined mixer is placed in a vacuum-tight, heated environment for a prolonged period, and is then moved without exposure to air into a glovebox with a dry nitrogen atmosphere to be prepared for installation in the flow system. The vacuum-heating stage drives moisture from the paper and oil and provides for the moisture to be externally collected. Once treated, the glovebox enables the mixer to be capped without exposing the contained oil and paper to humid air.
2.1.4 Critical Times and Lengths
Certain time constants associated with electrification phenomena help explain the transients evident in measurements. These are listed below:
* Migration time, um - The self-precipitation time of charge with density p and mobility b is
TM= (2.1)
where the mobility can be found from an empirical rule for positive ions in insulating dielectrics with absolute viscosity T123:
CI)
*S t
0
nd
Figure 2-3: Method of wrapping paper onto a) the inner cylinder and b) the outer cylinder. The quartered wrapping cylinder c) is also illustrated.
0
b= l.5x1 m2
1(V-s) (2.2)
For our transformer oil at 700F, T1=16 cp=.016 N-s/m2 so that b=10-9 m2/(V-s). Typical measured charge densities in transformers vary over the wide range of
1-1000 pC/m3 so that the migration time varies from 19,500 seconds down to
19.5 seconds; however, the measured densities in the Couette apparatus are more
on the order of 3-150 gC/m3, indicating large migration times of order 130-6500 seconds.
* Dielectric relaxation time, ce -The dielectric relaxation time te, given by
t = , (2.3)
can vary by orders of magnitude because of the large variation in ohmic conductivity of insulating oils as a function of parameters not easily controlled. Pure Gulf Transcrest H oil, as rated by the manufacturer, has a permittivity E=2.2Eg and an ohmic conductivity G=10-13 mhos/m at 250 C yielding a relaxation time of 195 seconds. While our measurements of the oil in our system give the same value of the permittivity, measurements of the conductivity indicate a value Y=1.2xl0-12 mhos/m. Thus the relaxation time of the oil in our experiments is comparatively short, te=16 seconds.
* Residence time, tres - The residence time in a chamber is the quotient of the volume of that chamber and the flow rate through it:
VoVchamber
res Qv
In the Couette flow system, there are two residence times of interest: the residence time of the charge trap, tresT, and that of the Couette mixer itself,
tresC-Trap The volume of the charge trap is 1.85 x 10⁻³m3, yielding tresT=2 65 seconds for a volume rate of flow Q,=7xl0-6 m3/sec
Mixer The mixer's volume is 5.8 x 10⁻⁴m3, and has residence time tresC=83 seconds.
* Run time, Trun -The duration of a single run of the experiment is simply
VVliquid
ru~n
QV
and, since the experiment contains approximately 6 liters of oil, lasts about 15 minutes for a Qv=7x10 6 m3/sec.
* Turbulent development time, tdev -As a first-order approximation to the time required for the turbulent flow in the mixer to develop, we calculate a diffusion time using the coefficient of turbulent diffusion:
d2
trdev D_ 5 T
where d=.5" is the spacing between inner and outer cylinders. We use an expression for the turbulent diffusion coefficient in the core from Abedian and
Sonin's work2 1:
DTC=.05v. d
where v. is the friction velocity, given by
-PM
with tw the wall stress and pm the fluid mass density. The friction velocity can be computed with empirical correlations for particular flow geometries. G.I. Taylor has correlated the normalized wall stress for Couette flow2 4
-. 1 R -2 (2.4) (2.5) 300 R 10,000 (2.6) (R=QR2d/v)
in terms of the angular velocity Q (rad/s) of the inner cylinder, the outer cylinder radius R2, and the fluid Reynold's number R. The Reynold's number for Couette flow,
OR 2d V
is 2.8 times the rotational speed in RPM for our system. We can now write V, =.32 VR 3/4
d
and determine the core turbulent diffusion coefficient:
D TC =1.6xl0~2vR3/4
Thus for our viscosity of v=1.8x10⁻⁵ m2/s (pm=9 00 kg/m3), DTC=1.2x10⁻⁴ m2/s and tdev=1.4 seconds at a Reynold's number of 3000.
* Debye length, X -The stagnant debye length results from a balance of the ion diffusion time, X2/Dm, with the relaxation time, /ca:
ED
X=
M~~5The molecular diffusion coefficient Dm is found from the Einstein relation:
Dm kT
- -- 25 mV b q
where our mobility yields Dm=2.5x0-l m2/s. For our conductivity a=1.2x10⁻¹² mhos/m, the Debye length is approximately 20 min.
* Turbulent Debye length, XT - Modeling the effects of turbulence with a turbulent diffusion coefficient DT gives rise to a new length, the turbulent debye length XT:
ED T
Using the core turbulent diffusion coefficient found above and a=1.2x10⁻¹² mhos/m, we obtain ?v~4 mm for a Reynold's number of 3000.
" Diffusion-based laminar sub-layer thickness, 8m - This distance defines a region near the wall inside which the flow can be approximated as laminar for the purposes of mass transport. It is thus dependent on the molecular diffusion coefficient Dm, through the Schmidt number S21:
6 11.7vy
8M = -17 S=
-5itP1 ' Dm
Using Taylor's wall stress correlation, we relate 8M to the Reynold's number as = 3 6.6d R34
*Sin
which is 12.8 gm at R=3000.
" Viscous sub-layer thickness, 5V - The viscous sub-layer is analogous to the laminar sub-layer, and is a zone near the wall where turbulence is negligible in determining momentum transport. It is, therefore, the sub-layer used in determining the velocity profile. Schlicting gives an empirical expression for this parameter based again on the friction velocity25:
v, -- 5
8,=15.6dR- 14 (2.7)
These times and lengths are summarized in Table 2-I, which includes typical values of each parameter in our system.
Other constants of the oil and the geometry are listed in Table 2-II for reference.
2.2 Absolute Measurement of Charge
As discussed in Section 2.1.1, the current measured from the Couette mixer samples the uniform charge density created by the turbulent flow inside. The rotation of the inner cylinder establishes the flow conditions, which if highly turbulent enough produce a uniform charge density p0 across the gap, and the small sampling flow
Qv
through the device yieldsthe measured current, p0Qv. The open-loop nature of the overall flow system excludes any
ambiguities in the measurements of this current, as can be seen by conservation of charge.
Figure 2-4 reillustrates the Couette electrification system and indicates a surface S with which conservation of charge can be used to find the current measured through the electrometer. The charged oil exiting the Couette mixer passes first through a short section of insulating tubing and then into a length of steel tubing that carries it into the fluid receiver. The steel tubing is insulated from the outside of the receiver, and is connected to an inner bucket that is electrically isolated from the outer container, thus, the only conductor that the surface S cuts is the wire to the electrometer. In addition, the mixer, steel tubing and fluid receiver are shielded in a Faraday cage, and thus the only currents passing through S are the current convected through the piece of insulating tubing, p0Qv, and the measured current through the electrometer. Hence, the measured current is truly the current exiting the Couette device, independent of currents generated by electrification in the metal tubing.
In addition, the frequency response is limited only by an RC time constant comprised of the resistance of the electrometer and the capacitance between the inner and outer cans. Since both these values are very low, the frequency response is quite good.
2.2.1 Other Currents in the Electrification System
The open-loop nature of the flow system also allows other pertinent currents to be measured in manners analogous to that used above to find the current exiting the mixer. The current entering the mixer can be found from the surface S : the three currents exiting that surface must add to zero, and thus the inlet current Ii=piQ is the negative of the sum of the ground currents from the charge trap and the inner container in the fluid reservoir. The efficiency of the trap can thus be determined by measurements of the two ground currents.
Similarly, the difference between the currents exiting and entering the Couette mixer can be found from the surface Sd* This difference, Idiff=Qv(Po-Pi), must be supplied by currents
Table 2-I: Various time constants in the Couette system.
Typical Values
Time Formula in Couette System
Migration Time 130 -6500 sec for
-Tm=: p=3-150 jtC/m3
pb
Relaxation Time 16 seconds with
IC a=1.2xl- 12 mhos/m ea
Residence Time V 265 sec in trap 83 sec in mixer
Q, when
Qv=7
ml/secTurbulent 1.4 sec at R=3000
Development Time
DT
Run Time 15 minutes
Vjjqujd
run V
Typical Values Length Formula in Couette System
Debye Length 20 gm for
EDM (a=1.2x10⁻¹² mhos/m, DM=2.5x10-ll m2/s
Turbulent 4 mm for
Debye Length EDT DT=1.2x10⁴ m2/s a a=1.2x10⁻¹² mhos/m
Laminar Sub- 8 - 23 pm for
Layer Thickness 6 = 11.7V 500-1800 RPM 500-100 RP S1/3 +'
Viscous Sub- 330 - 866 Jim for
Table 2-II: Constants of the oil and the geometry of the Couette system at 200C.
Parameter Symbol Value
Oil permittivity E 2.19 P-0
Oil conductivity a 1.2x10⁻¹² mhos/m
Ion mobility b 10-9 m2/(V-s) Kinematic viscosity v 1.8x10⁻⁵ m2/s Mass density Pm 900 kg/m3 Molecular diffusion Dm 2.5x10⁻¹¹ m2/s coefficient Inner cylinder Ri 2.54x10⁻² m radius Outer cylinder R2 3.8lx10-2 m radius Height of 1 2.29x10⁻¹ m Couette device r- i Res er voir Sd
Couette
M ixe r
Tr -p --- d Recel verFigure 2-4: The Couette electrification system, showing surfaces for performing conservation of charge.
on previous results. These wall currents indicate the degree to which the Couette mixer falls short of attaining true equilibrium conditions, since equilibrium demands zero current at the liquid/solid interface. However, as long as these wall currents, which are necessary to provide a measurement, are small compared to the convection current circulating the mixer, equilibrium is very closely approximated.
Chapter 3
Equilibrium Charging Theory and Experiments
This chapter summarizes the theoretical basis for the experimental results of the Couette electrification apparatus, and presents the equilibrium charging data taken. The experimental procedure is detailed, and the system parameters that are documented in the experiments are indicated. The goal of this section is to provide and examine a framework for understanding the data that relates the results to a boundary condition determined by the documented parameters.
3.1 Couette Fluid Mechanics
The first step towards an appreciation of the results that will be presented in Section 3.4 is to gain an understanding of the fluid mechanics in the Couette mixer. The flow between concentric rotating cylinders has been well-studied24,26,27,28 and has taken the name of the first person to detail the mathematics, Couette. The flow conditions experienced when the inner cylinder rotates and the outer one is fixed pass through three regimes, including a region of cellular convection between the typical laminar and turbulent flows that is peculiar
to Couette flow. These are listed below and illustrated in Figure 3-1:
1. laminar flow -the flow pictured in Figure 3-la applies to low rotational speeds and is perfectly smooth, with no radial velocity component.
2. cellular convection - as the speed passes through a (relatively low) critical value, the flow experiences a type of instability not found in pipe flows: the smooth laminar flow breaks up into three-dimensional cells. These are depicted in Figure 3-1b.
3. full turbulence - as the rotational speed increases past the critical value, the cells begin to break up and eventually give way to fully turbulent flow.
3.1.1 Laminar Flow
The smooth flow characteristic of low rotational speeds has zero radial component, and is given by
R1R2 R2 r
V(r)= V rR(3.1) S RR2 22- -R,1 2 \r R2
2
where R, and R2 are the radii of the inner and outer cylinders, respectively, and V, is the velocity at the surface of the inner cylinder.
0
0
Figure 3-1: The three flow regimes of Couette flow: a) laminar flow; b) the so-called Taylor cells; and c) fully turbulent flow.
3.1.2 Cellular Convection
At surprisingly low speeds, the laminar flow of Section 3.1.1 breaks up into cells. A condition for the incipience of cellular convection with the outer cylinder of radius R2 stationary and the inner cylinder of radius R, rotating at angular speed Q is given in terms of a parameter P, which is related to the Taylor number T24:
PC=0.0571(1-0.652d
)
+ 0.00056(1- 0.6 52)
(3.2)is the oil gap spacing and T is the Taylor number. Thus, the critical rotational speed
(3.3) // -7
O~)
27C4 7Cv2(R1 +R2) T 2Q2 d3R12 where d QC is 4V2(R 1+R2) C = p dIFor the values in our system, this speed is
C6V
Q= 4.39 rad/sec = 42 RPM
and the critical value of P is PC=0.039. Thus, at very low rotational speeds, the flow in the Couette mixer goes unstable and forms Taylor cells.
S. Chandrasekhar has computed the Taylor number T in terms of a parameter a=kd, where k is the wavenumber associated with the spatial periodicity of the cells. This expression for T is then minimized to yield a value am that gives the wavenumber at incipience of the instability (i.e. when T=Tc)28:
a =k d=3.12
This wavenumber can be used to predict the frequency of any oscillations in the streaming current data that would reflect the existence of Taylor cells. This frequency should be the product of the critical wavenumber and the axial flow velocity through the mixer, Uaia:
3.12
Q,
m. =k U = 2 2 (3.4)
C
c xiald7(R 2 -R, 1)where
Qv is the sampling flow rate and the axial velocity is Uaixa=Qv/7t(R
22-Ri2). Using the parameters of our system, we obtain oosc=.64 rad/sec at Qv=7xlO-6 m3/s, corresponding to a period of1
t, ==10 sec
3.1.3 Turbulence
When the flow has reached full turbulence, Taylor measures the velocity distribution as shown in Figure 3-1c27. To a very high accuracy, the product of the average velocity U and the radius r is constant throughout the core of the flow. However, the velocity departs from this behavior in the viscous sub-layers near the walls: near the inner cylinder the flow increases to the value K2R, with slope tw/1 (wall stress divided by the absolute viscosity), while it tapers to zero with the same slope as it approaches the outer, stationary cylinder. The thickness of these sub-layers we recall from Equation 2.7:
5V=15.6 dR-14
We approximate the turbulent velocity profile by piecing together three linear regions: the two sub-layers have slopes rw/TI and thicknesses 8v, and the region in-between simply connects the two. Thus, the velocity profile is given by
Tw
V= M2[r-(R,+] -- Wv R +,< r <R -8 (3.5)
W (R2-r) R -8 <<
2V where the slope of the velocity in the core is
2,tfzJR
-M2= d-2,
3.1.4 Sampling Model
Figure 3-2 illustrates the fluid mechanics model used to calculate the sampled current. Since the outlet of the Couette mixer is very near the top plate of the device, the fluid surrounding the exit hole is assumed to be fully mixed due to the secondary convection created by the zero-velocity boundary condition at the top plate; the fluid there is thus assumed to have an average charge density p0. The current exiting the Couette mixer, p0
Q,,
must equal thecurrent flowing up into the mixed region, and that current is found by integrating the product of the charge density and the velocity below the mixed region over the cross-section:
= 2p( (r) 2 r r (3.6)
Here p(r) is the charge density and vz(r) is the axial flow velocity profile beneath the mixed sampling region.
The shape of the assumed axial velocity profile is determined by the rotation of the inner
cylinder: turbulence is presumed to dominate the central part, as it does in the circumferential
velocity profile, and two boundary layers near the walls are assumed to have linearly decreasing profiles. The thickness of these two linear regions is determined by the viscous sub-layer thickness 5V associated with the rotational Reynold's number, as determined in Equation 2.7:
8= 15.6dR-3/4
The mean velocity V in the core, which is uniform with radius since neither wall has a vertical velocity component, is then determined by integrating the velocity profile over the cross-section and equating to the volume rate of flow through the mixer:
Ry
QJv=*R2 v,(r) 2mrdr
Note that we assume turbulence throughout the entire operating range (280< R <5040). The region between Reynold's number 110 and around 2800, however, is ambiguous, since the
1
Figure 3-2: Outlet region of Couette mixer, showing fully mixed region at the top and axial velocity profile.
cellular convection that arises there can be thought of as both laminar and turbulent: the velocity profile is well-defined, but the cellular action enhances mass transport in a way similar to turbulence. Taylor helps decide the debate, since his turbulent wall stress correlation is valid throughout the range R=300 to R=10,0002 4.
We now write a summary of the axial velocity profile:
V V(rRi) V= V V V(R-r) R +8 <r<R -v R2-8v<r<R2 (3.7)
which yields an expression for V in terms of the volume rate of flow:
V_
QV
7t(R2-Rl-8,)(Rl+R2)
The next section discusses an adaptation of a model which allows calculation of a uniform flow-induced charge density in the core. Once this is found, it can be plugged into Equation 3.6 to predict the measured current.