HAL Id: hal-00295527
https://hal.archives-ouvertes.fr/hal-00295527
Submitted on 14 Sep 2004
HAL is a multi-disciplinary open access
archive for the deposit and dissemination of
sci-entific research documents, whether they are
pub-lished or not. The documents may come from
teaching and research institutions in France or
abroad, or from public or private research centers.
L’archive ouverte pluridisciplinaire HAL, est
destinée au dépôt et à la diffusion de documents
scientifiques de niveau recherche, publiés ou non,
émanant des établissements d’enseignement et de
recherche français ou étrangers, des laboratoires
publics ou privés.
comparison using transport model simulations and
measurement data
N. Spichtinger, R. Damoah, S. Eckhardt, C. Forster, P. James, S. Beirle, T.
Marbach, T. Wagner, P. C. Novelli, A. Stohl
To cite this version:
N. Spichtinger, R. Damoah, S. Eckhardt, C. Forster, P. James, et al.. Boreal forest fires in 1997 and
1998: a seasonal comparison using transport model simulations and measurement data. Atmospheric
Chemistry and Physics, European Geosciences Union, 2004, 4 (7), pp.1857-1868. �hal-00295527�
SRef-ID: 1680-7324/acp/2004-4-1857
Chemistry
and Physics
Boreal forest fires in 1997 and 1998: a seasonal comparison using
transport model simulations and measurement data
N. Spichtinger1, R. Damoah1, S. Eckhardt1, C. Forster1, P. James1, S. Beirle2, T. Marbach2, T. Wagner2, P.C. Novelli3, and A. Stohl4
1Department of Ecology, Technical University of Munich, Germany 2Institute for Environmental Physics, University of Heidelberg, Germany 3NOAA, Climate Monitoring and Diagnostics Laboratory, Colorado
4Cooperative Inst. for Research in Environmental Sciences (CIRES), Univ. of Colorado/NOAA Aeronomy Laboratory, USA
Received: 9 January 2004 – Published in Atmos. Chem. Phys. Discuss.: 18 May 2004 Revised: 16 August 2004 – Accepted: 19 August 2004 – Published: 14 September 2004
Abstract. Forest fire emissions have a strong impact on
the concentrations of trace gases and aerosols in the atmo-sphere. In order to quantify the influence of boreal forest fire emissions on the atmospheric composition, the fire sea-sons of 1997 and 1998 are compared in this paper. Fire ac-tivity in 1998 was very strong, especially over Canada and Eastern Siberia, whereas it was much weaker in 1997. Ac-cording to burned area estimates the burning in 1998 was more than six times as intense as in 1997. Based on hot spot locations derived from ATSR (Along Track Scanning Radiometer) data and official burned area data, fire emissions were estimated and their transport was simulated with a La-grangian tracer transport model. Siberian and Canadian for-est fire tracers were distinguished to invfor-estigate the transport of both separately. The fire emissions were transported even over intercontinental distances. Due to the El Ni˜no induced meteorological situation, transport from Siberia to Canada was enhanced in 1998. Siberian fire emissions were trans-ported towards Canada and contributed concentrations more than twice as high as those due to Canada’s own CO emis-sions by fires. In 1998 both tracers arrive at higher latitudes over Europe, which is due to a higher North Atlantic Oscil-lation (NAO) index in 1998. The simulated emission plumes are compared to CMDL (Climate Monitoring and Diagnos-tics Laboratory) CO2 and CO data, Total Ozone Mapping Spectrometer (TOMS) aerosol index (AI) data and Global Ozone Monitoring Experiment (GOME) tropospheric NO2 and HCHO columns. All the data show clearly enhanced signals during the burning season of 1998 compared to 1997. The results of the model simulation are in good agreement with ground-based as well as satellite-based measurements.
Correspondence to: N. Spichtinger
(spichtinger@forst.tu-muenchen.de)
1 Introduction
Biomass burning causes large emissions of carbon diox-ide (CO2), carbon monoxide (CO), nitrogen oxides (NOx), methane (CH4), aerosols and other trace substances, which influence the concentrations of trace gases and aerosols in the atmosphere and affect the atmosphere in various ways. CO2and CH4are important greenhouse gases, contributing to global warming. The solar radiation budget is strongly affected by the aerosols emitted by the forest fires, too (Asakuma et al., 2002; Torres et al., 1998, 2002). Finally, forest fires can even be a source of stratospheric aerosols (Fromm and Servranckx, 2003). Tropospheric chemistry is influenced by the emissions of CO and NOx, precursors of tropospheric ozone (O3) (Chan et al., 2003) – an effective greenhouse gas itself –, and nitric acid (HNO3), a product which is part of the nitrogen chemical reaction cycle, leading to acid rain (Jaegle et al., 1998). Boreal fires emit relatively large quantities of NOxdue to high burning temperatures, es-pecially during the appearance of crown fires, which account for most of the areas burned in the boreal fire regime (Ka-jii et al., 2002; Cofer et al., 1998). Additionally, other trace gases are emitted like methyl bromide and methyl chlorine which are involved in catalytic cycles of stratospheric O3 de-struction.
The input of biomass burning emissions into the atmo-sphere is often discussed as a phenomenon of the tropical rain forest and savannas (Crutzen and Merlet, 1990; Andreae et al., 2001; Andreae and Merlet, 2001). However, the bo-real forest contains one third of the terrestrial carbon stor-age, boreal burning emits up to 20 percent of the global biomass burning CO (Conard and Ivanova, 1997) and tem-perature increases are expected as a consequence of climate change (Stocks et al., 1998) in the ecologically sensitive high
Table 1. Areas burned [Mha] in Canada and Siberia during the
years 1997 and 1998, according to different sources: a UNECE (1999),bConard et al. (2002),cKasischke and Bruhwiler (2003).
Siberia Canada Year Area Burned 0.98 0.62 1997a 5.34 4.71 1998a 13.3 1998b boreal region 17.9 1998c
Table 2. Hot spots detected on the basis of ATSR night-time data
for the years 1997 to 2001.
hot spot counts year Canada Siberia 1997 974 6321 1998 8701 21721 1999 3588 5803 2000 3469 8302 2001 1797 5031
northern latitudes, possibly leading to enhanced fire activity in the future (Flannigan, 1998). Furthermore, the lifetimes of many trace gases and aerosols in the atmosphere are much longer in the boreal region than in the tropics. Because low annual average temperatures and dryness lead to accumula-tion of ground fuel through slow decomposiaccumula-tion processes, boreal fires consume large amounts of fuel, burn with high in-tensity and spread particularly fast. Furthermore, boreal fires are subjected to a strong interannual variability (Amiro et al., 2001). Finally, boreal forest fires are not only a local dis-turbance factor but, due to atmospheric transport processes, they affect tropospheric chemistry on regional (Kato et al., 2002; Tanimoto et al., 2000) and even continental and hemi-spheric scales (Fromm et al., 2000; Wotawa and Trainer, 2000; Forster et al., 2001; Spichtinger et al., 2001; Wotawa et al., 2001).
Boreal forest fires occur mainly from May to October (Lavoue et al., 2000) and are most frequent in Canada and Siberia. The 1998 burning season in the boreal region was much more active than the 1997 one (Table 1). 1998 was one of the worst five years since forest fires are recorded in Canada (Svidenko and Goldammer, 2001), and one of the most severe years during the last 15 years in Siberia (UN-ECE, 1999).
Strong burning is favoured by drought conditions and high temperatures (Svidenko and Goldammer, 2001; Kajii et al., 2002; French et al., 2003). Cahoon et al. (1994), for in-stance, described how high temperatures, dryness and strong
winds lead to extensive forest fires in China in 1987. During the last three decades the burned area in the boreal region shows a positive trend, a consequence of increasing tem-peratures. Especially the years with very strong fire activ-ity all coincided with positive temperature anomalies (Ka-sischke and Bruhwiler, 2003; Stocks et al., 1998; Flannigan, 1998). South East Siberia normally experiences dry anti cy-clonic conditions in combination with the monsoon circu-lation until July and then shifts into a cyclonic humid sit-uation. In 1998 midlatitude cyclones did not reach latitudes higher than 30◦–35◦N and it remained dry and hot east of the Okhotsk Sea longer than normal (Efremov and Sheshukov, 2000). Fig. 1 shows maps of the temperature anomalies from June to August for the years 1997 and 1998, calculated using NCAR/NCEP reanalysis data. In 1998 most of the north-ern hemisphere features positive temperature anomalies. Re-gions with extremely high values, up to 4.5 K, are found in the boreal burning regions in northern and central Canada and eastern Siberia, respectively. In 1998 in most parts of these regions high temperatures are combined with less than normal precipitation (Fig. 2). Thus, fire-favouring meteo-rological conditions prevailed in 1998 presumably due to the strong El Ni˜no/Southern Oscillation event of 1997/1998 (Kita et al., 2000; Novelli et al., 2003; Duncan et al., 2003). In contrast, no large anomalies are found for 1997.
This paper compares measurement data from various sources (surface measurements of CO and CO2from a flask sampling network, aerosol index values and columns of tro-pospheric NO2and HCHO from satellite remote sensing) and transport model simulations for the years 1997 and 1998. In the next section, estimates for the areas burnt and the re-spective trace gas emissions in 1997 and 1998 are made. In Sect. 3, the measurement data and model simulations are de-scribed. In Sect. 4, results from the transport model simula-tions are shown, and in Sect. 5 analyses of the measurement data are presented. Finally, conclusions are drawn in Sect. 6.
2 Areas burned and emissions
Data on the areas burned and emissions from fires are the basis and at the same time the limiting factor for the qual-ity of quantitative transport modelling of biomass burning plumes. Different estimates of total areas burned in Canada and Siberia are shown in Table 1. According to official data, more than 10 million ha were burned in both regions in 1998 (UNECE, 1999), which is more than six times the area burned in 1997. However, it is known that the Russian offi-cial data strongly underestimate the burned areas in Siberia (Conard and Ivanova, 1997; Conard et al., 2002), where a large number of forest fires remain undetected (Cahoon et al., 1994). Using remote sensing data, Kasischke and Bruhwiler (2003) estimated that 17.9 million ha forest burned in the bo-real region in 1998, the largest area burned of the decade. For comparison, in 1997 an area of just 1.6 million ha has burned
Fig. 1. Climatological surface temperature anomaly [K] from June to August of 1997 (top) and 1998 (bottom), according to NCEP reanalysis
data.
Fig. 2. Precipitation anomaly [mm/month] from June to August of 1997 (top) and 1998 (bottom), according to GPCC (Global Precipitation
Climatology Centre) data.
(UNECE, 1999) (Table 1). Official data from UNECE (1999) suggest similarly large areas burned in Canada and Siberia in 1998 (Table 1). But Kasischke and Bruhwiler (2003) esti-mated that 29 % of the total area was burned in Canada and 71% in Siberia. Unfortunately, more detailed fire inventories are not available, especially not for Siberia.
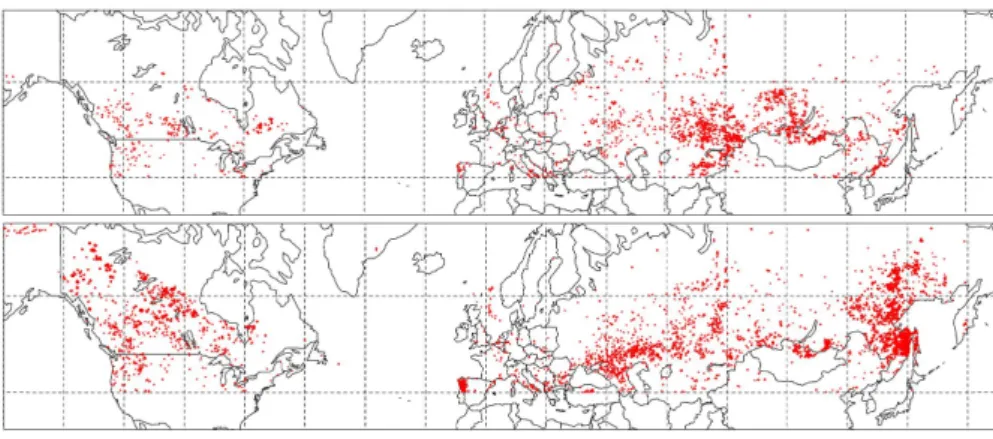
Therefore, night-time fire hot spots, based on data from the ATSR instrument flying on the ERS-2 platform (see http://shark1.esrin.esa.it/ionia/FIRE/), were used for charac-terizing the spatial distribution of the fires. Coordinates of hot spot locations are available on a daily basis for the period 1997 to 2001 and their total numbers are shown in Table 2. There is a high variation of the number of hot spots detected during the different years. 1997 has a below-average occur-rence of hot spots, especially in Canada, whereas 1998 stands out as the year with most hot spot detections both in Canada and Siberia. In 1997 (Fig. 3 top), hot spots were detected mainly in the United States of America, Europe and Southern
Asia, but in 1998 (Fig. 3 bottom) regions with high density of fire hot spots can be seen in Canada and Eastern Siberia. A distinct maximum of hot spot occurrence was located over the Russian Far East, whereas the rest of Russia experienced a moderate fire season (Conard et al., 2002). The Russian Far East always has a very high fire danger because of the recurrence of drought conditions, the regional meteorologi-cal and topographimeteorologi-cal situation and the abundance of com-bustible material (Efremov and Sheshukov, 2000). However, in 1998 the situation was extreme, due to the strong drought caused by the El Ni˜no/Southern Oscillation (Generoso et al., 2003; Novelli et al., 2003).
The hot spot data cannot directly be used to estimate the areas burned, and therefore we have to use other sources for this information. The ratio between Siberian and Canadian ATSR hot spot counts in 1998 is around 2.5 (see Table 2) in good agreement with the burned area estimation of Kasis-chke and Bruhwiler (2003). In order to obtain the same ratio
Fig. 3. ATSR hot spots summed from May to October of 1997 (top) and 1998 (bottom).
Table 3. Emitted masses of CO [Tg] derived from the FLEXPART
model setup. Siberia Canada 1997 1998 1997 1998 May 2.45 3.37 0.25 2.07 June 1.31 2.85 1.27 1.12 July 0.79 13.28 0.26 7.01 Aug 1.04 21.51 0.34 8.77 Sep 1.55 11.10 0.29 1.96 Oct 2.52 1.21 0.37 0.52 total 9.68 53.68 2.78 21.45
between Canadian and Siberian burned areas the official es-timate (UNECE, 1999) for the total burned area in Canada was multiplied by a factor of 2.5. Therefore for the simu-lation of the burning period of 1998 4.7 Mha and 11.7 Mha burned area were assumed for Canada and Siberia, respec-tively. Using the estimates of total area burned and the num-ber of hot spots detected in 1997 and 1998, we estimate that, on average, a hot spot covered an area of 380 ha in 1997 and 540 ha in 1998. Although the actual areas burned may vary considerably from hot spot to hot spot, assuming that they all burned equal areas, we can use the hot spot data to deter-mine the temporal and spatial variation of the burning, which were needed for the emission estimates. Because of the bi-ases of satellite detection due to, e.g. cloud cover and smoke (Kasischke et al., 2003), the burned areas we use are rough assumptions.
In our model simulations we used a CO tracer to study the prevailing transport patterns and thus needed an estimate for the CO emissions. Emission factors for CO are normally based on the amount of biomass burned. For instance, An-dreae et al. (2001) estimate 107 g CO/kg biomass burned. In order to apply this emission factor, we need to know the amount of biomass burned. Cofer et al. (1998) report fuel
consumption rates for boreal forest fires of 4.27 kg/m2. Us-ing this rate together with our previous estimates of the ar-eas burned, we can determine the emission rates of trace gases. Table 3 shows the monthly variation of the esti-mated CO emissions for both Siberia and Canada in 1997 and 1998 based on this algorithm. Total CO emissions of Canada and Siberia were estimated as around 75 Tg in 1998 and about 12 Tg in 1997. Compared to Canada’s anthro-pogenic CO emissions of 52.7 Tg/y (see EDGAR emission inventory (1995), http://arch.rivm.nl/env/int/coredata/edgar/) Siberian CO emissions by fires in 1998 are around equal.
Our estimates of the CO emissions (see Table 3) are in good agreement with those of Kasischke and Bruhwiler (2003) and Duncan et al. (2003) who estimated that 88– 102 Tg and 70 Tg, respectively, of CO were emitted in the boreal region in the year 1998, and with the values given by Kajii et al. (2002), who calculated that 50 Tg CO were emitted in Siberia, in 1998. Finally, Novelli et al. (2003) cal-culated emissions of 300 Tg CO by all fires (including fires in the tropics) that burned during the El Ni˜no in 1997/1998. Thus, based on our assumption of 75 Tg CO the boreal re-gion contributed a substantial fraction, 25%, to the total fire emissions in 1997/1998. Compared to the averaged global CO emissions by biomass burning of 748 Tg/a estimated by Holloway et al. (2000) and Galanter et al. (2000), the boreal region accounted for about 10% in 1998 and 1.6% in 1997.
3 Data and Methodology
The transport of forest fire emissions was simulated with the Lagrangian particle dispersion model FLEXPART (ver-sion 5.1) (Stohl et al. 1998,http://www.forst.tu-muenchen.de/ EXT/LST/METEO/stohl/) for the burning seasons of 1997 and 1998 from May to October. For this study, FLEXPART was used with northern hemispheric data from the European Centre for Medium-Range Weather Forecasts (ECMWF, 1995) with a horizontal resolution of 1×1 degree, 31 ver-tical levels and a time resolution of 3 h (analyses at 0, 6, 12,
a)
b)
c)
d)
Fig. 4. Total columns of FLEXPART CO tracers [mg/m2] averaged from May to October: (a) Canadian CO tracer (1997), (b) Canadian CO tracer (1998), (c) Siberian CO tracer (1997) and (d) Siberian CO tracer (1998). The red boxes in panel (a) show the regions used for calculating source-receptor-relationships (see text for more details).
18 UTC; 3-hour forecasts at 3, 9, 15, 21 UTC). FLEXPART calculates the trajectories of a multitude of particles to simu-late the transport of passive tracers. We simusimu-lated tracers for CO emitted by boreal forest fires, which were released ac-cording to our emission estimates (see Sect. 2), but for which deposition and chemical processes were considered only by applying a constant chemical lifetime of 60 days for the CO tracers. The lifetime of the CO tracer is assumed as a mean of the global lifetime of CO which is given by Seinfeld and Pandis (1998) within the range of 30 to 90 days. Independent CO tracers were used for Canadian and Siberian forest fires (according to Canadian and Siberian box shown in Fig. 4a) , in order to distinguish between these two sources. CO emis-sions were put into the lowest 3 km of the model atmosphere. In order to see whether the simulated forest fire plumes ap-pear also in observations, NOAA CMDL flask data, TOMS aerosol index data and GOME tropospheric NO2and HCHO columns were inspected.
The NOAA CMDL Carbon Cycle Greenhouse Gases group makes measurements of CO2 and CO. These mea-surements form a global network of background sites for carbon cycle monitoring (Novelli et al., 2003; Randerson et al., 1999), which measure continuously since the end of the 1970s. CO2 data are available since 1982 and CO data since 1990.
The TOMS instrument on board the Earth Probe satellite (for further details, see http://toms.gsfc.nasa.gov/) provides data on UV-absorbing tropospheric aerosols, including dust, volcanic ash and smoke from biomass burning. Absorbing particles are determined by a differencing method, which
is more sensitive for UV-absorbing aerosols than for non-absorbing aerosols like clouds and sulfur particles (Hsu et al., 1996). Forest fires, desert dust, volcanic ash and anthro-pogenic sources all create absorbing particles, but in high-latitude regions forest fires are the main source of these par-ticles in summer.
GOME tropospheric NO2column densities are used to see whether boreal forest fires are a significant source of NOx. Spichtinger et al. (2001) have found strong enhancements of NO2 above a fire burning in Canada in 1998, but it is im-portant to clarify whether boreal forest fires can also create NO2 anomalies on a seasonal basis. The tropospheric NO2 columns are supplemented by tropospheric HCHO columns, because HCHO is a primary emission product from biomass burning (Carlier et al., 1986; Lipari et al., 1984). Maps of tropospheric NO2columns and tropospheric HCHO columns were derived from spectroscopic data from the GOME in-strument on board the ERS-2 satellite, which was launched into a polar sun-synchronous orbit in April 1995. Raw spec-tral data undergo several processing steps, as described in Beirle et al. (2003), to obtain tropospheric NO2columns. Ba-sically, differential optical absorption spectroscopy (DOAS) is used to produce total vertical NO2column densities, from which an estimate of the stratospheric portion is subtracted. HCHO slant columns are also determined from GOME spec-tra by using algorithms developed at the IUP Heidelberg, with basically the same DOAS retrieval method as used for the HCHO ground measurements (Wagner et al., 2004). In contrast to NO2, the stratospheric HCHO can be ne-glected. Thus, the retrieved slant columns directly represent
Table 4. Source-receptor relationships for boreal forest fire
emis-sions.
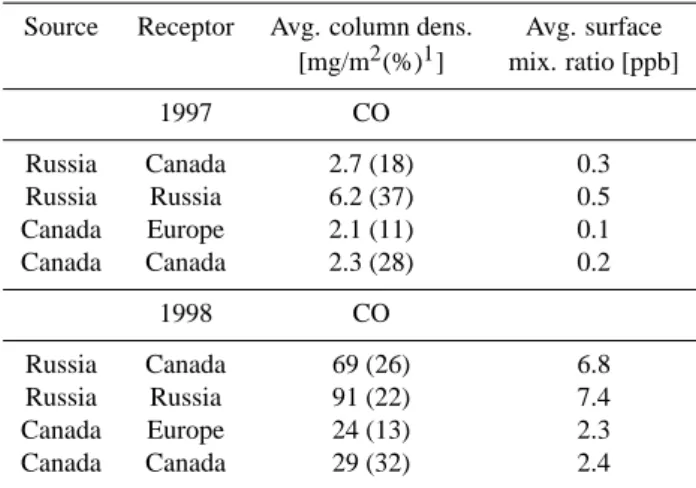
Source Receptor Avg. column dens. Avg. surface [mg/m2(%)1] mix. ratio [ppb] 1997 CO Russia Canada 2.7 (18) 0.3 Russia Russia 6.2 (37) 0.5 Canada Europe 2.1 (11) 0.1 Canada Canada 2.3 (28) 0.2 1998 CO Russia Canada 69 (26) 6.8 Russia Russia 91 (22) 7.4 Canada Europe 24 (13) 2.3 Canada Canada 29 (32) 2.4 Percentage of FLEXPART total emitted mass1.
the tropospheric HCHO. However, we applied an offset cor-rection to account for GOME degradation effects for each latitude: the slant column densities over oceans, supposed to be zero, have been subtracted to normalize the HCHO slant columns. With a ground pixel size of 40×320 km2GOME data have a global coverage at the equator every 3 days, but better time resolution in polar regions.
4 Transport Modelling
In order to evaluate the dominating transport patterns of bo-real forest fire emissions on a seasonal basis, the FLEXPART model results for the Siberian and Canadian CO tracers were averaged over the burning seasons of 1997 and 1998. Fig-ure 4 shows the total columns of the CO tracers for the Cana-dian and Siberian tracers during the burning seasons of the two years. Due to the fewer fires in 1997 simulated CO columns are lower than in 1998. In both years the largest CO tracer columns are found directly over the source re-gions, but significant transport to downwind regions occurs. The Canadian fire plume moves eastward across the Atlantic ocean towards Europe. Siberian fire emissions take a path-way eastwards across the Northern Pacific towards Canada. Taking this pathway, the fire plume also travels over north-ern Japan, where in 1998 Japanese surface CO measurements showed a maximum difference of about 30 ppb between air masses which have and those which have not passed the 1998 Siberian fires according to trajectory analyses (Kato et al., 2002). Additionally, Tanimoto et al. (2000) found baseline enhancements and episodic high concentrations of CO at the measurement site of Rishiri, Japan, during the boreal burn-ing season of 1998. To estimate the extent of interconti-nental transport of the forest fire emissions, the relative CO tracer amounts remaining close to the source and reaching
another continent were calculated by defining three boxes for the latitude band 40◦–80◦N: Canada (160◦–60◦W), Europe (10◦W–60◦E) and Siberia (60◦–140◦E) (see Fig. 4a). As shown in Table 4, a larger fraction of the Russian forest fire emissions was transported to Canada in 1998 than in 1997. This is due to the special meteorological situation during the burning season of 1998, when the abnormally persistent high pressure system east of Siberia (Efremov and Sheshukov, 2000) channeled pollution across the northern Pacific. In 1998, the average column densities of the Siberian tracer are more than twice as high as the Canadian tracer columns in the Canadian receptor box. At the surface in the Canadian recep-tor box the Siberian tracer mixing ratio is 6.8 ppb on average (see Table 4 and Fig. 6). Especially at the Canadian west coast, transport from Siberia provided the dominant fraction of the CO tracer (Fig. 4d).
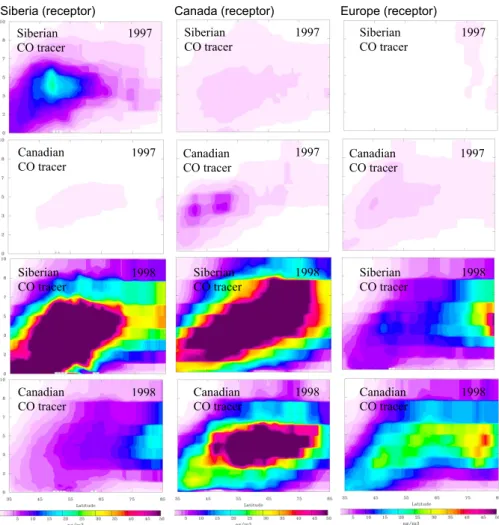
The Canadian CO tracer was transported to similar frac-tions in both years. But, at the surface the Canadian tracer plume is shifted to the south compared to the total columns (Figs. 6 and 4b), due to the prevailing low-level flows in sub-tropical latitudes, as compared to the frontal lifting that typ-ically accompanies poleward transport (Stohl, 2001). Cana-dian forest fire emissions contributed 2.3 ppb of CO to the average European CO surface mixing ratios in 1998. These intercontinental transport processes are documented in more detail in Fig. 5. Meridionally oriented vertical cross sections of zonal means of the forest fire CO tracers for each of the above defined boxes are shown for 1997 and 1998. In all re-ceptor boxes the maxima of all tracers appear at an altitude range from about 2 to 6 km. The highest concentrations of the Siberian tracer over the source region are found at lati-tudes up to 70◦N in both years. Over Canada the Siberian plume is, on average, found at higher altitudes than over the Siberian source region. The Canadian tracer extends to higher latitudes over the source, in 1998 it reached 80◦N. Significant differences in the plume positions over Europe are found between the two years. Both tracers arrive at higher latitudes in 1998 than in 1997, which is due to a higher NAO index in 1998 than in 1997, which shifts the North Atlantic stormtrack and, thus, the dominant transport pathway to the north (Eckhardt et al., 2003). In general, drought conditions in parts of the boreal region, which were likely induced by ENSO, caused extensive burning in 1998 with a maximum in the far east of Siberia near the coast of the Okhotsk Sea. From there the emissions are directly subjected to the west-erly flow. This is in contrast to 1997, when the hot spots were situated much more westerly in continental regions of Siberia. Furthermore, transport pathways are shifted north-wards according to the positive phase of NAO. This produces a shift of the tracer distribution towards higher latitudes in 1998 compared to 1997.
Siberia (receptor) Canada (receptor) Europe (receptor) Siberian
CO tracer 1997 Siberian CO tracer 1997 Siberian CO tracer 1997 Canadian CO tracer 1997 1997 Canadian CO tracer Canadian CO tracer 1997 Siberian CO tracer Siberian CO tracer Siberian CO tracer 1998 1998 1998 Canadian CO tracer Canadian CO tracer Canadian CO tracer 1998 1998 1998
Fig. 5. Vertical cross sections of zonal means of the averaged CO tracer concentrations for the three receptor regions (see Fig.4). Siberia
(left column), Canada (middle column) and Europe (right column). The rows from top to bottom show the Siberian CO tracer in 1997, the Canadian CO tracer in 1997, the Siberian CO tracer in 1998 and the Canadian CO tracer in 1998 against altitude [km].
Fig. 6. FLEXPART mixing ratios at the lowest model layer in 1998; Canadian CO tracer (top), Siberian CO tracer (bottom); CMDL stations
Fig. 7. Seasonal variation of the detrended anomalies [ppm] of CO2
averaged over all CMDL stations north of 35◦N.
Fig. 8. Seasonal variation of the detrended anomalies (ppb) of CO
averaged over all CMDL stations north of 35◦N; the dark red rect-angle reflects the burning season from May to October, which is shown in Fig. 9
5 Ground Based Measurements and Satellite Remote Sensing Results for the Burning Seasons 1997 and 1998
Around 90% of carbonaceous emissions from forest fires are CO2. Ground based measurements of CO2and CO are avail-able continuously since 1982 and 1990, respectively, from the CMDL flask network. To find a signal from the boreal forest fires in these data, monthly means were calculated for all stations located north of 35◦N. CO2concentrations are increasing due to continuing anthropogenic CO2emissions, whereas CO concentrations are decreasing, because of re-duced anthropogenic CO emissions (Wotawa et al., 2001; Novelli et al., 2003). In order to remove these trends, the monthly mean CO2and CO data were detrended using a lin-ear regression function. Monthly anomalies of the detrended
Fig. 9. Monthly mean FLEXPART CO tracer mixing ratios
aver-aged for the positions of the CMDL stations.
CMDL data for both species for the years 1996 to 1999 are shown in Fig. 7 and 8. In 1997 the CO2 anomalies were negative during most of the year, indicating less than nor-mal fire activity. In contrast, in 1998 they increased rapidly from May on, when the burning season started. The CO2 anomaly peaked at 1.2 ppm in September, after the strongest burning was over. But because of the long lifetime (much longer than 1 year (Seinfeld and Pandis, 1998)) of CO2, the CO2anomalies remained elevated until April 1999, when the CO2pulse from the fires was sufficiently diluted by mixing into the tropics and the southern hemisphere. Furthermore, because of increased soil temperatures the flux of CO2 and other trace gases out of the soils may persist even after the fires are extinguished (Kim and Tanaka, 2003).
Because of the shorter lifetime of CO (30 to 90 days) com-pared to CO2, monthly CO anomalies for 1998 give a slightly different picture (Fig. 8), tracking the temporal variations of the burning more closely. There is a first peak in the CO anomalies in May 1998, followed by a slight decrease in June and July burned, and a sharp increase into September and Oc-tober, caused by the strong boreal burning from the middle of July until October. After negative CO anomalies during most of the 1997 burning season, CO started increasing in September 1997 when strong burning in Southeast Asia oc-curred. The positive CO anomaly in May 1998, was likely to be caused by northward transport of emissions from the subtropics. For instance, Van der Werf et al. (2004) assume a contribution of tropical fires to boreal CO amounts of around 26%. In October, the CO anomaly was 44 ppb, a substan-tial fraction of the detrended CO value of around 115 ppb for that month. This indicates that forest fires were a ma-jor contributor to the CO budget in the summer of 1998, in agreement with previous studies (Wotawa et al., 2001; Nov-elli et al., 2003). In contrast, CO anomalies for the summer of 1997 were all negative, most strongly at the end of the burning season in September.
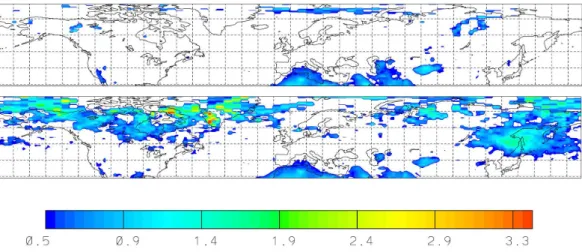
Fig. 10. TOMS aerosol index averaged from May to October 1997 (top) and 1998 (bottom). To compare the model results with the CO measurements,
modelled monthly mean surface layer CO mixing ratios were averaged for the locations of the CMDL stations marked in Fig. 6. The sum of the surface CO tracers for both sources, Canada and Siberia are shown in Fig. 9 (the simulation was started with the estimated emissions shown in Table 3). FLEXPART CO tracers give a similar picture as the CMDL CO measurements (Fig. 8), with a strong increase starting in July 1998 and extremely low CO mixing ratios in 1997. The FLEXPART simulation shows the maximum CO enhance-ment of 33 ppb (above the background) already in September 1998, one month earlier than the measurements. This may be due to the rather short 60-day lifetime we have assumed in our simulations. The maximum would be delayed by using a longer lifetime or a seasonally increasing lifetime. Further-more, as mentioned previously, CO emissions may persist even after the above-ground fires are extinguished and no hot spots are detected anymore. Such continuing emissions are not accounted for in our simulations. However, the compari-son between Fig. 8 and 9 shows that the assumed emissions and their seasonal variation is in good general agreement. The underestimation of the CO measurement data by the FLEXPART model simulation amounts around 25%, which is comparable to the contribution of tropical fire emissions to boreal CO concentrations, mentioned by Van der Werf et al. (2004). Figure 10 shows the average TOMS AI for the burning seasons of 1997 and 1998, respectively. In both years the enhancements due to Saharan dust can be seen at low latitudes. During 1997 there are relatively few enhance-ments of the AI over the boreal region. In contrast, in 1998 a large maximum over Canada and the neighbouring oceanic regions and a further maximum over eastern Siberia and the bordering Pacific are found. The maxima over Canada and Siberia are in magnitude comparable to the extended biomass burning regions of Central Africa. The areas of enhanced AI spread in a wavely band over Canada, are more concentrated over eastern Siberia and join over the northern Pacific
re-gion. On the one hand TOMS measurements show the broad region affected by the aerosols emitted from the fires of 1998 and on the other hand aerosols detected over the oceans give a clear proof for atmospheric transport of fire emissions. The general patterns confirm the model simulations (Fig. 4).
Figure 11 shows maps of tropospheric NO2 and HCHO columns derived from GOME, (averaged from July to Au-gust) for 1997 and 1998. Beside the high values over the in-dustrial regions of USA, Europe, Middle East and Asia, rela-tively large enhancements can be seen over Southeast Siberia in 1998 compared to 1997, when the burning was most in-tense (see circle in Fig. 11). The enhanced biomass burn-ing over southeast Siberia in 1998 can also be well identified and correlated with a high HCHO plume. The high HCHO columns over eastern USA are due to biogenic isoprene emis-sions (Chance et al., 2000). In consideration of the variance of forest fire emissions in contrast to the continuity of an-thropogenic NO2emissions, the GOME signal over Eastern Siberia reveals the strength of this emission source in 1998. Although NO2enhancements over fires are occasionally also seen over Canada (compare Spichtinger et al., 2001), on a seasonal basis the enhancements are far less pronounced than over Siberia. This is probably due to the smaller areas burned and the more widespread distribution of fires in Canada (see Fig. 3).
6 Summary and conclusions
In this study we compared the boreal burning seasons of 1997 and 1998. According to burned area statistics fire ac-tivity was relatively low and atmospheric effects were mod-erate in 1997 compared to 1998. In 1998 the boreal re-gion, particularly in Canada and southeastern Siberia, suf-fered from a severe drought and high temperatures, both of which favoured the occurrence of forest fires. Temperature anomalies up to 4.5 K above the climatological average were found in the regions where most of the burning occurred.
a)
b)
c)
d)
Fig. 11. GOME tropospheric NO2[1015molecules/cm2] and HCHO [1016molecules/cm2] columns averaged from July to August 1997 (a
for NO2and c for HCHO) and 1998 (b for NO2and d for HCHO). The red circle marks enhanced NO2and HCHO columns over eastern
Siberia where the strongest fire activity occurred in 1998.
These anomalies were likely a consequence of the strong ENSO event of 1997/1998. We simulated the atmospheric transport of the emissions from the burning during the fire seasons of 1997 and 1998 with a Lagrangian transport model using CO as a tracer. Forest fire emissions were released at the ATSR hot spot locations. To quantify the transport of the forest fire emissions the modelled fire plumes were split into a Canadian, a European and a Siberian sector. FLEX-PART results were compared to measurement data of CO2 and CO. The influence of burning on these two species can be seen in surface measurements of the CMDL flask sam-pling network. Strong positive anomalies of both species in 1998 are in contrast to negative anomalies in 1997. Forest fires emit large amounts of aerosols which are detected by TOMS AI. The signal of the GOME instrument measuring tropospheric NO2and HCHO columns is not as clear as the TOMS one, but there is enhanced NO2and HCHO over the strongest burning region of Southeast Siberia.
The main conclusions of this study are:
– The transport simulation shows intercontinental
trans-port of CO emitted by forest fires. Likely induced by ENSO, in 1998 a larger fraction of forest fire CO was transported from Siberia towards Canada, contributing more than twice as high concentrations as Canada’s own biomass burning CO. In 1998 both tracers arrived at higher latitudes over Europe than in 1997, consistent with a higher NAO index in 1998.
– The interannual variability of fire activity in the boreal
region could clearly be seen in ground based measure-ments of CO and CO2as well as in satellite data of the TOMS and the GOME instruments.
– Monthly variations of CMDL CO data are reproduced
by the FLEXPART model simulation. The maximum anomaly of the CO measurements was 44 ppb in Oc-tober 1998, the maximum CO mixing ratio calculated with FLEXPART for the lowest model layer was 33 ppb in September 1998. The delay of the maximum is at-tributed to the relatively short lifetime of CO (60 days) which was used for the FLEXPART setup.
– TOMS data show expanded maxima over Eastern
Siberia and Canada. The aerosol clouds swap from the source regions across the oceans to the neighbouring continents, what reflects transport processes of aerosols, which look very similar than tracer plumes simulated by FLEXPART.
– GOME data show relatively large NO2and HCHO en-hancements over the burning regions of eastern Siberia in 1998, but no distinct maximum over the Canadian fire regions which were dispersed over a wider latitude range.
– Model simulations and measurement data revealed a
strong impact of boreal forest fire emissions on the at-mospheric composition of the northern higher latitudes in 1998.
Acknowledgements. This study was funded by the German Min-istry for Education and Research as part of the NOXTRAM project (Atmospheric Research 2000) and the PARTS Project. We thank the Deutscher Wetterdienst for kindly providing access to ECMWF and GPCC data. We appreciate the provision of data via the internet by NASA/GSFC and ATSR World Fire Atlas.
Edited by: D. Grainger
References
Amiro, B. D., Todd, J. B., Wotton, B. M., Logan, K. A., Flannigan, M. D., Stocks, B. J., Mason, J. A., Martell, D. L., and Hirsch, K. G.: Direct carbon emissions from Canadian forest fires, 1959– 1999, Can. J. Forest Res., 31, 512–525, 2001.
Andreae, M. O., Artaxo, P., Fischer, H., Freitas, S. R., Gr´egoire, J.-M., Hansel, A., Hoor, P., Kormann, R., Krejci, R., Lange, L., Lelieveld, J., Lindinger, W., Longo, K., Peters, W., de Reus, M., Scheeren, B., Silva Dias, M. A. F., Str¨om, J., van Velthoven, P. F. J., and Williams, J.: Transport of biomass burning smoke to the upper troposphere by deep convection in the equatorial region, Geophys. Res. Lett., 28, 951–954, 2001.
Andreae, M. O. and Merlet, P.: Emission of trace gases and aerosols from biomass burning, Global Biogeochem. Cyc., 15, 955–966, 2001.
Asakuma, K., Kuze, H., Takeuchi, N., and Yahagi, T.: Detection of biomass burning smoke in satellite images using texture analysis, Atmos. Env., 36, 1531–1542, 2002.
Beirle, S., Platt, U., Wenig, M., and Wagner, T.: Weekly cycle of NO2 by GOME measurements: a signature of anthropogenic sources, Atmos. Chem. Phys., 3, 2225–2232, 2003
Cahoon Jr., D. R., Stocks, B. J., Levine, J. S., Cofer III, W. R., and Pierson, J.: Satellite analysis of the severe 1987 forest fires in northern China and southeastern Siberia, J. Geophys. Res., 99, 18 627–18 638, 1994.
Carlier, P., Hannachi, H., and Mouvier, G.: The chemistry of car-bonyl compounds in the atmosphere, Atmos. Env., 20, 2079– 2099, 1986.
Chance, K., Palmer, P. I., Spurr, R. J. D., Martin, R. V., Kurosu, T. P., and Jacob, D. J.: Satellite observations of formaldehyde over North America from GOM, Geophys. Res. Lett., 27, 3461–3464, 2000.
Chan, C. Y., Chan, L. Y., Harris, J. M., Oltmans, S. J., Blake, D. R., Qin, Y., Zheng, Y. G., and Zheng, X. D.: Char-acteristics of biomass burning emission sources, transport, and chemical speciation in enhanced springtime tropospheric ozone profile over Hong Kong, J. Geophys. Res., 108, 4015, doi:10.1029/2001JD001555, 2003.
Cofer III, W. R., Winstead, E. L., Stocks, B. J., Goldammer, J. G., and Cahoon, D. R.: Crown fire emissions of CO2, CO, H2, CH4, and TNMHC from a dense jack pine boreal forest fire, Geophys. Res. Lett., 25, 3919–3922, 1998.
Conard, S. G. and Ivanova, G. A.: Wildfire in Russian boreal forests–potential impacts on fire regime characteristics on emis-sions and global carbon balance estimates, Env. Pollut., 98, 305– 313, 1997.
Conard, S. G., Sukhinin, A. I., Stocks, B. J., Cahoon, D. R., Davi-denko, E. P., and Ivanova, G. A.: Determining effects of area
burned and fire severity on carbon cycling and emissions in Siberia, Clim. Cange, 55, 197–211, 2002.
Crutzen, P. J. and Merlet, A.: Biomass burning in the Tropics: Im-pact on atmospheric chemistry and biogeochemical cycles, Sci-ence, 250, 1669–1678, 1990.
Duncan, B. N., Randall, M. V., Staudt, A. C., Yevich, R., and Logan, J. A.: Interannual and seasonal variability of biomass burning emissions constrained by satellite observations, J. Geophys. Res., 108, 4100, doi:10.1029/2002JD002378 2003.
Eckhardt, S., Stohl, A., Beirle, S., Spichtinger, N., James, P., Forster, C., Junker, C., Wagner, T., Platt, U., and Jennings, S. G.: The North Atlantic Oscillation controls air pollution transport to the Arctic, Atmos. Chem. Phys., 3, 1769–1778, 2003.
Efremov, D. F. and Sheshukov, M. A.: Ecological and economic evaluation of the consequences of catastrophic fires in the Rus-sian Far East: The Khabarovsk Territory Example of 1998, IFFN, 22, 53–62, 2000.
ECMWF: User Guide to ECMWF Products 2.1, Meteorological Bulletin M3.2, ECMWF, Reading, UK, 1995.
Flannigan, M. D., Bergeron, Y., Engelmark, O., and Wotton, B. M.: Future wildfire in circumboreal forests in relation to global warming, J. Vegetation Sci., 9, 469–476, 1998
Forster, C., Wandinger, U., Wotawa, G., James, P., Mattis, I., Althausen, D., Simmonds, P., O’Doherty, S., Jennings, S. G., Kleefeld, C., Schneider, J., Trickl, T., Kreipl, S., J¨ager, H., and Stohl, A.: Transport of boreal forest fire emissions from Canada to Europe, J. Geophys. Res., 106, 22 887–22 906, 2001. French, N. H. F., Kasischke, E. S., and Williams, D. G.:
Vari-ability in the emission of carbon-based trace gases from wild-fire in the Alaskan boreal forest, J. Geophys. Res., 108, 8151, doi:10.1029/2001JD000480, 2003.
Fromm, M., Alfred, J., Hoppel, K., Hornstein, J., Bevilacqua, R., Shettle, E., Servranckx, R., Li, Z., and Stocks, B.: Observa-tions of boreal forest fire smoke in the stratosphere by POAM III, SAGE II, and lidar in 1998, Geophys. Res. Lett., 27, 1407– 1410, 2000.
Fromm, M. and Servranckx, R.: Transport of forest fire smoke above the tropopause by supercell convection, Geophys. Res. Lett, 1542, doi:10.1029/2002GL016820, 2003.
Galanter, M., Levy II, H., and Carmichael, G. R.: Impacts of biomass burning on tropospheric CO,NOx,and O3, J. Geophys.
Res., 105, 6633–6653, 2000.
Generoso, S., Breon, F.-M., Balkanski, Y., Boucher, O., and Schulz, M.: Improving the seasonal cycle and interannual variations of biomass burning aerosol sources, Atmos. Chem. Phys., 3, 1211– 1222, 2003.
Guzzi, R., Ballista, G., Di Nicolantonio, W., and Carboni, E.: Aerosol maps from GOME data, Atmos. Env., 35, 5079–5091, 2001.
Holloway, T., Levy II, H., and Kasibhatla, P.: Global distribution of carbon monoxide, J. Geophys. Res., 105, 12 123–12 147, 2000. Hsu, N. C., Herman, J. R., Bhartia, P. K., Seftor, C. J., Torres, O.,
Thompson, A. M., Gleason, J. F., Eck, T. F., and Holben, B. N.: Detection of biomass burning smoke from TOMS measurements, Geophys. Res. Lett., 23, 745–748, 1996.
Jaegle, L., Jacob, D. J., Wang, Y., Weinheimer, A. J., Ridley, B. A., Campos, T. L., Sachse, G. W., and Hagen, D. E.: Sources and chemistry of NOxin the upper troposphere over the United
Kajii, Y., Kato, S., Streets, D. G., Tsai, N. Y., Shvidenko, A., Nils-son, S., McCallum, I., Minko, N. P., Abushenko, N., Altyntsev, D., and Khodzer, T. V.: Boreal forest fires in Siberia in 1998: Es-timation of area burned and emissions of pollutants by advanced very high resolution radiometer satellite data, J. Geophys. Res., 107, 4745,doi:10.1029/2001JD001078, 2002.
Kasischke, E. S. and Bruhwiler, L. P.: Emissions of carbon dioxide, carbon monoxide, and methane from boreal forest fires in 1998, J. Geophys. Res., 108, 8146, doi:10.1029/2001JD000461, 2003. Kasischke, E. S., Hewson, J. H., Stocks, B., Van der Werf, G., and Randerson, J.: The use of ATSR active fire counts for estimating relative patterns of biomass burning – a study from the boreal forest region, Geophys. Res. Lett., 30, 1969, doi:10.1029/2003GL017859, 2003.
Kato, S., Pochanart, P., Hirokawa, J., Kajii, Y., Akimoto, H., Ozaki, Y., Obi, K., Katsuno, T., Streets, D. G., and Minko, N. P.: The influence of Siberian forest fires on carbon monoxide concentra-tions at Happo, Japan, Atmos. Env., 36, 385–390, 2002. Kim, Y. and Tanaka, N.: Effect of forest fire on the fluxes of CO2,
CH4and N2O in boreal forest soils, interior Alaska, J. Geophys.
Res., 108, 8164, doi:10.1029/2001JD000663, 2003.
Kita, K. , Fujiwara, M., and Kawakami, S.: Total ozone increases associated with forest fires over the Indonesian region and its relation to the El Ni˜no-Southern oscillation, Atmos. Env., 34, 2681–2690, 2000.
Lavoue, D. C., Liousse, C., Cachier, H., Stocks, B. J., and Goldammer, J. G.: Modelling of carbonaceous particles emitted by boreal and temperate wildfires at northern latitudes, J. Geo-phys. Res., 105, 26 871–26 890, 2000.
Lipari, F., Dasch, J. M., Scuggs, W. F.: Aldehyde emissions from wood-burning fireplaces, Env. Sci. Techn., 18, 326–330, 1984. Novelli, P. C., Masarie, K. A., Lang, P. M., Hall, B. D., Myers,
R. C., and Elkins, J. W.: Reanalysis of tropospheric CO trends: Effects of the 1997–1998 wildfires, J. Geophys. Res., 108, 4464, doi:10.1029/2002JD003031, 2003.
Randerson, J. T., Field, C. B., Fung, I. Y., and Tans, P. P.: Increases in early season ecosystem uptake explain recent changes in the seasonal cycle of atmospheric CO2 at high northern latitudes,
Geophys. Res. Lett., 26, 2765–2768, 1999.
Seinfeld, J. H. and Pandis, S. N.: Atmospheric chemistry and physics, John Wiley and Sons, Inc., New York, 1998.
Spichtinger, N., Wenig, M., James, P., Wagner, T., Platt, U., and Stohl, A.: Satellite detection of a continental-scale plume of ni-trogen oxides from boreal forest fires, Geophys. Res. Lett., 28, 4579–4582, 2001.
Stocks, B. J., Fosberg, M. A., Lynham, T. J., Mearns, L., Wotton, B. M., Yang, Q., Jin, J.-Z., Lawrence, K., Hartley, G. R., Mason, J. A., and McKenney, D. W.: Climate change and forest fire poten-tial in Russian and Canadian boreal forests, Clim. Change, 38, 1–13, 1998.
Stohl, A.: A one-year Lagrangian “climatology” of airstreams in the northern hemisphere troposphere and lowermost stratosphere, J. Geophys. Res., 106, 7263–7279, 2001.
Stohl, A., Hittenberger, M., and Wotawa, G.: Validation of the Lagrangian particle dispersion model FLEXPART against large scale tracer experiment data, Atmos. Env., 32, 4245–4264, 1998. Svidenko, A. and Goldammer, J. G.: Fire situation in Russia, IFFN,
24, 41–59, 2001.
United Nations Economic Commission for Europe: Timber Bul-letin, Forest fire statistics 1996–1998, 52, 1999.
Tanimoto, H., Kajii, Y., Hirokawa, J., Akimoto, H., and Minko, N. P.: The atmospheric impact of boreal forest fires in far eastern Siberia on the seasonal variation of carbon monoxide: observa-tions at Rishiri, a northern remote island in Japan, Geophys. Res. Lett., 27, 4073–4076, 2000.
Torres, O., Bhartia, P. K., Herman, J. R., Sinyuk, A., Ginoux, P., and Holben, B.: A long-term record of aerosol optical depth from TOMS observations and Comparison to AERONET mea-surements, J. Atmos. Sci., 59, 398–413, 2002.
Torres, O., Bhartia, P. K., Herman, J. R., Ahmad, Z., and Gleason, J.: Derivation of aerosol properties from satellite measurements of backscattered ultraviolet radiation: theoretical basis, J. Geo-phys. Res., 103, 17 099–17 110, 1998.
Van der Werf, G., Randerson, J. T., Collatz, G. J., Giglio, L., Ka-sibhatla, P. S., Arellano, A. F., Olsen, S. C., and Kasischke, E. S.: Continental-scale partitioning of fire emissions during 1997 to 2001 El Ni˜no/La Ni˜na period: Science, 303, 73–76, 2004. Wagner, T., Dix, B., Friedeburg, C. V., Frieß, U., Sanghavi, S.,
Sinreich, R., and Platt, U.: MAX-DOAS O4 measurements - a new technique to derive information on atmospheric aerosols, (I) Principles and information content, J. Geophys. Res., accepted, 2004.
Wotawa, G. and Trainer, M.: The influence of Canadian forest fires on pollutant concentrations in the United States, Science, 288, 324–328, 2000.
Wotawa, G., Novelli, P. C., Trainer, M., and Granier, C.: Inter-annual variability of summertime CO concentrations in the Northern Hemisphere explained by boreal forest fires in North America and Russia, Geophys. Res. Lett., 28, 4575–4578, 2001.

![Fig. 1. Climatological surface temperature anomaly [K] from June to August of 1997 (top) and 1998 (bottom), according to NCEP reanalysis data.](https://thumb-eu.123doks.com/thumbv2/123doknet/14774712.593108/4.892.191.699.97.340/climatological-surface-temperature-anomaly-june-august-according-reanalysis.webp)
![Fig. 4. Total columns of FLEXPART CO tracers [mg/m 2 ] averaged from May to October: (a) Canadian CO tracer (1997), (b) Canadian CO tracer (1998), (c) Siberian CO tracer (1997) and (d) Siberian CO tracer (1998)](https://thumb-eu.123doks.com/thumbv2/123doknet/14774712.593108/6.892.192.702.93.433/columns-flexpart-averaged-october-canadian-canadian-siberian-siberian.webp)
![Fig. 7. Seasonal variation of the detrended anomalies [ppm] of CO 2 averaged over all CMDL stations north of 35 ◦ N.](https://thumb-eu.123doks.com/thumbv2/123doknet/14774712.593108/9.892.472.809.94.348/seasonal-variation-detrended-anomalies-averaged-cmdl-stations-north.webp)
![Fig. 11. GOME tropospheric NO 2 [10 15 molecules/cm 2 ] and HCHO [10 16 molecules/cm 2 ] columns averaged from July to August 1997 (a for NO 2 and c for HCHO) and 1998 (b for NO 2 and d for HCHO)](https://thumb-eu.123doks.com/thumbv2/123doknet/14774712.593108/11.892.193.696.92.471/gome-tropospheric-molecules-hcho-molecules-columns-averaged-august.webp)
