HAL Id: hal-00617452
https://hal.archives-ouvertes.fr/hal-00617452
Submitted on 30 Apr 2021
HAL is a multi-disciplinary open access
archive for the deposit and dissemination of
sci-entific research documents, whether they are
pub-lished or not. The documents may come from
teaching and research institutions in France or
abroad, or from public or private research centers.
L’archive ouverte pluridisciplinaire HAL, est
destinée au dépôt et à la diffusion de documents
scientifiques de niveau recherche, publiés ou non,
émanant des établissements d’enseignement et de
recherche français ou étrangers, des laboratoires
publics ou privés.
Oman ophiolite
Adolphe Nicolas, Françoise Boudier
To cite this version:
Adolphe Nicolas, Françoise Boudier. Structure and dynamics of ridge axial melt lenses in the Oman
ophiolite. Journal of Geophysical Research, American Geophysical Union, 2011, 116, pp.B03103.
�10.1029/2010JB007934�. �hal-00617452�
Structure and dynamics of ridge axial melt lenses
in the Oman ophiolite
Adolphe Nicolas
1and Françoise Boudier
1Received 16 August 2010; revised 8 November 2010; accepted 29 December 2010; published 23 March 2011.
[1]
The Oman ophiolite is regarded as derived from a fast spreading oceanic ridge.
As in its present
‐day marine analogs, expectedly, the gabbro unit crystallized in a large
magma chamber underneath a small melt lens. In ophiolites, this melt lens is reduced
to a horizon mapped in the field, where the floor and the roof of the melt lens joined.
The magmatic activity of the former melt lens has been studied in gabbros located
below the melt lens horizon. Beneath a stable melt lens, gabbros subside and drift through
the steep walls of the magma chamber as steeply foliated gabbros. In contrast, in unstable
melt lenses more specifically considered here, flat
‐lying gabbros are exposed beneath
the lens. These gabbros were settling on the floor while the melt lens was retreating. Their
strong magmatic foliations and lineations point to a dynamic deposition on the floor,
and lineation trends record the structure of convection rolls within the lens. Time
constraints suggest a
∼100 year periodicity of melt recharge by short and powerful
melt pulses followed by a shorter time of convection activity after recharge and a longer
period of static magma settling, as recently proposed for the East Pacific Rise. At each
new melt pulse, the lens nearly doubles its volume by surface expansion, within a short
time lapse, before slowly and progressively retreating to feed crustal accretion. Large
horizontal surface inflation of the lens better explains the seawater hydration of the
accreting crust than melt lens vertical motion through the lid.
Citation: Nicolas, A., and F. Boudier (2011), Structure and dynamics of ridge axial melt lenses in the Oman ophiolite, J. Geophys. Res., 116, B03103, doi:10.1029/2010JB007934.
1.
Introduction
[2] The presence of melt lenses has been inferred at active
spreading centers of fast‐spreading ocean ridges [Morton and Sleep, 1985; Singh et al., 1999; Canales et al., 2006] from vertical seismic reflection studies. The bright reflector located between 1 and 3 km below seafloor at the ridge axis resulting from a sharp drop in seismic velocities was inter-preted as the roof of a largely molten layer. This reflector was 1–2 km wide, with extreme values between 4500 and 250 m [Kent et al., 1993, 1994]. The thickness of the melt lens is generally on the order of 100 m [Canales et al., 2006] or less [Hussenoeder et al., 1996; Collier and Singh, 1997]. Along strike, brightness of melt lenses varies on seismic images. The brighter zones, interpreted as being liquid, containing less than 30%–40% crystals in suspension, seem to extend over 2–4 km, being separated by more mushy layers (60%–70% crystals) extending over 15–20 km [Singh et al., 1998; Canales et al., 2006].
[3] Melt lenses or melt sills are also called subaxial
magma chambers or axial magma chambers (AMCs). They are perched above a large prismatic domain sitting on the Moho, filled with a magmatic gabbro mush first described
by Harding et al. [1989], and named low‐velocity zone (LVZ), crystal mush zone, or mush zone. In ophiolites, this domain was traditionally called the magma chamber, and its physical properties are those of a thick magmatically deforming crystal mush [Nicolas and Ildefonse, 1996] with a melt content that might be as low as 10%–20% due to its anisotropic distribution [Lamoureux et al., 1999]. To avoid any confusion, the AMC of the marine community is named here“melt lens,” and the underlying large LVZ down to the Moho, the“magma chamber.”
[4] Since the Oman ophiolite has all components of a fast,
possibly superfast, spreading oceanic ridge system [Nicolas et al., 2000], it was legitimate to look for fossil traces of a melt lens at the top of the gabbro unit that crystallized from the large underlying magma chamber. This quest has been successful. The structure and dynamics of melt lenses in this ophiolite are investigated here building on recent high‐ resolution studies. A major result of the first of these studies, dealing otherwise with the root zone of the sheeted dike complex (RZSDC), has been to identify precisely where, in a vertical cross section through the gabbro unit, the now frozen melt lens was located at the oceanic ridge axis of origin (Figure 1) [Nicolas et al., 2008]. The second and the third of these high‐resolution studies considered the domi-nant situation met in the field where the gabbro mush deposited on the melt floor subsides before exiting from the magma chamber as steeply foliated gabbros. In the second
1
Géosciences, Université de Montpellier II, Montpellier, France. Copyright 2011 by the American Geophysical Union.
study, it was shown how the steep upper gabbros of the crustal gabbro unit resulted from subsidence within the magma chamber [Nicolas et al., 2009], and in the third study, it was shown how cross sections in these gabbros, associated with anorthosite swarms, have registered data on the structure and internal activity of stable melt lenses [Boudier and Nicolas, 2011]. Complementing this last study, the present contribution focuses on situations where the gabbros from the floor of the melt lens have not subsided and remained horizontal. This less common situation is ascribed to instability in melt lens activity. The floor of this lens is now exposed in the field because the lens had been shrinking, eventually dying near its ridge axis. This situation exposes gabbros in which processes specific to the lens activity, such as convection currents or crystal settling on the lens floor, have not been obliterated by subsequent defor-mation related to subsidence. Incorporating the results of the preceding study will be conducted here to compare situations of stable and unstable melt lenses, the latter ulti-mately leading to melt lens freezing. These new results introduce a discussion with the remarkably complementary marine data acquired at the East Pacific Rise (EPR).
2.
Previous Results and Methodology
[5] Before proceeding, it may be useful to recall that in
ophiolites, now pieces of oceanic lithosphere having drifted away from the ridge of origin, the axial melt lens has closed, within hundreds of meters from the ridge axis, roof, and floor now coinciding as illustrated in Figure 1. Figure 1 is extracted from the first high‐resolution study evoked above to show how the horizon of the former melt lens has been identified in the Oman ophiolite. It is at the base of the RZSDC, itself 100 m thick beneath its transition to the sheeted dike complex. In most sites visited in Oman (see below; Figures 2, 3a, and 3c), this horizon is a remark-able discordance between the base of the RZSDC and very
steep, foliated gabbros and anorthosite layers, the latter being never observed above in the RZSDC. This discor-dance may have been missed in the past because, within the first 10 m beneath the floor of the former melt lens, the gabbro foliation is weaker [Nicolas et al., 2009]. In the less common situations described here, there is no discordance, and the gabbro foliation is parallel to the base of the RZSDC (Figure 3b). The foliation in all gabbros beneath the melt lens floor at ridge axis is magmatic, related to subsidence and magmatic flow within the magma chamber [Nicolas and Ildefonse, 1996]. Once gabbros have drifted outside the magma chamber and cooled, this foliation is preserved, exceptionally blurred by low‐temperature shears.
[6] Looking back at the results of the systematic structural
mapping of the Oman ophiolite based on 6000 field stations [Nicolas et al., 2000], it has been possible to retrieve 133 stations where the precise transition from RZSDC to upper-most gabbros is exposed, interpreted as the very level of the former melt lens (Figure 2). Their data complement and extend to the entire belt those related to the new traverses specifically considered here and by Nicolas et al. [2009] that are mainly located in the southern massifs. Altogether, 185 sites have been analyzed for the structural relationships of foliation and lineation in the foliated gabbros with the sheeted dike plane assumed to represent the paleoridge ori-entation. From these relationships, three classes are defined (Figure 3).
[7] In the first class, foliated gabbros are steep and parallel
within 30° to the local sheeted dike complex. This class corresponds to 47% of the 185 stations. Lineations that point to magmatic flow directions plunge, on average, 50° (Figure 3a). This class was specially considered in the two preceding studies, because it deals with subsidence and with the common situation of a stable melt lens. The two other classes yield information on instabilities and dynamics of melt lenses. The second class, representing 22% of the Figure 1. The fossil trace of the melt lens horizon in the Oman ophiolite is commonly a discordance
between isotropic gabbros from the root zone of the sheeted dike complex (RZSDC) and steep foliated gabbros from the top of the gabbro unit. A general sketch of the RZSDC cross section as exemplified at Wadi Gaz [Nicolas et al., 2008]. LT, low temperature.
sites, is specifically considered here because its flat‐lying foliations are interpreted as the floor of the melt lens. Car-ried by these flat‐lying foliations, lineation azimuths are variable with (Figure 3b) 17/41 lineations within 20° to the sheeted dikes. The third class (Figure 3c), with steep foliations trending at higher angles than 30° to the sheeted dikes, represents 31% of the sites and is ignored here. The obliquity between sheeted dikes and steep gabbro foliation could relate to propagating segments where it is
commonly observed. This situation mainly occurs in north-ern Oman ophiolites.
3.
Field Data
[8] Contrasting with the dominant situation of subsidence
from a melt lens, the present study focuses on situations in which the gabbros from the floor of the melt lens have not subsided and remained horizontal or flat lying (Figures 3b, Figure 2. Structural map in the Oman ophiolite massifs, with the locations of the 133 sites (triangles)
showing the precise transition from RZSDC to uppermost gabbros, of the recent detailed traverses (stars) and of the small mapped areas (rectangles) in Nakhl and Jabal Dimh. The traverses range from the sheeted dikes to the upper gabbros over 1–2 km, and the map covers a similar domain. The axes of propagat-ing rifts (dotted arrows), includpropagat-ing the abandoned one in Nakhl studied here, are derived from Nicolas et al. [2000].
4a, and 4b). In the field, they are generally gently dipping east, the common dip of the ophiolite. The difference with the sketch of Figure 1, where the foliated gabbros are steep, is not critical to locate the horizon of the former melt lens. It remains the limit between isotropic and foliated gabbros, with anorthosites strictly confined to the latter.
[9] Three reconnaissance traverses have been conducted
in the central massifs, and two have been conducted in the western part of Wadi Tayin massif. The main results are derived from a high‐resolution map drawn in the Nakhl massif (Figure 5). In these new traverses and in the map, foliations in the uppermost foliated gabbros are parallel to the RZSDC horizon and thus flat or moderately dipping (Figure 4a). Moving down the section, foliations progres-sively rotate and steepen within a vertical distance of a few hundred meters. In all sections, the flat‐lying foliated gabbros are homogeneous and well foliated, with a visible lineation, except locally in areas where they have been molten by hydrous anatexis and recrystallized as coarse grained hydrous gabbros, following seawater ingression near the walls of the magma chamber (Figure 4e) [Bosch et al., 2004]. Less commonly, the foliated gabbros are intruded by wehrlites and trondjhemites. These foliated gabbros are poorly layered, mostly by anorthosite lenses (Figures 4b and 4c) or a few microgabbro lenses and, locally, layers of unusually coarser‐ grained gabbros (Figure 4d).
3.1. New Map in Nakhl Massif
[10] In the Nakhl map and cross sections (Figures 5 and 6),
the transition from the isotropic, ophitic gabbros of the RZSDC located north of the map to flat‐lying foliated and granular gabbros with lenses of anorthosites is as sharp as in the steep gabbros of Figure 1. Moving southward away from the RZSDC, the foliation remains flat lying over hundreds of meters before steepening progressively to becoming nearly vertical in a central graben. Approaching this graben, foliations and lineations become also weaker, and the nature of gabbros is locally obscured by the copious
recrystallization into hydrous gabbros (Figure 4e), erasing all preceding structures. This hydrous activity occurs at temperatures around 1100°C [Koepke et al., 2005], and it has been extensively studied in Oman RZSDC [Nicolas et al., 2008].
[11] In contrast to the northern domain, foliation tends to
vanish in the graben, and the distinction with RZSDC gabbros becomes difficult. It relies mainly on the textures that are ophitic in RZSDC gabbros versus granular in the gabbros below [Nicolas et al., 2009]. Unfortunately for identification of rock facies in the graben vicinity, anor-thosite layers that are exclusively present in the granular gabbros also tend to vanish compared to external areas. When approaching the central graben, foliations are steeper, turning into disordered and commonly flat‐lying ones in the center of the graben. RZSDC and sheeted dike formations that have subsided invade the center. They are locally enriched by trondjhemite intrusions and altered by the copious hydrous alteration of gabbros. A normal fault has been locally mapped in the field at the graben northern limit with flat‐lying foliated gabbros. This fault has possibly been lubricated by injection of trondjhemites, extending in a small massif next to the fault. Elsewhere, the fault limit-ing the graben is only located in the map by followlimit-ing the boundary between formations and appearance of steeper and more disordered foliations in gabbros. The graben is∼500 m wide, extending parallel to the sheeted dikes and its western tip, extrapolated in the map in Figure 5, and seems to penetrate in upper gabbros displaying the NW‐SE and steep regional foliation.
[12] In areas of the map close to the northern RZSDC, the
flat and very strong foliation in the gabbros bears a mineral lineation trending dominantly NW‐SE, parallel to the trend in the sheeted dike complex. When approaching the central graben, lineations rotate to N‐S and, as the foliations, they tend to vanish in the graben. Few shear sense indicators from both the northern and southern side of the graben confirm the magmatic subsidence toward to its center. Figure 3. The three main orientations of foliations (dashed lines) and lineations (arrows), referred to a vertical sheeted dike (SD) complex in the gabbros that is located just beneath the base of the RZSDC (floor of former melt). (a) Foliation S is parallel to sheeted dikes, and lineation is plunging. (b) Foliation is horizontal, and lineation, on average, is at an angle to the sheeted dikes. (c) Foliation is vertical at a large angle to sheeted dikes. Only situations in Figures 3a and 3b are considered here.
3.2. Flat‐Lying Foliated Gabbros and Anorthosites [13] In contrast to the vicinity of the central graben, where
the magmatic deformations tend to vanish, near their northern margin with the RZSDC and immediately below, both the flat‐lying foliations (Figure 4a) and lineations in gran-ular gabbros are strong. This is illustrated by thin sections (Figure 7) and stereonets of lattice preferred orientations (LPOs) (Figure 8).
[14] The foliation in the flat‐lying gabbros is locally
underlined by a few layers of coarser‐grained gabbros (Figure 4d). In thin sections, the plagioclase laths are usually ∼1–2 mm long, thin, and tightly twinned (Figure 7a), as in the shallow steep gabbros. The coarser layers display much
larger (2–4 mm) and thicker rectangular tablets of plagio-clase with fewer growth twins and no zoning (Figure 7b), suggesting a larger recovery. Clinopyroxene is also larger and more granular in these coarser layers. Fine‐grained layers of gabbros, by place, display a few large plagioclase tablets embedded into the foliation, a feature also observed in the steep gabbros, even from deeper horizons in the gabbro unit.
[15] In thin sections, the flat‐lying gabbros are generally
well recovered with only reduced zoning in plagioclase laths and a larger spacing between twins than in the case of the topmost steep gabbros that are sharply discordant beneath the RZSDC [Nicolas et al., 2009]. At a depth of a few meters, where the foliation is only nascent, the fat and pure anorthosites contain large oikocrysts of clinopyroxene and of ilmenite‐magnetite in which fairly large plagioclase tablets and idiomorphic olivine grains are present and commonly foliated parallel to the surrounding anorthosite (Figures 7c and 7d). In Figures 7c and 7d, the plagioclase tablets included are smaller than in the matrix, pointing to clinopyroxene oikocryst early growth during the folia-tion development. In Figure 7d, the oikocryst was a rigid object that was rotated during a dextral shear motion. Tens of meters beneath the RZSDC, fat and steep anorthosite layers are nearly pure plagioclase displaying extremely well‐ oriented laths (see section 4) with only traces of interstitial clinopyroxene, ilmenite, and magnetite.
[16] The evolution of foliations and lattice preferred
orientations has been studied at this shallowest level in the gabbro unit [Morales et al., 2011]. Plagioclase LPO evolves sharply from weak (J index of 2.55) at the level of the floor of the melt lens to very strong (J index of 11.91) at a structural depth of only∼10 m beneath this level (Figure 8). Interestingly, this depth is where foliation and lineation also strengthen during the first stages of subsidence in domains of steeply foliated gabbros. These plagioclase LPOs are typically magmatic fabrics, with the flattening plane (010)pldefining the foliation plane. The pole figure index (pfJ)
that quantifies the strength of individual crystallographic axis preferred orientation indicates that the sharp increase concerns mainly (010), the flattening plane of plagioclase.
[17] The ubiquitous anorthosite layering is the main
het-erogeneity observed within otherwise largely homogeneous upper foliated gabbros. Anorthosites are observed in both flat‐lying and steep foliated gabbros. In the latter, they have been studied in detail as carrying measurable information on melt lenses activity (see Appendix A). When they are flat lying and interpreted as the floor of the melt lens, they provide direct information on crystal settling onto the floor of the lens.
[18] In the field and confirmed in thin sections, there is a
grain size contrast between fat and pure anorthosite layers and surrounding anorthositic gabbro lenses. Both have a strong foliation defined by elongated tablets of plagioclase closely oriented, but statistical counts on the average dimen-sions of plagioclase tablets show that in 24 specimens of thin anorthosites, the average length is 1.95 mm with a standard deviation of 0.93, whereas in 12 specimens of fat anortho-sites, average length is 1.3 mm with a standard deviation of 0.55. This smaller standard deviation in fat anorthosites reflects their grain size homogeneity, contrasting with thin Figure 4. Structures in horizontally foliated gabbros.
(a) Horizontal lens floor in anorthositic gabbros (East Nakhl). (b) Meter thick anorthosite layer moderately dipping in a foli-ated gabbro (Nassif in Wadi Tayin massif). (c) Mildly deformed gabbro‐anorthosite layering (near the central gra-ben, East Nakhl). (d) Layering marked by grain size varia-tions with a coarse‐grained layer overlying a fine‐grained one (Al Khood section). (e) Close view of a poikilitic anor-thosite in a poorly foliated recrystallized hydrous gabbro (near the central graben, East Nakhl). The scale bar is 10 cm (Figures 4c and 4d) and 3 cm (Figure 4e).
Figure
Figure 6. Cross sections located in the map in Figure 5, where they are traced from NW to SE. They show the gabbro foliations flat and parallel to the RZSDC to the NE, progressively steepening approaching the central graben, with a reverse dip on its southern side. To help interpreting these field cross sections, they have been rotated backward, from their present‐day ∼15°NE dip to the horizontal, and they are extrapolated in faded tunes. Because of the NE tilt, the gabbros exposed to the south of the graben are deeper in the gabbro unit. Consequently, their attitude does not relate any longer to melt lens activity. Same legend as in Figure 5. No vertical exaggeration.
Figure 5. Map in the eastern part of the Nakhl massif (location in Figure 2) illustrating the progressive rotations of gabbro foliations, from flat lying to the north toward a central graben limited by dashed lines between <45° and >45° foliations dips. The RZSDC and the sheeted dike complex reappear within the graben. Lineations trending NW‐SE in flat gabbros rotate N‐S approaching the graben where they trend normal to its axis (lineation trajectories drawn in Figure 10b). Lines A, B, and C are traces of the cross sections in Figure 6.
anorthosites where a duality of grain size is observed with a dominant 1.3 mm grain size and a variable fraction of∼3 mm grains like in the gabbro in Figure 7b.
4.
Discussion
4.1. Convection Within the Melt Lens
[19] From marine data, melt lenses range in thickness
from∼50 m to a couple hundred meters. Even in thin melt lenses, convection is expected to occur [Huppert and Sparks, 1988; Worster et al., 1990] as modeled at EPR by Liu and Lowell [2009].
[20] In the Oman ophiolite, field and textural evidence,
namely, foliations, lineations, and associated plagioclase LPO (Figure 8), from the exposed floor of the melt lens presented below suggest that its floor was swept by con-vection currents. In these horizontal gabbros, if foliations were induced only by settling in a static environment, they should be weak and lineations should be even weaker, and they should remain weak along a vertical profile. On the contrary here in the first tens of meters beneath the lens floor, fabric strength sharply increases (Figure 8), suggest-ing the followsuggest-ing mechanism. Crystal tablets dropped from a dense convection current sweeping the lens floor would have developed some shape preferred orientation in an un-dercompacted layer, with some 60% crystals/liquid [Liu and Lowell, 2009]. The next convection current, sweeping the floor with a new cloud of crystals, would exerts a shear on the freshly settled pile with, as a result, further compaction, increased preferred alignment of crystals in the mush, and
development of a shear‐related foliation as exemplified in Figure 7d. Eventually, at 10–30 m below the lens floor, the mush is well compacted and strongly oriented (Figure 8).
[21] Another record of convection is the occurrence of
lineations associated with foliations in the horizontal gabbros. Static deposition should hardly induce any linea-tion. They are, rather, assumed to reflect the dynamics of convection rolls in the melt lens because they are fairly strong and their patterns in the field are well organized (Figure 5). In laminar flow, the magmatic flow direction and mineral lineations are expected to be perpendicular to the axis of 2‐D convection rolls. In Figure 3b, lineations are trending, on average, at 25° to the sheeted dikes. The map in Figure 5 and individual traverses suggest that this oblique trend can be resolved with some scattering into two main trends, one parallel to the sheeted dike complex and the other perpendicular. Summarizing the patterns of the 105 lineations that were measured in flat‐lying gabbros from the map in Figure 5 in Nakhl and other traverses, 35 linea-tions are parallel, within 20°, to the sheeted dike trend; 55 lineations are perpendicular to this trend, with a similar scattering; and 15 measurements are in intermediate orienta-tions. Figure 5 shows that as long as the observed half‐ chamber was 1 km wide or more, mineral lineations were preferentially parallel to the WNW‐ESE sheeted dike com-plex and when the lens had retracted and subsided into the graben, lineations rotated perpendicular to the sheeted dike trend. The fairly ordered trend of lineations suggests that in the primary large melt lens, rolls of convection currents may be preferentially 2‐D, being first perpendicular to the ridge axis, and that they rotated to a trend parallel to this axis when the lens retracted. The latter orientation might be controlled by the proximity of the lateral walls of the lens. Departures from these 2‐D trends may be either due to uncertain measurements or, possibly, due to indications of locally 3‐D convection.
4.2. Settling of Anorthosites on Lens Floor
[22] Inside anorthosite swarms, there is a contrast between
fat anorthosite layers that are also sheared (Figure 7d), stretched, and folded and the surrounding thin anorthosite lenses and anorthositic gabbros that are remarkably laminar. A new melt pulse, crystallizing first only plagioclase, would construct onto the lens floor anorthosite meter high mounds along the venting fracture, in keeping with observations that the fat anorthosite layers have a polarity, being located on one face of swarms and grading internally into thositic gabbros [Boudier and Nicolas, 2011]. Thin anor-thosite lenses would settle in relation to convection in the melt lens (Figure 9). Once eutectic conditions are attained, anorthositic gabbros would be deposited from a convective suspension of the three minerals. Convection currents sweeping the lens floor would bring clouds of plagioclase in a suspension that mingles with layers of eutectic gabbros or the products of their continuous deposition. Observations in the field and thin sections of clots of normal gabbros being smeared within anorthosite laminae suggest that a freshly settled layer of gabbro could have been dismem-bered and remobilized in an anorthosite‐rich suspension sweeping the floor. This interpretation may explain how anorthosite cumulates can be present as xenoliths in lavas extruded at EPR, fitting the conclusion of Ridley et al. Figure 7. (a and b) Grain size variations in flat‐lying,
foliated gabbros and anorthosites (same magnification). (a) Fine‐grained anorthositic gabbro, plagioclase thin laths, ∼1 mm long (Nakhl; fabrics shown in Figure 8) and (b) coarse‐grained gabbro with tabular plagioclase ∼3 mm long (Al Khood section). (c) Oriented fine‐grained plagio-clase crystals (<1 mm) included in granular clinopyroxene and (d) clinopyroxene crystal rotation recorded by plagio-clase inclusions during magmatic shearing (East Jabal Dimh). Thin sections are in crossed polars, normal to foliation and parallel to lineation. The scale bar is 2 mm.
[2006] that they represent fragments from a melt‐bearing plagioclase cumulate.
[23] Finally, it is suggested that the coarser‐grained and
well‐recovered layers that are interlayered with the domi-nant fine‐grained gabbros (Figures 4d and 7b), as well as the few large plagioclase tablets within otherwise fine‐grained gabbros, did not directly settle on the lens floor from a convection current, as do finer‐grained layers. They might have remained in suspension within the convection cells as predicted by Huppert and Sparks [1988]. Within this differentiated liquid of increased density and viscosity, before deposition on the lens floor, larger crystals could have grown mainly by thickening, with fewer twins. They are somewhat comparable to the highly recovered crystals observed in lower gabbros. They tend to disappear in gabbros from the upper gabbro unit, possibly due to increasing recovery and recrystallization in their matrix. Observations and counts reported above in anorthosites show that the large tablets, assumed to relate to convection are present only in the thin anorthosite lenses. They are absent in the thick anortho-site layers, regarded as being directly settled near melt vents, lending support to the interpretation presented in Figure 9.
In keeping with the analysis of rapid compaction and devel-opment of foliation below the lens floor (Figure 8), thick anorthosite layers, observed either horizontal (Figures 4a and 4b) or steep, remain weakly compacted down to a few tens of meters. This is well illustrated by the occurrence of large clinopyroxene oikocrysts issued from former melt pockets (Figures 7c and 7d). Inside these oikocrysts, observation of plagioclase tablets that are smaller than in the matrix and ori-ented parallel to the surrounding foliation of the anorthosite demonstrate that foliation developed very early during oiko-cryst growth, on the melt lens floor and in the subsiding mush. The near‐absence of olivine in the subsiding anorthosite layers may be accentuated by melt reactions during compaction. 4.3. Time Constraints in Melt Lenses
[24] Time constraints on melt lens activity have been
estimated from field measurements on anorthosite swarms in the Oman ophiolite with the assumption that it had been a superfast oceanic ridge [Boudier and Nicolas, 2011]. How these estimates are obtained is recalled in Appendix A. They are considered here in light of the recent marine results on melt lenses at EPR.
Figure 8. Sharp increase in plagioclase preferred lattice orientations in flat‐lying anorthosites beneath the floor of the former melt lens in East Nakhl. Electron backscattering diffraction measurements (lower hemisphere, nonpolar data, structural reference frame with foliation trace E‐W) are shown. The strength of the fabrics is measured by the J index [Mainprice and Silver, 1993]; pole figure index (pfJ) measures the strength of orientation of individual crystallographic axes. Modified from Morales et al. [2011].
[25] Thermal modeling, taking in consideration enthalpy
of crystallization and internal convection [Worster et al., 1990], makes it possible to estimate the time span before the melt lens is entirely frozen, thus introducing constraints mainly on the minimum thickness of the melt lens. If the melt lens is no more than 100 m thick or thinner, it will cool and crystallize in less than 100 years. In the Oman ophiolite, the melt lens has been pinched, and, consequently, the lens thickness is unknown. From the estimation of lens replen-ishment every ∼100 years (see below), it seems necessary that our melt lens be 100 m thick or more, to maintain it partly molten between two melt pulses. This condition may be relaxed if the lens is also fed by a continuous flux of differentiated melt percolating through the floor of the melt lens, as proposed by Goss et al. [2010] and Boudier and Nicolas [2011].
[26] Field measurements on the average distance in
homogeneous gabbros between two anorthosite swarms allowed us to estimate at ∼100 years the time necessary to settle one gabbro‐anorthosite sequence in the melt lens (Appendix A). Similarly, from the average thickness of anorthosite fat layers and of swarms, upper time limits of 4 and 50 years have been estimated to create a fat layer and an anorthosite swarm, respectively. Within less, possibly much less, than 50 years following a melt pulse, the excess of plagioclase present in the melt lens and anorthositic clouds would have totally settled. The time lapse for set-tlement of the homogeneous gabbros, ∼70 years (based on a 7 m gabbro thickness), already longer than the time for convection, may be relatively much longer, in keeping with marine observations as discussed now.
4.4. Active Melt Lenses Along Axis
[27] Marine seismic reflection data cast some light on the
problem of crystal ratio in the melt lens. Along a profile in the southern Juan de Fuca Ridge, large variations in seismic
wave velocity beneath the AMC reflector have been ascribed to active segments with 60%–75% melt alternating with inert, mushy segments with <30% melt [Canales et al., 2006]. The estimate for the active lens length along the axis has been ∼9 and ∼17 km for the mushy segment. At EPR 14°30′S [Singh et al., 1999], the estimate for active segments is between 2 and 9 km separated by mushy ones, 15–20 km long. Both groups have interpreted the melt‐rich segments as being recently fed, thus explaining their high melt fraction and, being hotter, their coupling with active hydrothermal fields. From thermal modeling, Liu and Lowell [2009] suggested that in the active segments, con-vection is strong, in contrast to mushy segments where convection should be killed by a higher viscosity. Since these ridge segments are aligned along a single lens, their compared extension might be translated in terms of respec-tive durations, suggesting that lenses would be acrespec-tive between only approximately one fourth to one tenth of a given cycle between two consecutive replenishments. This is compatible with marine data suggesting that the period of activity of a melt lens should be shorter than its period of quiescence. Since 1985 with the first record of lava eruption at EPR 9°50′N, there has been a 1991 eruption, both having the primitive signature of an anorthositic‐troctolite replenishment and containing anorthositic xenoliths [Ridley et al., 2006]. They contrast with lavas erupted in 2005 with a fractionated mid‐ocean ridge basalt (MORB) com-position [Goss et al., 2010]. We assume that within this time lapse of 20 years, there has been the magmatic shift described in Oman, from the anorthositic episode with con-vection to a normal MORB. The duration of this episode and related convection might be in the 20 year range. From modeling of the situation of a convective melt lens with crystal settling on its floor, favored here, Liu and Lowell [2009] estimated that the crystal ratio in the active melt lens would increase within decades, killing convection Figure 9. Sketch illustrating the progressive construction of an anorthosite swarm. During the initial
outpouring of a melt pulse, a meter thick anorthosite mound settles in gravity‐controlled unstable con-ditions (folding, shearing, and boudinage). This would be followed by convection‐controlled deposition of plagioclase‐rich clouds settling anorthositic lenses, mixing with gabbro layers.
because of the related higher viscosity. Meeting with our estimates, these results suggest that in a melt lens cycle, the replenishment‐anorthosite sequence should be shorter, maybe much shorter, than the gabbro deposition sequence (see Appendix A).
[28] With reference to marine data and to our former
conclusions (Figure 9), anorthosite swarms resulting from a new melt pulse in the lens and involving convection would have settled during a period of melt lens activity. It is speculated that the subsequent homogeneous gabbros could have settled on the lens floor from a more viscous mush, with limited or no convection. This is suggested by field observations showing weaker foliations and lineations in the gabbros than in the swarms. Further studies implying LPO fabric measurements are in progress.
4.5. Melt Lens Stability
[29] Stability of a melt lens depends on its continuing
activity through time as recorded in the Jabal Dimh situation (Figure 10a). Stability requires a regular and abundant melt feeding. These conditions are met with melt influx occurring every ∼100 years and delivering a linear melt volume (volume per meter longitudinally) estimated at∼9.104m3/m, the melt volume necessary to feed the accreting crust at the chosen spreading rate of 0.1 m/yr (see Appendix A). As discussed above, there is, however, another condition: the lens thickness must not be smaller than∼100 m because it may freeze, whatever its horizontal dimensions, unless the flux of a continuous melt feeding is large enough to prevent freezing.
[30] The contrast between stable and unstable melt lenses
is illustrated in Figure 10 by detailed maps in Jabal Dimh in Wadi Tayin massif [Nicolas et al., 2009] and in Nakhl (Figure 5). In Dimh, mapped over 8 km transversally to the sheeted dike complex and to the presumed N‐S ridge axis, no flat‐lying gabbros have been observed between the RZSDC and foliated gabbros that are immediately steep and parallel to sheeted dikes (Figure 10a). Such structures extending over a transversal distance of 8 km imply a steady state activity over several tens of thousands years (80,000 years for a half spreading rate of 0.1 m/yr). This situation contrasts with the Nakhl situation (Figure 10b), in which an abandoned near‐horizontal melt lens floor is now exposed (Figure 4a), eventually leading to lens freezing when reduced to a graben.
[31] In Nakhl, the northern side of a melt lens has
retreated over 1200 m, from its limit between flat gabbros and the overlying RZSDC, to a graben, itself 500 m wide (Figure 10). Direct settling of minerals on the large melt lens floor, reinforced by convection currents sweeping this floor, accounts for the horizontal foliations observed in gabbros. Because of this retreat of the floor, newly settled gabbro layers near its limit are exposed to a fierce hydrothermal circulation and immediately frozen. Subsidence of the lens floor by normal faulting has accompanied this retreat. With a reduced replenishment marked by fewer anorthosite swarms, this retreat has been irreversible, leading to com-plete freezing of the melt lens.
[32] This situation might be a consequence of ridge jumps
that have been documented in the Nakhl massif (Figure 2). In the map in Figure 5, the extrapolated western tip of the
graben is consistent with ridge tectonics in this massif and in the next Haylain massif to the north [Reuber et al., 1991; Nicolas and Boudier, 1995; Nicolas et al., 2000]. Another rift, propagating to the WNW has been mapped in the western part of Nakhl massif, itself relayed by another western rift in Haylain, creating a situation of overlapping or competing ridge segments. In such situations, the full spreading rate is divided between the segments. Conse-quently, here a lower spreading rate and a reduced melt flux seem an appropriate hypothesis.
[33] Whether these contrasted stable and unstable melt
lenses may relate to the stability of accretion processes along the Oman ridge may be tested by turning again to the compilation of observations on attitudes of foliated gabbros right below the RZSDC summarized in Figure 3. In the southern massifs, in particular Wadi Tayin, gabbros are immediately steep beneath the RZSDC. This contrasts with the central and northern massifs, where in many sites gabbros are flat lying beneath the RZSDC, according to the Figure 3b record. This would be symptomatic of unstable melt lenses and of highly segmented ridges. Indeed, at the scale of the entire Oman ophiolite belt, a high degree of ridge segmentation has been documented in the central and northern belt, as suggested [Lippard et al., 1986; Nicolas et al., 2000] and recently confirmed [Miyashita et al., 2003; Umino et al., 2003].
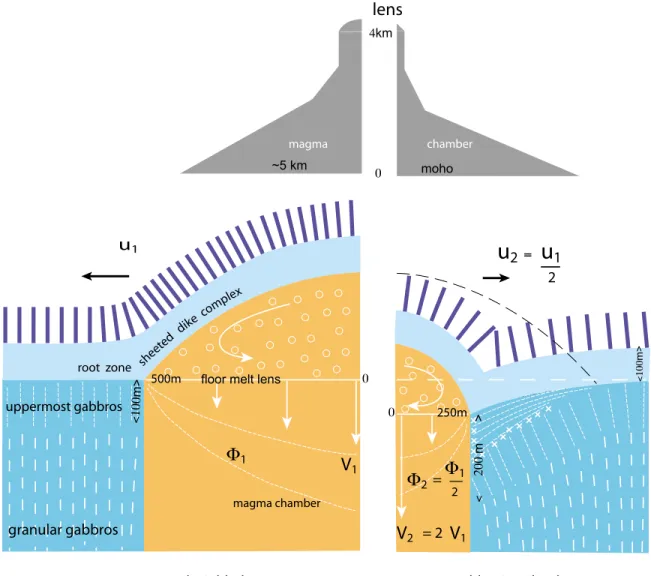
[34] The sketch of Figure 11 tentatively quantifies the
contrasted situations of stable (Figure 11a) and unstable (Figure 11b) lenses. As proposed above, the Nakhl lens would be retreating because it is sharing the full spreading rate of Oman paleo‐ridge with a new propagating rift that has been identified to the west (Figure 2). In the sketches of an unstable lens (Figure 11b), it is assumed that the spreading rate is lower, say half that in the situation of a stable lens, and, consequently, that the downward flux is also half that of a stable lens (Figure 11a). However, as the melt lens surface shrinks, the subsidence rate of the mush below the floor of the melt lens into the magma chamber increases. It could be∼10 m/yr at the axis of a lens reduced to a∼500 m width. Incidentally, this may explain the sharp steepening of foliations and lineations at the margin of the graben. The situation may contribute, together with lid cooling caused by the reduced heat flux, to the downward motion of the floor of the small lens into a graben. In the funnel‐shaped magma chamber beneath, this may result in rapid subsidence and rotation from flat to steep foliations as seen in the cross sections in Figure 6. In the subsiding gabbro mush beneath the RZSDC, the transition from poorly recovered to fully recovered granular gabbros occurs in the field at ∼200 m below the floor in an unstable lens, com-pared to∼100 m in the case of a stable lens. As this transition is time dependent [Nicolas et al., 2009], this observation suggests that the subsidence rate was twice faster in a small lens (Figure 11b). Thus, a higher subsidence rate, itself resulting from a reduced section, compensates the smaller flux of subsiding material. Consequently, it is predicted that the steep conduit in upper foliated and granular gabbros above the flattening aisles of the magma chamber during the functioning of a large and stable lens (Figure 11a) is wider and shorter than in the situation of a small and unstable lens (Figure 11b).
Figure 10. (a) Stable melt lens, illustrated by the map of Jabal Dimh, and (b) unstable melt lens, illus-trated by the map of eastern Nakhl massif. To facilitate a comparison and have the sheeted dike complex close to a NS ridge axis, the Nakhl map has been rotated 90°E. Arrows point to parallel directions of spreading. Denudation of lens floor and reduction to a graben in Nakhl contrasts with a steady state struc-ture in Dimh, notwithstanding faults and thrusts that relate to a subsequent ridge activity at lower temper-ature. (Dimh map from Nicolas et al. [2009], and Nakhl map is reduced and simplified from Figure 5, with trajectories of foliations and lineations.) Same legend as in Figure 5.
4.6. Breathing of the Melt Lens
[35] The large volume of melt being injected in a time
shorter than 4 years, as deduced from the average thickness of anorthosite fat layers (Appendix A), would trigger a rapid spreading of the melt lens, nearly doubling the volume of a lens 100 m thick and with lateral dimensions of about 1000 m, as also evaluated by modeling [Liu and Lowell, 2009]. In the Cleft segment of Juan de Fuca Ridge, Canales et al. [2006] recorded that along axis the ridge, transverse width of the melt lens varied from ∼1700 to ∼800 m over a ridge‐parallel distance of 10–20 km. In two cases, the wider lenses coincide with active segments as defined above. To explain these large variations in lens
width, we suggest that each of these two active segments had been recently fed by the powerful melt surges proposed above. The volume is such that if accommodated by a transverse migration, the transverse surface of the lens would double with respect to a melt‐starving lens. Wilcock et al. [2009] reached similar conclusions along the Endeavor segment of the same ridge. These lines of evidence suggest that a large transverse and active melt lens is the result of expansion during the replenishment, also inducing convec-tion. In contrast, a narrow and inactive melt lens is the result of the following phase of quiescence, the lens shrinking as a result of the continuous withdrawal of basaltic material feeding the accreting crust.
Figure 11. (a) Structure of a large and stable melt lens, replenished by mantle‐derived melt on a fre-quency in the range of 100 years. Outside the lens and magma chamber, the accreted uppermost gabbros develop a steep foliation (vertical white lines), right beneath the RZSDC at the limit of the lens, as a con-sequence of subsidence. At a depth of∼100 m, they grade by dynamic recovery into the granular gabbros (vertical white dashes). (b) Melt‐starving lens, retreating from a previous stable state as in Figure 11a (dashed black line) with deposition of flat‐lying gabbros, progressively subsiding. The floor of the small melt lens subsides in keeping with the deposition of gabbros. Assuming that the lens instability relates to a locally smaller spreading rate (taken here as half the former rate) accounts for field observations and would result in distinct magma chamber profiles (gray profiles on top). U, spreading rate; V, subsidence axial rate;F, gabbro mush flux.
[36] Superimposed on this “breathing activity” in both
stable and unstable melt lenses with a∼100 year periodicity, which is a consequence of successive melt surges, in unstable melt lenses, there is a deficit in melt delivery, and the lens is retreating on the long term.
4.7. Hydration of the Gabbros and Horizontal or Vertical Motion of Melt Lens
[37] Because of a new melt invasion, a melt lens largely
spreads horizontally, swelling between the gabbros of their roof that belong to the RZSDC and the foliated gabbros subsided from its floor, as discussed above. Both gabbro formations, formerly hydrated and equilibrated at ∼400°C, would be now reheated to 1150°C. This would locally trigger hydrous anatexis and hydrous recrystallization [Bosch et al., 2004], generating pargasite‐bearing gabbros, followed by diorites and trondjhemites, according to experimental results [Koepke et al., 2005] and confirmed by field observations [Nicolas et al., 2008]. These hydrous facies are ubiquitous in both the RZSDC above the melt lens horizon and in the topmost foliated gabbros from below, obliterating their foliation (Figure 4e), as already reported [MacLeod and Yaouancq, 2000; Nicolas and Boudier, 1991]. The thermal effects of reheating and hydrous melting are restricted in the field to the first tens of meters around the lens level, fol-lowing our thermal modeling. This is because reheating of the gabbros from 400°C to 1150°C and enthalpy of melting consume a heavy share of the thermal energy of the lens, requiring the freezing of∼4 g of melt to generate 1 g of hydrous melt, a result close to that obtained by Coogan [2003].
[38] Coogan [2003] also reported a high chlorine content
in ridge basalts that requires assimilation of hydrated rocks, the volume of which being∼20% of the entire crust. Coogan suggested that massive and repeated roof assimilation by a rising melt lens may account for this estimate, taking as field evidence for this process that diabase dike and gabbro enclaves have been assimilated by hydrous plutonic intru-sions. Our detailed study on the RZSCD in the southern area of the ophiolite considered here confirms this, but the evolved plutonic rocks (vari‐textured gabbros and trondj-hemites) have been assigned to intrusions related to hydrous melting and to a normal activity in the RZSDC above a static lens, with no evidence for further assimilation by a rising lens [Nicolas et al., 2008]. The detailed map in Sumail presented here and those in Wadi Tayin (Figure 11a) and in Nakhl (Figure 5) show that the RZSDC zone is fairly linear and does not depart much from a constant∼100 m thickness, limiting the extent of possible upper motion by roof assim-ilation to only a few tens of meters. Admittedly, in central and northern Oman, large hydrous plutonic intrusions pen-etrate the RZSDC in areas where they relate to ridge seg-mentation [Nicolas et al., 2008].
[39] Whereas no significant vertical variations in RZSDC
thickness has been measured in the field, breathing of lenses should nearly double their horizontal area [Liu and Lowell, 2009], notwithstanding the∼1200 m retreat measured in the Nakhl massif and related to an unstable behavior (Figures 3 and 5). Even larger variations of melt lens width in ridge transverse direction have been described in present‐day ridges [Kent et al., 1993]. As seen in section 4.6, the hydrous anatectic gabbros are ubiquitous above and beneath the level of melt lenses and have been attributed to the
breathing of the melt lens. This represents an efficient way to hydrate the oceanic crust and to introduce chlorine in basalts as documented by Coogan [2003]. Furthermore, in the very short time of melt lens replenishment, <4 years, migration by thermal assimilation of the lid seems excluded, except possibly along tension fractures opening during roof upheaval. However, such fractures have not been observed during our high‐resolution mapping in any RZSDC.
5.
Concluding Remarks
[40] From field studies in the Oman ophiolite, whatever
the scale of mapping, existence of a melt lens at the ridge axis of origin would have never been imagined if a melt lens had not been seismically discovered and imaged at present‐day fast‐spreading ridges. The seismic images mainly obtained along the East Pacific Rise yield informa-tion on locainforma-tion and size of melt lenses. Conversely, in Oman ophiolite, only the trace where the floor and the roof of a former melt lens joined is identified, and the geometry of the lens is totally unknown. However, detailed mapping makes it possible to investigate the internal structure and dynamics of lenses. In this respect, both approaches are remarkably complementary.
[41] Extending a preceding study on stable melt lens
activity as deduced from field data [Boudier and Nicolas, 2011], new results deal with the unstable behavior and death of melt lenses. One may expect that a melt lens, which is in the kilometer range in a transverse cross section and a few tens to a few hundreds meters thick, be unstable in the most dynamic environment of a fast‐spreading oceanic ridge. At its roof, it is confronted with an extreme thermal gradient of∼7°C/m within the RZSDC. The melt lens would freeze because of this efficient cooling if it is not replenished every ∼100 years, assuming that its thickness does not exceed∼100 m. In an unstable lens, possibly due to a deficit in melt delivery, the lens progressively retreats, because at the same time, the lens must continuously feed crustal accretion. As deduced from mapping in the Nakhl massif (Figure 5), retreat is identified in the field by horizontally foliated gabbros exposing the floor of one side of the lens over a distance of some 1200 m. Retreat leads ultimately to subsidence in a 400 m wide graben where, eventually, the lens has frozen. Equally large variations in lens width have been pictured along the EPR ridge axis near competing segments [Kent et al., 1993], suggesting a similar situation. [42] The unstable melt lens that was mapped in the Nakhl
massif appears to be related to local segmentation in the ophiolite. There, due to competition with another ridge segment, spreading rate and melt flux should be smaller than in the simpler ridge situation of Jabal Dimh in Wadi Tayin massif where no such segmentation has been documented and where it is expected that the melt lens has been stable over tens of thousands of years. This suggests again that a deficit in melt flux is responsible for large melt lens retreat. In the southern part of the Oman ophiolite, melt lenses are dominantly stable, with minor ridge segmentation compared to northern Oman with more unstable lenses and a highly segmented structure. Similarly, present‐day ridges with no segmentation might be underlined by large and stable lenses and, in contrast, highly segmented ridges, underlined by unstable ridges.
[43] Finally, the tempo of replenishment of melt lenses is
responsible for the massive volume increase following a fast melt injection. This large volume increase nearly doubles the horizontal area of the lens with, as a result, an important seawater contamination and hydrous melting near the roof and the floor of the spreading lens. Mapping of the RZSDC in the southern massifs precludes that expansion occurred by large vertical motion in melt lenses.
[44] The exposed floor of a retreating lens provides direct
information on processes occurring in the lens, in particular magmatic convection. The geometry of convection rolls has been deduced from patterns of flow lineations imprinted on the flat‐lying gabbros settled on the floor as exposed above (section 4.1).
[45] A connection is tentatively proposed between
mag-matic deposition sequences defined in the Oman melt lenses and lens segmentation along EPR and Juan de Fuca Ridge axes. Singh et al. [1999] and Canales et al. [2006] have described shorter active segments, presumably recently fed by new melt injections with active convection [Liu and Lowell, 2009], and longer inactive, mushy segments. Simi-larly in Oman, the anorthosite‐rich sequences have been ascribed to a melt replenishment event and interpreted as being settled on the lens floor by convection currents, in contrast to the overlying homogeneous gabbros, possibly representing the mushy inactive segment described along the EPR axis. Settling of these gabbros in static conditions is suggested by a few field evidence such as their weaker foliation and, maybe more relevant with respect to con-vection, their lineation that is weak or absent.
[46] Other marine techniques, such as high‐resolution
bathymetry, are another potential source of direct informa-tion. So far, even ultra high resolution bathymetry study at the EPR 18°S [Carbotte et al., 2003], where the western side of the ridge is spreading at∼20 cm/yr, a rate that may compare with that of the Oman palaeo‐ridge, cannot record finer‐scale structures than normal faults with an average spacing of 50 m and an along‐strike length of ∼120 m. This 50 m figure would correspond to a frequency of 500 years, larger than the ∼10 year periodicity estimated here from spacing of anorthosite swarms. The same conclusion arises from a recent study on the Galapagos ridge [White et al., 2008] where a high‐resolution survey has detected ridge parallel fissures. The smaller fissures have a spacing of 40–50 m that, considering the local spreading rate, would correspond to a frequency between 1200 and 1500 years. In summary, these studies point to frequencies significantly larger than the one recorded in the Oman ophiolite from anorthosite swarm spacing. A comparison would require a resolution in bathymetric surveys better than 10 m at a superfast spreading ridge.
Appendix A
[47] To justify the numerical estimations on timing used
in the present study, their origin is briefly recalled [Boudier and Nicolas, 2011]. They rely on field measurements of anorthosite swarm thickness and spacing between adja-cent swarms separated by homogeneous gabbros. Anortho-sites are important because they can be used as signals of a new melt intrusion in the melt lens, as being the
first deposition on the melt lens floor from the intrusion (Figure 9). During subsidence in the magma chamber, anorthosites and gabbros are stretched and rotated close to vertical when they drift through the magma chamber wall. Within view to track melt pulse activity within the lens by measurements in swarms, it is assumed that deposition did not occur exactly on the ridge axis but on either side and that the volume of the melt pulse is such that the settled anorthositic layers cover entirely the lens floor. If spreading rates were known in this ophiolite, average distances mea-sured in the field in the spreading direction could be directly transformed in time estimates. Assuming that the Oman ophiolite was derived from a fast‐spreading system, possibly a superfast one [Nicolas et al., 2008], a half‐spreading rate, u = 0.1 m/yr, was chosen.
[48] Dealing with a swarm, the average thickness of the
fat and pure anorthosite layers and that of the swarm itself as they are sketched in Figure 9 were measured. Thought to be issued from a mound along a melt vent, the average 0.40 m thick anorthosite layer yields a time of
t ¼ 0:4 m=0:1 m=yr ¼ 4 years:
This is the maximum duration for accumulation of a fat anorthosite layer during a melt pulse. Though it took 4 years to drift this anorthosite layer through the wall of the magma chamber, it should be realized that the building of the cor-responding mound on the lens floor could have been much shorter, possibly on the order of months, the rate of volcanic eruptions. In an identical way, the∼5 m average thickness of swarms is transformed into a maximum time of 50 years, also considered as the upper limit for its deposition time.
[49] Now from the ∼7 m spacing by homogeneous
gabbros between swarms, we can derive an estimate on the frequency of melt pulses. A comparable reasoning is fol-lowed, but in contrast to the latter, the 7 m spacing can be converted to a time lapse because it is ascribed to a con-tinuous accretion of homogeneous gabbros and not to an event of unknown duration that is creating swarms. The upper limit for the frequency of melt pulses estimated from field measurements from either side of the lens would be t < (7 + 5 m)/0.1 m/yr = 120 years. Considering that settling of a swarm (responsible for the 5 m spacing in the above equation) is possibly closer to the <4 years necessary to build the fat anorthosite layers than to 50 years corre-sponding to the case of its accretion being continuous, a frequency of∼100 years was retained between melt pulses in the lens. The frequency would be higher if this surge covered only a part of the floor around its vent, because measurements in the field would miss an unknown number of melt intrusion events. Deposition on the melt lens floor was expectedly rapid and widespread because we document in this study a vigorous convection inside the melt lens. Nevertheless, at present, a higher frequency than 100 years for melt intrusions cannot be ruled out.
[50] Acknowledgments. We thank Laurence Coogan, Robert Lowell, and an anonymous reviewer for their help. This study relies on field campaigns conducted thanks to the hospitality of the Oman people and the Directory of Minerals, at the Ministry of Commerce and Industry. We benefited from facilities provided by the University of Montpellier and its department of Geosciences, with technical assistance from Christophe Nevado for thin sections and Emmanuel Ball for the drawing.
References
Bosch, D., M. Jamais, F. Boudier, A. Nicolas, J.‐M. Dautria, and P. Agrinier (2004), Deep and high temperature hydrothermal circulation in the Oman ophiolite: Petrological and isotopic evidence, J. Petrol., 45(6), 1181–1208, doi:10.1093/petrology/egh010.
Boudier, F., and A. Nicolas (2011), Axial melt lenses at oceanic ridges—A case study in the Oman ophiolite, Earth Planet. Sci. Lett., in press. Canales, J. P., S. C. Singh, R. S. Detrick, S. M. Carbotte, A. J. Harding,
G. M. Kent, J. P. Diebold, and M. R. Nedimovic (2006), Seismic evi-dence for variation in axial magma chamber properties along the southern Juan de Fuca Ridge, Earth Planet. Sci. Lett., 246, 353–366, doi:10.1016/ j.epsl.2006.04.032.
Carbotte, S. M., W. B. F. Ryan, W. Jin, M. H. Cormier, E. Bergmanis, J. Sinton, and S. White (2003), Magmatic subsidence of the East Pacific Rise (EPR) at 18°14′S revealed through fault restoration of ridge crest bathymetry, Geochem. Geophys. Geosyst., 4(1), 1008, doi:10.1029/ 2002GC000337.
Collier, J. S., and S. C. Singh (1997), Detailed structure of the top of the melt body beneath the East Pacific Rise at 9°40′N from waveform inver-sion of seismic reflection data, J. Geophys. Res., 102(B9), 20,287–20,304, doi:10.1029/97JB01514.
Coogan, L. A. (2003), Contaminating the lower oceanic crust, Geology, 31(12), 1065–1068, doi:10.1130/G20129.1.
Goss, A. R., M. R. Perfit, W. I. Ridley, K. H. Rubin, G. D. Kamenov, S. A. Soule, A. Fundis, and D. J. Fornari (2010), Geochemistry of lavas from the 2005–2006 eruption at the East Pacific Rise, 9°46′N–9°56′N: Implications for ridge crest plumbing and decadal changes in magma chamber compositions, Geochem. Geophys. Geosyst., 11, Q05T09, doi:10.1029/2009GC002977.
Harding, A. J., J. A. Orcutt, M. E. Kappus, E. E. Vera, J. C. Mutter, P. Buhl, R. S. Detrick, and T. M. Brocher (1989), Structure of young oceanic crust at 13°N on the East Pacific Rise from expanding spread profiles, J. Geophys. Res., 94(B9), 12,163–12,196.
Huppert, H. E., and R. S. J. Sparks (1988), The fluid dynamics of crustal melting by injection of basaltic sills, Trans. R. Soc. Edinburgh Earth Sci., 79(2–3), 237–243.
Hussenoeder, S. A., J. A. Collins, G. M. Kent, R. S. Detrick, and the TERA Group (1996), Seismic analysis of the axial magma chamber reflector along the southern East Pacific Rise from conventional reflection profil-ing, J. Geophys. Res., 101(B10), 22,087–22,105, doi:10.1029/96JB01907. Kent, G. M., A. J. Harding, and J. A. Orcutt (1993), Distribution of magma beneath the East Pacific Rise between the Clipperton transform and the 9°17′N Deval from forward modeling of common depth point data, J. Geophys. Res., 98, 13,945–13,969, doi:10.1029/93JB00705. Kent, G. M., A. J. Harding, J. A. Orcutt, R. S. Detrick, J. C. Mutter, and
P. Buhl (1994), Uniform accretion of oceanic crust south of the Garett transform at 14°15′ on the East Pacific Rise, J. Geophys. Res., 99, 9097–9116, doi:10.1029/93JB02872.
Koepke, J., S. T. Feig, and J. Snow (2005), Hydrous partial melting within the lower crust, Terra Nova, 17, 286–291, doi:10.1111/j.1365-3121.2005.00613.x.
Lamoureux, G., B. Ildefonse, and D. Mainprice (1999), Modelling the seismic properties of fast‐spreading ridge crustal LVZ: Insights from Oman gabbro textures, Tectonophysics, 312, 283–301, doi:10.1016/ S0040-1951(99)00183-3.
Lippard, S. J., W. Shelton, and I. G. Gass (1986), The Ophiolite of Northern Oman, 178 pp., Blackwell, London.
Liu, L., and R. P. Lowell (2009), Models of hydrothermal output from a convecting, crystallizing, replenished magma chamber beneath an oceanic spreading center, J. Geophys. Res., 114, B02102, doi:10.1029/ 2008JB005846.
MacLeod, C. J., and G. Yaouancq (2000), A fossil melt lens in the Oman ophiolite: Implications for magma chamber processes at fast spreading ridges, Earth Planet. Sci. Lett., 176, 357–373, doi:10.1016/S0012-821X(00)00020-0.
Mainprice, D., and P. G. Silver (1993), Interpretation of SKS‐waves using samples from the subcontinental lithosphere, Phys. Earth Planet. Inter., 78, 257–280, doi:10.1016/0031-9201(93)90160-B.
Miyashita, S., Y. Adachi, and S. Umino (2003), Along‐axis magmatic sys-tem in the northern Oman ophiolite: Implications of compositional vari-ation of the sheeted dike complex, Geochem. Geophys. Geosyst., 4(9), 8617, doi:10.1029/2001GC000235.
Morales, L. F. G., F. Boudier, and A. Nicolas (2011), Microstructures and crystallographic preferred orientation of anorthosites from Oman ophiolite and the dynamics of melt lenses, Tectonics, doi:10.1029/2010TC002697, in press.
Morton, J. L., and N. H. Sleep (1985), A mid‐ocean ridge thermal model: Constraints on the volume of axial hydrothermal heat flux, J. Geophys. Res., 90, 11,345–11,353, doi:10.1029/JB090iB13p11345.
Nicolas, A., and F. Boudier (1991), Rooting of the sheeted dike complex in Oman ophiolite, in Ophiolite Genesis and Evolution of the Oceanic Lithosphere, edited by A. Nicolas, R. G. Coleman, and T. Peters, pp. 39–54, Kluwer Acad., Norwell, Mass.
Nicolas, A., and F. Boudier (1995), Mapping oceanic ridge segments in Oman ophiolites, J. Geophys. Res., 100, 6179–6197, doi:10.1029/ 94JB01188.
Nicolas, A., and B. Ildefonse (1996), Flow mechanism and viscosity in basaltic magma chambers, Geophys. Res. Lett., 23(16), 2013–2016, doi:10.1029/96GL02073.
Nicolas, A., F. Boudier, B. Ildefonse, and E. Ball (2000), Accretion of Oman and United Arab Emirates ophiolite—Discussion of a new struc-tural map, Mar. Geophys. Res., 21–3/4, 147–179.
Nicolas, A., F. Boudier, J. Koepke, L. France, B. Ildefonse, and C. Mével (2008), Root zone of the sheeted dike complex in the Oman ophiolite, Geochem. Geophys. Geosyst., 9, Q05001, doi:10.1029/2007GC001918. Nicolas, A., F. Boudier, and L. France (2009), Subsidence in magma
cham-ber and the development of magmatic foliation in Oman ophiolite gabbros, Earth Planet. Sci. Lett., 284, 76–87, doi:10.1016/j. epsl.2009.04.012.
Reuber, I., P. Nehlig, and T. Juteau (1991), Axial segmentation at a fossil spreading centre in the Haylayn block (Semail nappe, Oman): Off‐axis mantle diapir and advancing ridge tip, J. Geodyn., 13, 253–278, doi:10.1016/0264-3707(91)90041-C.
Ridley, W. I., M. R. Perfit, M. C. Smith, and D. J. Fornari (2006), Magmatic processes in developing oceanic crust revealed in a cumulate xenolith collected at the East Pacific Rise, 9°50′N, Geochem. Geophys. Geosyst., 7, Q12O04, doi:10.1029/2006GC001316.
Singh, S. C., G. M. Kent, J. S. Collier, A. J. Harding, and J. A. Orcutt (1998), Melt to mush variations in crustal magma properties along the ridge crest at the southern East Pacific Rise, Nature, 394, 874–878, doi:10.1038/29740.
Singh, S. C., J. S. Collier, A. J. Harding, G. M. Kent, and J. A. Orcutt (1999), Seismic evidence for a hydrothermal layer above the solid roof of the axial magma chamber at the southern East Pacific Rise, Geology, 27(3), 219–222, doi:10.1130/0091-7613(1999)027<0219:SEFAHL>2.3. CO;2.
Umino, S., S. Miyashita, F. Hotta, and Y. Adachi (2003), Along‐strike variation of the sheeted dike complex in the Oman ophiolite: Insight into subaxial ridge segment structures and the magma plumbing system, Geochem. Geophys. Geosyst., 4(9), 8618, doi:10.1029/2001GC000233. White, S. M., J. D. Meyer, R. M. Haymon, K. C. Macdonald, E. T. Baker,
and J. A. Resing (2008), High‐resolution surveys along the hot spot‐ affected Galapagos spreading center: 2. Influence of magma supply on volcanic morphology, Geochem. Geophys. Geosyst., 9, Q09004, doi:10.1029/2008GC002036.
Wilcock, W. S. D., E. E. Hooft, D. R. Toomey, P. R. McGill, A. H. Barclay, D. S. Stakes, and T. M. Ramirez (2009), The role of magma injection in localizing black‐smoker activity, Nat. Geosci., 2, 509–513, doi:10.1038/ ngeo550.
Worster, M. G., H. E. Huppert, and R. S. J. Sparks (1990), Convection and crystallization in magma cooled from above, Earth Planet. Sci. Lett., 101, 78–89, doi:10.1016/0012-821X(90)90126-I.
F. Boudier and A. Nicolas, Géosciences, Université de Montpellier II, 34095 Montpellier, France. ([email protected]‐montp2.fr)