HAL Id: hal-00328010
https://hal.archives-ouvertes.fr/hal-00328010
Submitted on 13 Sep 2006HAL is a multi-disciplinary open access
archive for the deposit and dissemination of sci-entific research documents, whether they are pub-lished or not. The documents may come from teaching and research institutions in France or abroad, or from public or private research centers.
L’archive ouverte pluridisciplinaire HAL, est destinée au dépôt et à la diffusion de documents scientifiques de niveau recherche, publiés ou non, émanant des établissements d’enseignement et de recherche français ou étrangers, des laboratoires publics ou privés.
Sub-micron atmospheric aerosols in the surroundings of
Marseille and Athens: physical characterization and new
particle formation
T. Petäjä, V.-M. Kerminen, M. Dal Maso, H. Junninen, I. K. Koponen, T.
Hussein, P. P. Aalto, S. Andronopoulos, D. Robin, K. Hämeri, et al.
To cite this version:
T. Petäjä, V.-M. Kerminen, M. Dal Maso, H. Junninen, I. K. Koponen, et al.. Sub-micron atmospheric aerosols in the surroundings of Marseille and Athens: physical characterization and new particle formation. Atmospheric Chemistry and Physics Discussions, European Geosciences Union, 2006, 6 (5), pp.8605-8647. �hal-00328010�
ACPD
6, 8605–8647, 2006 Sub-micron atmospheric aerosol particles in the Mediterranean areaT. Pet ¨aj ¨a et al.:
Title Page Abstract Introduction Conclusions References Tables Figures J I J I Back Close
Full Screen / Esc
Printer-friendly Version Interactive Discussion
Atmos. Chem. Phys. Discuss., 6, 8605–8647, 2006 www.atmos-chem-phys-discuss.net/6/8605/2006/ © Author(s) 2006. This work is licensed
under a Creative Commons License.
Atmospheric Chemistry and Physics Discussions
Sub-micron atmospheric aerosols in the
surroundings of Marseille and Athens:
physical characterization and new particle
formation
T. Pet ¨aj ¨a1, V.-M. Kerminen2, M. Dal Maso1, H. Junninen1, I. K. Koponen1,3, T. Hussein1,4, P. P. Aalto1, S. Andronopoulos5, D. Robin6, K. H ¨ameri1,7, J. G. Bartzis5,8, and M. Kulmala1
1
Division of Atmospheric Sciences, Dept. of Physical Sciences, University of Helsinki, Finland
2
Finnish Meteorological Institute, Climate and Global Change, Helsinki, Finland
3
Department of Chemistry, University of Copenhagen, Denmark
4
Dept. of Applied Environmental Sciences (ITM), Stockholm University, Stockholm, Sweden
5
National Centre for Scientific Research “Demokritos”, Athens, Greece
6
AIRMARAIX, Marseille, France
7
Finnish Institute of Occupational Health, Helsinki, Finland
8
Department of Engineering and Management of Energy Resources, University of West Macedonia, Kozani, Greece
Received: 31 July 2006 – Accepted: 28 August 2006 – Published: 13 September 2006 Correspondence to: T. Pet ¨aj ¨a (tuukka.petaja@helsinki.fi)
ACPD
6, 8605–8647, 2006 Sub-micron atmospheric aerosol particles in the Mediterranean areaT. Pet ¨aj ¨a et al.:
Title Page Abstract Introduction Conclusions References Tables Figures J I J I Back Close
Full Screen / Esc
Printer-friendly Version Interactive Discussion
Abstract
The properties of atmospheric aerosol particles in Marseille and Athens were investi-gated. The studies were performed in Marseille, France during July 2002 and in Athens Greece during June 2003. The aerosol size distribution and the formation and growth rates of newly formed particles were characterized using Differential Mobility Particle
5
Sizers. Hygroscopic properties were observed using a Hygroscopic Tandem Di fferen-tial Mobility Analyzer setup. During both campaigns, the observations were performed at suburban, almost rural sites, and the sites can be considered to show general re-gional background behavior depending on the wind direction. At both sites there were clear pattern for both aerosol number concentration and hygroscopic properties.
Nu-10
cleation mode number concentration increased during the morning hours indicating new particle formation, which was observed during more than 30% of the days. The observed formation rate was typically more than 1 cm−3s−1, and the growth rate was between 1.2–9.9 nm h−1. Based on hygroscopicity measurements in Athens, the nucle-ation mode size increase was due to condensnucle-ation of both water insoluble and water
15
soluble material. However, during a period of less anthropogenic influence, the growth was to a larger extent due to water insoluble components. When urban pollution was more pronounced, growth due to condensation of water soluble material dominated.
1 Introduction
Atmospheric aerosol particles effect the global climate directly by scattering incoming
20
solar radiation and indirectly by acting as a cloud condensation nuclei (CCN). Region-ally, suspended particulate matter deteriorate visibility (Cabada et al.,2004) and affect human health (Brunekreef and Holgate,2002;Von Klot et al.,2005). The net effects depend on the amount of particles, their chemical composition, and their physical size. Sub-micron particle population is renewed both by primary (Kittelson et al.,2004)
25
and by secondary sources i.e. gas-to-particle conversion (Kulmala et al.,2004b). Both 8606
ACPD
6, 8605–8647, 2006 Sub-micron atmospheric aerosol particles in the Mediterranean areaT. Pet ¨aj ¨a et al.:
Title Page Abstract Introduction Conclusions References Tables Figures J I J I Back Close
Full Screen / Esc
Printer-friendly Version Interactive Discussion
anthropogenic sources (Kittelson et al., 2004; Janh ¨all and Hallquist, 2005) and bio-genic sources (Tunved et al.,2006) contribute to the amount of suspended sub-micron aerosol particle number concentration.
Independent of their origin, these fresh atmospheric particles are quite inefficient in their ability to scatter incoming solar radiation or act as CCNs. However, as they
5
grow in size due to e.g. condensational growth, they start to contribute remarkably. Based on measurements and regional modeling, in the Po Valley region, Italy, Laakso-nen et al. (2005) estimated that the production of CCN via gas-to-particle conversion and subsequent growth to 100 nm sizes was comparable with CCN originating from pri-mary sources. Similarly,O’Dowd(2001) estimated that intensive new particle formation
10
bursts at the Irish coastline in Mace Head were able to produce a three-fold increase in particle number concentration above 50 nm in diameter. In this size range particles can activate to CCN, if they are hygroscopic enough (e.g.Bilde and Svenningsson,2004). Thus, new particle formation can produce particles large enough to act as CCN.
In assessment of the ambient aerosol potential for CCN production, global models
15
(Stier et al.,2005) have to be utilized. Regional air quality models (Sotiropoulou et al., 2004) can be put to use to calculate e.g. particulate pollution and ozone exposure of population in the modeling domain. Both of these applications need measured prop-erties of ambient aerosol particle population and hygroscopicity as input parameters (Putaud et al.,2004). Recently,Van Dingenen et al.(2004) consolidated aerosol mass
20
concentrations and size distribution measurements conducted in Europe at 31 different sites. However, according toVan Dingenen et al.(2004), physical characterization data is lacking in Eastern Europe and in the Mediterranean Area. This gap has been partly filled in terms of aerosol mass, chemical composition, and total number concentration by Cachier et al. (2005) and Marinoni et al. (2005), who conducted aerosol
charac-25
terization as a part of ESCOMPTE (Cros et al.,2004) project in the Marseille area. Average properties of number size distribution in the Marseille area is still lacking as well as the hygroscopic properties of the sub-micron particles.
particu-ACPD
6, 8605–8647, 2006 Sub-micron atmospheric aerosol particles in the Mediterranean areaT. Pet ¨aj ¨a et al.:
Title Page Abstract Introduction Conclusions References Tables Figures J I J I Back Close
Full Screen / Esc
Printer-friendly Version Interactive Discussion
late mass concentrations (Chaloulakou et al.,2003;Grivas et al.,2004), inorganic com-position of super-micron mass (Colbeck et al.,2002), or ozone (Flocas et al.,2003). The aerosol number size distribution data below 1 µm is lacking. Flocas et al.(2006) mapped total number concentrations in the Greater Athens Area from an airplane us-ing optical methods. However, the number concentration in an urban environment is
5
typically dominated by particles smaller than the lower detection limit of their instrument (0.1 µm).
We investigated aerosol number size distributions, hygroscopic growth factors, and formation and growth rates of nucleation mode aerosols based on two field campaigns from 1–19 July 2002, (Day of Year, DOY 182–200) and in 11–26 June 2003 (DOY 162–
10
177) in Marseille and Athens, respectively. These campaigns were part of Biogenic Aerosols and Air Quality in the Mediterranean Area (BOND) project. In this paper, average characteristics of sub-micron aerosol modal properties and hygroscopic prop-erties of selected Aitken sizes are presented in order to produce input data for regional air quality models concerning summer average background particulate population. The
15
second aim of the study is to quantify formation rates of nucleation mode particles and their subsequent growth at both sites. The related condensable vapour concentra-tions and source rates are also described. Based on nucleation mode hygroscopicity data, the relative importance of water soluble and water insoluble components to the detected growth of the new mode is evaluated.
20
2 Experimental
2.1 Measurement sites
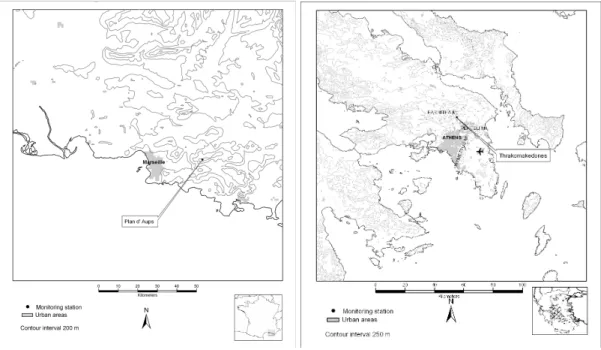
Two intensive field campaigns in the Mediterranean area were conducted during the BOND project (Fig.1). The first campaign was held in Marseille, France, during 1– 19 July 2002 (Day of Year, DOY 182–200) and the second in Athens, Greece, during
25
11–26 June 2003 (DOY 162–177). In Marseille the site was located in Plan d’Aups vil-8608
ACPD
6, 8605–8647, 2006 Sub-micron atmospheric aerosol particles in the Mediterranean areaT. Pet ¨aj ¨a et al.:
Title Page Abstract Introduction Conclusions References Tables Figures J I J I Back Close
Full Screen / Esc
Printer-friendly Version Interactive Discussion
lage (43◦190N, 5◦420E, 700 m above sea level, m a.s.l., approximately 800 inhabitants) some 30 km east of the city of Marseille on a Sainte Beaume Massif. The surroundings of the site were covered by typical Mediterranean vegetation.
The site during Athens campaign was located in a suburban background site Thrako-makedones (38◦803700N, 23◦4502900E, 550 m a.s.l.). The site was located
approxi-5
mately 20 km north from the city of Athens in the foothills of mountain Parnitha. The site is in the northern edge of suburban area of the Athens city. The north sector is completely uninhabited and covered with vegetation.
Both of the measurement sites were located outside of the cities, so they reflected rural (Marseille) and suburban (Athens) characteristics of aerosol size distributions,
10
which were occasionally affected by local urban pollution. 2.2 Instrumentation
Measurements were conducted using similar instrumentation in order to obtain com-parable data. During both of the field campaigns, the aerosol instrumentation was placed in a moving laboratory. The aerosol physical characterization included
sub-15
micron aerosol size distribution measurements with a Differential Mobility Particle Sizer (DMPS, e.g.Aalto et al.,2001) for particles between 3–800 nm in diameter. The DMPS system consisted of two parallel DMPS systems (twin-DMPS) with a closed loop flow arrangement (Jokinen and M ¨akel ¨a,1997). The first was dedicated to sizes below ap-proximately 50 nm in diameter. Particles in this range were counted with a TSI-CPC
20
3025 ultra-fine particle counter. The second system measured the larger particles up to 800 nm in diameter with a TSI CPC 3010. The time resolution for a full particle size distribution scan was 10 min. The total sub-micron aerosol number concentra-tion was obtained from integrated size distribuconcentra-tions. The sampled particles were dried with Permapure drier prior to size segregation and counting, which ensured that the
25
measurements were conducted for dry particles.
Hygroscopic growth of selected size ambient aerosol particles in sub-saturated con-ditions were investigated with a Hygroscopic Tandem Differential Mobility Analyzer
(HT-ACPD
6, 8605–8647, 2006 Sub-micron atmospheric aerosol particles in the Mediterranean areaT. Pet ¨aj ¨a et al.:
Title Page Abstract Introduction Conclusions References Tables Figures J I J I Back Close
Full Screen / Esc
Printer-friendly Version Interactive Discussion
DMA,Rader and McMurry,1986;H ¨ameri et al.,2000). Water uptake was monitored for 10, 20 and 50 nm particles at 88%±3% relative humidity during Athens campaign and for 20, 50 and 100 nm particles during Marseille campaign. The device selected a monodisperse sample from ambient particle population with a short Vienna type Dif-ferential Mobility Analyzer (DMA,Winklmayr et al., 1991). Then a controlled amount
5
of water vapour was added to the sheath flow of a second DMA, which is scanned throught a size spectrum corresponding to a range of 0.9–2.2 times the selected dry sample size. The particles were counted with a TSI model 3010 Condensation Particle Counter. Relative humidity in the sheath and excess flows were monitored with Vaisala HMM-211 relative humidity sensors (±2% at 0–100%). An additional humidifier was
10
placed in the aerosol flow from the DMA1 to the DMA2 to ensure high enough RH in-side the DMA2 and to increase the rein-sidence time of the particles at the elevated water vapour conditions. Aerosol humidifier was controlled to 82% RH and monitored with Vaisala 50Y-sensor (±3% at 0–90% RH). A Hygro M4 dew point sensor with a chilled mirror sensor (D2) was used as an internal reference for the RH (±1.25% RH at 95%).
15
As the initially dry particles absorb water, their size increases due to water conden-sation. The increment is a function of particle composition as well as relative humidity (RH) inside the system. Since the RH was kept constant, the changes in particle growth were related to differences in chemical composition of sampled particles. Typically in-organic salts, such as ammonium sulphate, absorb water vapour in large quantities
20
e.g. H ¨ameri et al. (2000), whereas water vapour is condensed onto organic compo-nents to a lesser extent (Virkkula et al., 1999; Carrico et al., 2005) excluding some organic acid salts (Peng et al., 2001). The instrument can also detect, whether the components are externally or internally mixed within the particle population (V ¨akev ¨a et al.,2002;Aklilu and Mozurkewich,2004).
25
Supporting meteorological and gaseous phase components were measured at the proximity of both measurement sites by local air quality authorities. At Plan d’Aups, the gaseous pollutant levels were monitored at the AIRMARAIX operated air quality stations. Ozone, NOx and SO2 concentrations were obtained as one hour averages.
ACPD
6, 8605–8647, 2006 Sub-micron atmospheric aerosol particles in the Mediterranean areaT. Pet ¨aj ¨a et al.:
Title Page Abstract Introduction Conclusions References Tables Figures J I J I Back Close
Full Screen / Esc
Printer-friendly Version Interactive Discussion
Temperature, relative humidity, wind velocity and direction were obtained from the clos-est elevated Meteo France station on a St. Baeume Massif (Le Castellet, 417 m a.s.l., 10 km NE from Plan d’Aups), and global radiation from the Aix-en-Provence station. During Athens campaign, meteorological data (ambient temperature, relative humidity, wind velocity and direction) and air quality data (SO2, NOx, and O3) were obtained from
5
a measurement station of the Greek Ministry of Environment, Physical Planning and Public Works. The measurements were released as one hour averages. They were conducted at Thrakomakedones next to the aerosol measurements presented in this study.
3 Data analysis
10
Sub-micron size distributions were inverted from measured mobility spectra taking into account charging probabilities (Wiedensohler,1988), counting efficiencies of the con-densation particle counters (Mertes et al., 1995) as well as transfer functions of the differential mobility analyzers (Stolzenburg and McMurry,1991). In addition, the losses in the sampling lines and the perma-pure drier was included in the data inversion in
15
Marseille data set and in the post-processing phase in Athens data set. The drier in-duced losses corresponding to laminar flow diffusion losses in a circular tube having a length of 12 m at 4 l min−1 flow rate. Losses were estimated according toBaron and Willeke (2001).
In order to characterize ambient sub-micron aerosol population in an effective way,
20
log-normal modes (2–3) were fitted to the observed size distributions using an auto-mated and constrained fitting algorithm (Hussein et al.,2005). In order to characterize the observed formation of new atmospheric aerosol particles, methods described in Dal Maso et al.(2005) were utilized. The growth rate (GR) was derived from the rate of change of the geometric mean diameter (GMD) of the fitted nucleation mode. This was
25
done by fitting a first-order polynomial to the fitted GMD during the observed growth time by least squares. The formation rate was determined in a similar manner, but
ACPD
6, 8605–8647, 2006 Sub-micron atmospheric aerosol particles in the Mediterranean areaT. Pet ¨aj ¨a et al.:
Title Page Abstract Introduction Conclusions References Tables Figures J I J I Back Close
Full Screen / Esc
Printer-friendly Version Interactive Discussion
the variable of change was the concentration of particles less than 25 nm in diame-ter. The obtained rate of change of nucleation mode particles d Nnuc
d t was corrected for
losses caused by coagulation during the analysed period (Dal Maso et al.,2005), so that we obtained the rate of appearance of >3 nm particles, J3. The vapour concen-tration responsible for the observed growth and its source rate were calculated based
5
onKulmala et al.(2001). The effect of pre-existing particle concentration on the newly formed particles was estimated with the aid of condensation sink (CS) presented previ-ously byKulmala et al.(2001). The growth analysis required manual selection of data points, which caused uncertainty in the derived results. To estimate this, the analysis was performed multiple times to acquire the variability range of the parameters due to
10
the method.
Hygroscopic Tandem Differential Mobility Analyzer (HTDMA) growth factor spec-trum was inverted taking into account diffusion broadening the DMA transfer functions (Stolzenburg,1988). Multiple charging, losses in the sampling lines and the size de-pendent counting efficiency of the 3010 CPC were not included in the inversion.
15
Hygroscopic growth factors were examined more closely with the aid of soluble vol-ume fractions (Swietlicki et al.,1999). This construction relies on an assumption that the aerosol volume consists of two parts, one insoluble and one water soluble fraction, which explains all of the observed hygroscopic growth. Ammonium sulphate was used as a model compound representing the soluble volume fraction. The evolution of
HT-20
DMA derived soluble fractions conducted at fixed 10 nm and 20 nm particle sizes were linked with the growth of newly formed nucleation mode through the HTDMA size grid. The changes in the soluble volume fraction was interpreted as mass fluxes of water insoluble and soluble material to the nucleation mode using a technique presented in Kulmala et al.(2001).
25
ACPD
6, 8605–8647, 2006 Sub-micron atmospheric aerosol particles in the Mediterranean areaT. Pet ¨aj ¨a et al.:
Title Page Abstract Introduction Conclusions References Tables Figures J I J I Back Close
Full Screen / Esc
Printer-friendly Version Interactive Discussion
4 Results and discussion
4.1 General features 4.1.1 Marseille
Air quality and meteorological conditions at Plan d’Aups can be affected by both land-sea breeze as well as mountain-valley circulation on a daily basis. Enhanced
probabil-5
ity of a pollution episode occurs during the development of the sea-breeze circulation due to local emissions in the Marseille area (Bastin et al., 2005). In addition, Plan d’Aups is occasionally affected by a cold wind, Mistral (Corsmeier et al.,2005). During a prevailing northernly flow, it is channeled by the Alps and Massif Central and ac-celerated in by the Rh ˆone Valley. Typically this leads to decrease in pollutant levels.
10
However, during Mistral conditions, Plan d’Aups can be also affected by a long range transport originating from Central Europe (Corsmeier et al.,2005). During BOND cam-paign, backward trajectories analysis based on HYSPLIT (Draxler and Rolph,2003; Rolph, 2003) showed that the air masses were arriving to Plan d’Aups continuously from SW direction. The 96 h backtrajectories started west from the British Isles and
15
then traveled towards northern shores of Spain. Then they passed over the Northern Iberian peninsula and spent the last hours over the Mediterranean Sea before reaching Plan d’Aups measurement site.
During the measurement campaign the temperature varied at Plan d’Aups between 15◦C and 25◦C. The days were mostly cloudless as indicated by the global radiation
20
radiation data from Aix-en-Provence (not shown). During 14 to 15 July (DOY 195–196) there were strong rain showers.
Gas-phase pollutant levels obtained from AIRMARAIX monitoring network showed that nitrogen oxide concentration (NOx) at Plan d’Aups was low during the whole cam-paign indicating only a weak anthropogenic influence. Median NOx concentration was
25
1.1 ppb (NTP) and occasionally it reached 5 ppb. Day-time average varied from 1 to 3 ppb. Ozone (03) concentrations varied from 40 to 80 ppb. Average diurnal pattern
ACPD
6, 8605–8647, 2006 Sub-micron atmospheric aerosol particles in the Mediterranean areaT. Pet ¨aj ¨a et al.:
Title Page Abstract Introduction Conclusions References Tables Figures J I J I Back Close
Full Screen / Esc
Printer-friendly Version Interactive Discussion
was that at night-time the average O3concentration was 47 ppb and during afternoon hours it peaked at 63 ppb. Sulphur dioxide (SO2) was near the detection limit of the gas analyzer most of the time.
During several days of the campaign, new particle formation via gas-to-particle con-version was observed at Plan d’Aups. The nucleation event days were mostly cloudless
5
days. We did not observe any connection with the other local meteorological parame-ters and the occurrence of the new particle formation. There were no clear connection between the gaseous pollutant concentrations and event days either. Highest levels of SO2 (15 ppb) was observed during one event day. However, two other incidents of elevated SO2concentrations were not coinciding with an observed secondary aerosol
10
production. In addition, there were also days with considerable formation but the sul-phur dioxide concentrations were below detection limit of the gas analyzer. Thus, the sulphur dioxide was not a limiting factor for the formation of new particles.
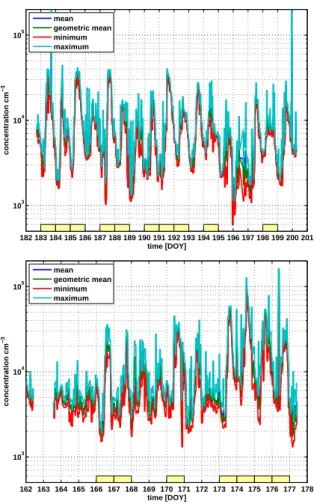
Aerosol number concentration of sub-micron particles is presented in Fig. 2. The concentration varied around 1×104cm−3 as an 1 h average, which is in agreement
15
with earlier total number concentration measurements byMarinoni et al. (2005). Until 14 July (DOY 195), the weather was characterized by clear skies. During 14 and 15 July 2002 (DOY 195–196) there were strong scattered showers around the measure-ment site. This was reflected to the total number concentration. The lowest value of 7×102cm−3was detected after the rain showers due to rain-out of the particles (Fig.2).
20
In order to characterize average size distribution parameters and its diurnal variability at Plan d’Aups site, two to three log-normal distributions were fitted to the observations (Hussein et al.,2005) and an average diurnal cycle of the fitted parameters were calcu-lated. A clear diurnal cycle in the fitted total sub-micron aerosol number concentration was observed, as it reached a minimum in the early morning hours and then increased
25
by a factor of 6 by early afternoon hours (Fig.3, lower left panel). Higher concentra-tions during day-time was also detected byMarinoni et al.(2005) during ESCOMPTE measurement campaign at Plan d’Aups in July 2001. Due to lack of size resolution below 100 nm size range, they were not able to connect the concentration increment to
ACPD
6, 8605–8647, 2006 Sub-micron atmospheric aerosol particles in the Mediterranean areaT. Pet ¨aj ¨a et al.:
Title Page Abstract Introduction Conclusions References Tables Figures J I J I Back Close
Full Screen / Esc
Printer-friendly Version Interactive Discussion
a certain particle size range. As seen from the Fig.3, the concentration enhancement was due to appearance of aerosol particles below 25 nm in diameter (nucleation mode particles). Also an increase in the Aitken size range (25–80 nm in diameter) as the nu-cleation mode particles grew to Aitken size during the afternoon hours and by regional direct emissions. There was no diurnal cycle of the fitted accumulation mode particle
5
number concentration.
Average modal diameters varied from 20 to 30 nm and 50 to 75 nm for nucleation mode and Aitken mode, respectively (Fig.3, upper left panel.). The modal diameters were smaller during day-time tahn during night-time. Modal diameter increased to-wards the evening due to condensational growth of the particles. Stable accumulation
10
mode was detected at 120–140 nm throughout the day. The accumulation mode parti-cle concentrations increased only slightly during the day. The increase in the number concentration of nucleation mode particles can be a result of e.g. direct traffic emissions or due to formation of new particles from gaseous precursors. These two processes can be distinguished from each other by studying the size distribution evolution more
15
closely. This is addressed in a Sect.4.2.
Median modal parameters during the campaign are presented in Table 1. During the BOND field campaign, the HYSPLIT backtrajectories indicated that the air masses were of Atlantic origin and passed the Pyrenees prior arriving to the Mediterranean area. Van Dingenen et al.(2005) classified air mass trajectories for MINATROC
cam-20
paign at Monte Cimone, in Northern Italy. Comparing Van Dingenen et al. (2005) Western Europe (W-EUR) and Mediterranean (MED) trajectory classes with our re-sults yielded similar sub-micron number concentration values of 2–3×103cm−3. At Plan d’Aups, the median modal diameters of the accumulation mode were smaller than observed byVan Dingenen et al. (2005) at Monte Cimone for W-EUR and MED
25
-trajectory classes. The Aitken mode at Monte Cimone was within the median deviation of the BOND data. Van Dingenen et al. (2005) did not specify the (aged) nucleation mode separately. In addition, the Plan d’Aups distribution data was not divided into tra-jectory classes but a grand average of three weeks of measurements were reported.
ACPD
6, 8605–8647, 2006 Sub-micron atmospheric aerosol particles in the Mediterranean areaT. Pet ¨aj ¨a et al.:
Title Page Abstract Introduction Conclusions References Tables Figures J I J I Back Close
Full Screen / Esc
Printer-friendly Version Interactive Discussion
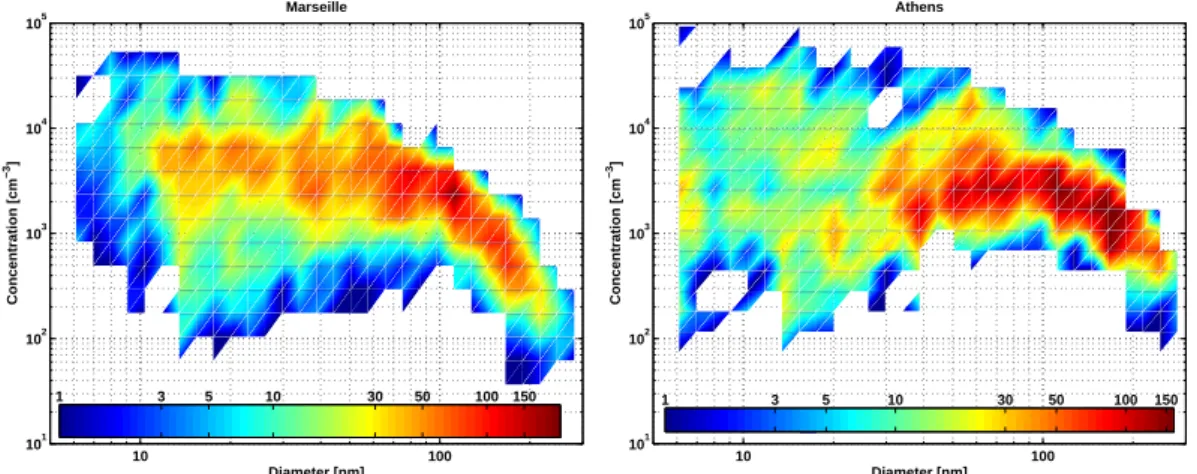
A histogram of fitted mode diameters and concentrations is depicted in Fig. 4. At Plan d’Aups, accumulation mode concentration strongly decreased as the modal di-ameter (GMD) increased. Typical concentrations varied in the order of few hundreds to two thousand particles cm−3 as GMD varied from 100 to 200 nm. Typical Aitken mode concentrations were from 2×10³ up 2×104cm−3. Similar concentration range
5
was typical also for nucleation mode particles. This indicates that the formation of new particles and subsequent growth was dominated by condensation, which is a concen-tration preserving process.
4.1.2 Athens
Athens field campaign was characterized by two clearly different time periods with
10
respect to air quality. During the first period (11 to 23 June 2003, DOY 162 to 174, excluding 19 June, DOY 170), the air quality at Thrakomakedones measurement site was dominated by long range-transport of pollutants whereas the latter part of the campaign (19 June and 24 to 25 June, 2003, DOY 170 and DOY 175 to 176) was strongly affected by a local photochemical pollution from the urban surroundings.
15
Local temperature varied from a minimum of 18◦C to 32◦C. Ground level relative humidity remained below 70% at all times. Between 11 to 21 June 2003, (DOY 162 to DOY 172) synoptic winds from the north were dominating the large scale flow patterns in the Athens area. According to back-trajectory analysis using HYSPLIT transport and dispersion model (Draxler and Rolph, 2003; Rolph, 2003), the air masses circulated
20
over Eastern Europe and arrived to the sampling site via the Black Sea and Borpor’s Strait. Local wind direction was predominantly from the North and the velocity between 5 to 10 m s−1 during days 162 to 168 and decreased to 1–8 m s−1 for the next six days but the wind was still from the North.
During this period of time, Thrakomakedones site was relatively unaffected by the
25
strongly variable local urban particulate sources. This is indicated by low NOx con-centrations as measured by the Greek Ministry of Environment. During this period, the median of 1 h averaged NOxconcentration and ozone were 8 ppb and 108 ppb,
ACPD
6, 8605–8647, 2006 Sub-micron atmospheric aerosol particles in the Mediterranean areaT. Pet ¨aj ¨a et al.:
Title Page Abstract Introduction Conclusions References Tables Figures J I J I Back Close
Full Screen / Esc
Printer-friendly Version Interactive Discussion
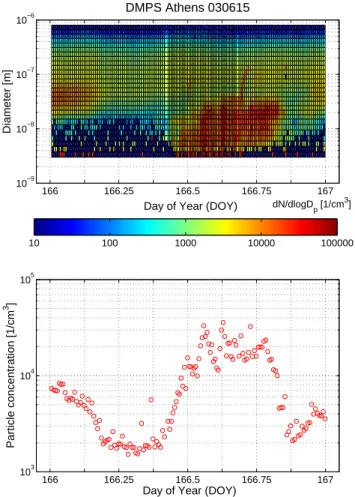
spectively. The 1 h mean total sub-micron particle number concentration was typically in the range of 2000 to 20 000 particles cm−3(Fig.2). The highest concentrations were observed during new particle formation episodes, which are examined in more detail in Sect.4.2.
The later campaign days were characterized by relatively low local winds from
vari-5
able direction. This was reflected in increase in both ozone and nitrous dioxide con-centrations. Median values of 1 h averaged NOx and O3 concentrations were 14 and 111 ppb, respectively. One hour averaged ozone levels reached as high as 200 ppb and NOxmaximum was 60 ppb.
The urban influence was also reflected to the observed sub-micron number
con-10
centrations. On average, the one hour sub-micron particle concentration increased to 1×104cm−3. The concentration also fluctuated more than during the clean period, ranging from few thousands up to 1×10⁵ particles cm−3 during the polluted period. This is due to higher variability of the urban particulate pollution sources (e.g. traffic and industry). The location of the measurement site in the northern rim of the urban
15
area also enables flow of cleaner air from the surrounding rural areas as well as pol-luted air from urban areas. Occasionally the urban plume reached the observation site and subsequently the sub-micron particle concentrations increased up to 1×105cm−3 as one hour average concentration. Flocas et al. (2006) performed airborne number concentration measurements in the Greater Athens Area and reported, on average,
20
one order of magnitude higher sub-micron concentration aloft of the urban populated Athens. This indicates that the Thrakomakedones sampling site in this study repre-sents the background concentrations in the Athens Area even during a polluted period in terms of particle number concentrations.
Two to three log-normal distributions were fitted to the size distribution observations.
25
Diurnal variability of the fitted parameters is presented in Fig. 3. A histogram of all the fitted mode diameters and concentrations is depicted in Fig. 4. Average modal parameters during the campaigns are presented in Table1.
nu-ACPD
6, 8605–8647, 2006 Sub-micron atmospheric aerosol particles in the Mediterranean areaT. Pet ¨aj ¨a et al.:
Title Page Abstract Introduction Conclusions References Tables Figures J I J I Back Close
Full Screen / Esc
Printer-friendly Version Interactive Discussion
cleation mode (Dp<25 nm) geometric mean diameters (GMD) and number
concentra-tions at Thrakomakedones, Athens, are presented in Fig.3. The number concentration increment during the daylight hours was due to the appearance of the nucleation mode to the size spectrum, which had a comparable concentration to the Aitken mode parti-cles. Average GMDs for Aitken and accumulation modes remained relatively constant
5
throughout the day at 50 and 150 nm, respectively. Average nucleation mode diameter decreased before the midday to 10 nm and during the evening it grew to 25 nm in size. The number concentrations in each mode showed a maximum during day-time. An increase in the total number concentration during daylight hours was explained by a sharp increase of the nucleation mode particles and moderate increase of the
10
Aitken mode particles. The accumulation mode concentration remained quite constant throughout the day at 1×103cm−3. This behaviour is due to both photochemical sec-ondary aerosol production via gas-to-particle conversion and their subsequent growth to the Aitken sizes as well as direct emissions of nucleation and Aitken mode parti-cles from the anthropogenic activities. The two pathways cannot be distinguished from
15
each other just by looking at the variation of the total number concentration, but they can be separated by a careful examination of the size distribution evolution during the day. This is done in the Sect.4.2.
Since the Athens site was located at the northern edge of the city, the local wind direction had a strong effect on both the total sub-micron particle concentration and
20
log-normal size distribution parameters. This indicated dramatic differences in the aerosol population residing over the city (southern sector) and over the surrounding unpopulated area (northern sector). The urban aerosol consisted of larger amount of Aitken size particles (Dp=30–80 nm) as compared to the cleaner background air. The dominating wind direction was north during the Athens campaign (not shown). This
25
resulted in lower grand averaged sub-micron aerosol particle concentrations than was expected to reside in Thrakomakedones based on the proximity of polluted urban ar-eas. Due to this, these results do not represent the average character of ambient aerosol populations in Athens city areas, but the mean parameters of sub-micron
ACPD
6, 8605–8647, 2006 Sub-micron atmospheric aerosol particles in the Mediterranean areaT. Pet ¨aj ¨a et al.:
Title Page Abstract Introduction Conclusions References Tables Figures J I J I Back Close
Full Screen / Esc
Printer-friendly Version Interactive Discussion
ticles in sub-urban Greece, which is occasionally affected by pollution from the city areas.
The diurnal evolution of the modal number concentration in Athens and Marseille are similar (Fig.3). At both sites the concentration increment is due to Aitken and nucle-ation mode particles. In Athens, accumulnucle-ation mode is slightly larger (GMD=152 nm)
5
in size than in Marseille (GMD=127, Table1). At both sites, bimodal size distribution was dominantly observed during night-time, when photochemical production of new particles was inhibited.
The most striking difference between the histograms of the fitted GMDs and modal concentrations (Fig.4.) was in the size range below 30 nm. At Plan d’Aups, Marseille,
10
the nucleation mode and Aitken mode were connected, showing a consistent growth to larger sizes. At Thrakomakedones, Athens, the transition from nucleation mode particles to larger Aitken particles was more discrete. This was most probably due to primary production of Aitken and nucleation mode particles, which were not growing steadily in the vicinity of the measurement site.
15
4.2 Formation, growth and hygroscopicity 4.2.1 Aerosol formation events
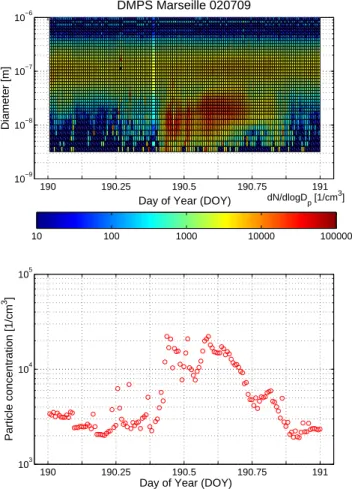
As indicated by the diurnal cycle of the nucleation mode particle concentrations, the formation and subsequent growth can be observed often in Athens and Marseille. As an example, size distribution evolution during two formation events are presented in
20
Figs. 5 and 6 for Plan d’Aups and Thrakomakedones, respectively. In the morning hours, a mode below 10 nm in diameter was observed. The total number concentration increased by a factor of 10. During the day, the size of the mode increased to approx-imately 30 nm. In both cases, the nucleation mode disappears in the evening. This is probably due to relatively rapid growth of the formed particles and the elevated location
25
of the measurement sites. As the boundary layer mixing relaxes during the evening, the site remains in a more stagnant nocturnal residual layer instead of the mixed layer.
ACPD
6, 8605–8647, 2006 Sub-micron atmospheric aerosol particles in the Mediterranean areaT. Pet ¨aj ¨a et al.:
Title Page Abstract Introduction Conclusions References Tables Figures J I J I Back Close
Full Screen / Esc
Printer-friendly Version Interactive Discussion
At Marseille, 10 days with new particle formation events were observed and there were 10 days without an event. Corresponding numbers for Athens campaign were 7 and 11, respectively. This indicates that the event frequency is above 30% in rural Mediterranean area in summertime. This result is in agreement with recent findings by Laaksonen et al.(2005) in Po Valley, Italy.
5
4.2.2 Aerosol hygroscopicity Marseille
Median hygroscopic growth factor (GF) spectrum for 100 nm, 50 nm, and 20 nm par-ticles are presented in Fig.7. Accumulation mode particles were typically externally mixed. Based on median growth factor spectrum, 8% of the particles were less
hy-10
drophobic (GF<1.15), whereas the most of the particles (90%) were more hygroscopic (peak GF at 1.5). This is in agreement with hygroscopicity measurements ofVan Din-genen et al. (2005) at Monte Cimone, Italy. They observed less hygroscopic mode in 10% of the time at 100 nm particle size when the origin of the air mass was from the Atlantic Ocean.
15
A pronounced more hygroscopic mode indicates a large contribution of water soluble components in 100 nm particle size. According toMarinoni et al. (2005), sub-micron particle chemical composition at Plan d’Aups during ESCOMPTE campaign in summer 2001, was governed by sulphate and ammonia (68±30% and 20±9% of the inorganic mass, 45% and 13% of average fine aerosol mass). However, the absolute values for
20
observed growth factors indicate that the 100 nm particles are not solely composed of inorganic water-soluble compounds. The observed growth factors were interpreted with the aid of soluble fraction (Swietlicki et al., 1999). For 100 nm particles at Plan d’Aups, the average soluble volume fraction of the more hygroscopic mode was 0.75 i.e. as a volume fraction, 75% of ammonium sulphate would explain the observed
hy-25
groscopic growth of this mode. This is in a reasonable agreement with 61% average soluble inorganic mass obtained byMarinoni et al.(2005).
ACPD
6, 8605–8647, 2006 Sub-micron atmospheric aerosol particles in the Mediterranean areaT. Pet ¨aj ¨a et al.:
Title Page Abstract Introduction Conclusions References Tables Figures J I J I Back Close
Full Screen / Esc
Printer-friendly Version Interactive Discussion
The insoluble volume fraction of the more hygroscopic mode, on the other hand, was 25% based on HTDMA data. Clumping organic matter (12.4%), black carbon (10.8%), organic acids (3.4%), and dust (11%) mass fractions from average fine aerosol com-position fromMarinoni et al.(2005) leads to an estimate of 37.6% as water-insoluble material. This is consistent, considering the assumption in the TDMA data
interpreta-5
tion, as well as the fact that the 100 nm particles sampled with the TDMA setup do not necessarily represent similar composition as the larger particles, which dominate the mass of the particles and thus count more in the chemical analysis.
For Aitken mode particles (50 nm, Fig. 7b) the median growth factor spectrum was dominated by one mode at GF=1.30. The less hygroscopic tail (GF<1.1) contributed
10
7% and more hygroscopic end (GF>1.55) 8% of the sampled particles.Van Dingenen et al. (2005) detected a less hygroscopic mode to occur 6% of the time for 50 nm particles at Monte Cimone, Italy. According to our results, the average soluble fraction for 50 nm particles was 42%. This indicates a larger volume fraction of water insoluble components as in accumulation mode particles.
15
Hygroscopicity of nucleation mode particles had a largest variability (Fig. 7c). The growth spectrum had a maximum at GF=1.3, which corresponds to an average soluble fraction of 66%. The variability in the GF indicates indirectly that the chemical com-position also changed. Most of these particles were probably formed from gaseous precursors or by direct emissions. Subsequently their size is further increased by
con-20
densation of both inorganic and organic condensable vapors. Variability in the precur-sors and the ratio between soluble and insoluble precurprecur-sors (organic/sulphuric acid) results in the observed variability in the nucleation mode growth factor changes. Athens
Median hygroscopic growth factor spectrum is depicted in Fig.8for 50 nm and 20 nm
25
particles. Aitken particles had a bi-modal growth distribution almost all times. On average, 10% of 50 nm particles were in less hygroscopic and hydrophobic tail of the growth spectrum. The remaining fraction of particles belonged to a more hygroscopic
ACPD
6, 8605–8647, 2006 Sub-micron atmospheric aerosol particles in the Mediterranean areaT. Pet ¨aj ¨a et al.:
Title Page Abstract Introduction Conclusions References Tables Figures J I J I Back Close
Full Screen / Esc
Printer-friendly Version Interactive Discussion
mode. Average growth factor of 1.45 corresponds to a soluble fraction of 75%, which is higher than a 50 nm value observed at Plan d’Aups but similar to 100 nm soluble fraction detected at Plan d’Aups.
Water uptake of nucleation mode particles (Fig.8, bottom panel) was, on average, smaller than at Plan d’Aups and the growth was less variable. This indicates that
5
indirectly that the chemical composition of 20 nm particles at Thrakomakedones varies less than in Plan d’Aups. The hydrophobic mode at this size seems to be nonexistent, when looking at a grand averaged growth spectrum.
During Athens field campaign, also 10 nm particle water uptake was monitored. The number concentration at this size was most of the time too close to the detection limit of
10
the TDMA setup and thus the grand averaged GF spectrum over the whole campaign carried no valuable information.
4.2.3 Formation and growth characteristics
Total of 7 new particle formation events occurred during the Thrakomakedones field campaign. At Plan d’Aups, Marseille, four new particle formation event days were clear
15
enough to be analyzed with a method presented by Dal Maso et al. (2005). In ad-dition, six other days during Marseille field campaign were identified as possible new particle formation days. Calculated formation rates (J3) and subsequent growth rates (GR) of the nucleation mode particles are presented in Table2. The growth rates were 2–8 nm h−1 at Plan d’Aups and 1.2–9.9 nm h−1 at Thrakomakedones. The formation
20
rates were between 3–5.3 cm−3s−1 at Plan d’Aups and 1.3–6.5 cm−3s−1 at Thrako-makedones. These values are in agreement with recent observations in rural/suburban areas (Kulmala et al.,2004b).
At Thrakomakedones the highest growth rates were observed during the polluted period (19 June and 23 June to 25 June, marked as P in Table2.) of the campaign. The
25
polluted period was also apparent due to higher condensation sink values as compared with the clean period, when the strong north winds de-coupled the site from the urban surroundings. During the polluted period the enhanced sink was, however, not able
ACPD
6, 8605–8647, 2006 Sub-micron atmospheric aerosol particles in the Mediterranean areaT. Pet ¨aj ¨a et al.:
Title Page Abstract Introduction Conclusions References Tables Figures J I J I Back Close
Full Screen / Esc
Printer-friendly Version Interactive Discussion
to hinder new particle formation from taking place. As the sink increases, coagulation scavenging of nucleation mode by the pre-existing population starts to be a significant sink to the newly formed particles. Consequently, they must grow or form faster in order to survive and their appearance can be classified as an event based on size distribution evolution (Kulmala et al.,2005).
5
The source rate of condensable vapor (Table 2) in both areas seems to be signif-icantly higher than in rural areas like in Hyyti ¨al ¨a, Southern Finland. During polluted events at Thrakomakedones, the source rate was approximately double compared with the clean events. This is still one order of magnitude smaller than in New Delhi (M ¨onkk ¨onen et al.,2005).
10
4.3 Processes related to aerosol formation
According to our results the nucleation events are related to non-cloudy days showing that solar radiation is needed. The driving force for new particle formation could be sulphuric acid and the growth can be related to both sulphuric acid and organic vapours (e.g.Kulmala,2003). A high condensation sink can also hinder new particle formation.
15
The role of sulphuric acid to new particle formation at Plan d’Aups site was studied with an aid of proxy data. A product of sulphur dioxide and global radiation was used as an indicator of sulphuric acid concentration in the atmosphere. Pre-existing particle condensation sink (CS) surface was an estimate for the loss rate of sulphuric acid. This relation for event and non-event days is depicted in Fig.9. At certain condensation sink
20
values the proxy for sulphuric acid source is higher for event days than for non-event days. This gives some support for the hypothesis that sulphuric acid plays a key role in the atmospheric nucleation at least during some events. Unfortunately, the Marseille data set is too short to conclude on the relative contribution of sulphuric acid to the growth. In addition, we cannot compare these results with Athens data, since there
25
ACPD
6, 8605–8647, 2006 Sub-micron atmospheric aerosol particles in the Mediterranean areaT. Pet ¨aj ¨a et al.:
Title Page Abstract Introduction Conclusions References Tables Figures J I J I Back Close
Full Screen / Esc
Printer-friendly Version Interactive Discussion
4.3.1 Hygroscopicity during events
Sulphuric acid (SA) itself is not typically able to explain the condensation growth of nu-cleation mode particles (Kulmala et al.,2004a). Under polluted conditions in Atlanta, USA,Stolzenburg et al.(2005) showed that sulphuric acid explained all the observed growth whereas in rural Finland, SA explained only 10% of the growth of newly formed
5
particles according toBoy et al.(2005). The rest of the growth was attributed to conden-sation of various organic compounds (Boy et al.,2005). Particles containing sulphuric acid are hygroscopic, whereas the organics in the particulate phase are typically less hygroscopic (Virkkula et al.,1999). These differences in the water vapour affinities and the changes in hygroscopic growth during the events will give insight to mass fluxes of
10
sulphuric acid and organics and their ratio during the growth of the new particles. Marseille
The measurement days were divided into days with new particle formation (event day) and into days without detectable secondary aerosol production. The median day-time variation during event and non-event days of median hygroscopic growth factor
spec-15
trum for the classified data is presented in Fig.10for 100 nm, 50 and 20 nm particles. Since the production of secondary particles was observed to take place during day-light hours, daytime median spectrum is presented. For the daytime variation, only data points with more than 3 contributing days were considered. Since several days were averaged, these results represent an average behaviour of hygroscopicity during
20
events at Plan d’Aups.
Hygroscopicity of 100 nm, initially dry ambient particles is, on average, larger than Aitken and nucleation mode particles during both non-events and event days. This is due to an increased curvature of the smaller particles (Kelvin effect) and thus their wa-ter vapour affinity is lower. This leads to lower growth factors (GF) for smaller particles,
25
if the composition remains the same for accumulation and Aitken mode particles. The hygroscopicity of 100 nm particles during event days increased from 1.4 to 1.6
ACPD
6, 8605–8647, 2006 Sub-micron atmospheric aerosol particles in the Mediterranean areaT. Pet ¨aj ¨a et al.:
Title Page Abstract Introduction Conclusions References Tables Figures J I J I Back Close
Full Screen / Esc
Printer-friendly Version Interactive Discussion
during the afternoon hours (Fig.10). A similar tendency was observed also in Aitken mode (50 nm) hygroscopicity as well as to a smaller extent also in nucleation mode (20 nm) particles. The nucleation mode GF had a maximum of 1.6 at 10:00 during event days. There was no peak in 50 nm particles during morning hours but it steadily decreased towards the minimum of 1.3 in the afternoon (15:00 LT).
5
The particles formed from gaseous precursors during the morning hours grew sub-sequently to larger sizes. The 20 nm particles had a maximum during the early stage of the nucleation mode growth. This indicates that the growth was dominated by a more hygroscopic compounds during the morning hours. During the afternoon hours the 20 nm growth factors decreased at the same time as the nucleation mode grew to
10
larger sizes. This is corroborated with a decrease of water uptake of the 50 nm par-ticles during the afternoon hours. Later in the afternoon the hygroscopicity increased during the event days again.
During the non-event days, the hygroscopicity tended to increase towards the evening in Aitken and nucleation modes. The accumulation mode GF remained
be-15
tween 1.45 and 1.55 during the daylight hours. The growth factor for 50 nm particles during non-event days in the morning was 1.25. In the morning of event days it was considerably higher (1.55). By the evening, the 50 nm GFs were at the same level (1.4) as compared with the event days.
To conclude, the diurnal cycle of Aitken mode particle hygroscopicity during event
20
and non-event days had different trends. During event days, the water uptake de-creased in the afternoon hours whereas during the non-event days the hygroscopicity increased. The material condensing onto the newly formed particles during their growth period enlarges also the pre-existing Aitken mode. Thus, during the afternoon of the event days, the dominant condensing species was less hygroscopic than the material
25
ACPD
6, 8605–8647, 2006 Sub-micron atmospheric aerosol particles in the Mediterranean areaT. Pet ¨aj ¨a et al.:
Title Page Abstract Introduction Conclusions References Tables Figures J I J I Back Close
Full Screen / Esc
Printer-friendly Version Interactive Discussion
Athens
The measurement days at Thrakomakedones were divided into the days without new particle formation (non event day) and into the days with secondary aerosol production (event days). The formation days were separated further into two categories based on the amount of urban pollution and meteorological situation. During the polluted
5
events, local wind velocities were low and city plume reached the measurement site at Thrakomakedones and the NOxconcentrations were up to 10 times higher than during the clean nucleation event days.
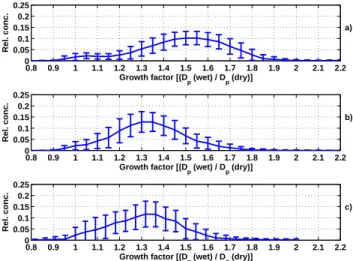
The median day-time variation during non-event, polluted and clean event days of median hygroscopic growth factor spectrum for the classified data is presented in
10
Fig. 11 for 50 nm, 20 and 10 nm particles. Again, only daytime data was included , since the production of secondary particles was observed to take place only during day-light hours. For the daytime variation, only data points with more than 2 con-tributing days were considered instead of 3 at Marseille. This is due lesser number of nucleation event days available.
15
Diurnal variation of water uptake of 50 nm particles during event days and non-event days is presented in Fig. 11. On average, the growth factors were constant for both cases. The absolute value was considerably lower during the event days (1.4 vs. 1.55). No significant daytime cycle was observed in any category for 50 nm size range. For 20 nm particles there were variability during daytime. In the morning of the clean event
20
days, the hygroscopicity of 20 nm particles was at a minimum of 1.0. During the morn-ing hours, the water uptake increased and was at maximum around noon (GF=1.4). After this, the hygroscopicity started to decrease and was 1.2 at 19:00.
Hygroscopicity of 10 nm particles is presented in Fig. 11. The concentration in this size range is close to a detection limit of the HTDMA setup, especially during non-event
25
days. The changes in hygroscopicity of 10 nm and 20 nm particles are reflected to prop-erties of condensable vapour as the mode of freshly formed particles grow through the HTDMA spectrum. During Athens campaign, new particles typically entered the size
ACPD
6, 8605–8647, 2006 Sub-micron atmospheric aerosol particles in the Mediterranean areaT. Pet ¨aj ¨a et al.:
Title Page Abstract Introduction Conclusions References Tables Figures J I J I Back Close
Full Screen / Esc
Printer-friendly Version Interactive Discussion
distribution between 9:00–10:00. During polluted events, the average growth rate was 5.5 nm h−1(Table2). Water soluble volume fraction at 11 for 10 nm particles was 1.03 calculated according toSwietlicki et al.(1999). Subsequently the 20 nm HTDMA data revealed external mixing during polluted events. At noon there was a less hygroscopic mode at 1.25 and more hygroscopic mode at 1.55 approximately in equal proportions.
5
During the course of the afternoon, growth factor for both modes decreased. At 14:00 the less hygroscopic mode was at GF=1.15 and the more hygroscopic at GF=1.4. After 15:00 the two modes merged at GF=1.35. This corresponds to soluble volume fraction of 0.66.
Based on Kulmala et al. (2001), this transforms into mass flux ratio (I1/I2) of 0.65
10
between insoluble (I1) and soluble (I2) material. In other words, the observed soluble volume fraction decrease between 10 nm and 20 nm during the nucleation mode growth can be explained, if the insoluble mass flux (I1) to the particulate phase is 65% of the soluble mass flux (I2). Thus, the growth due to water soluble components is larger than growth by water insoluble material.
15
During clean event days, the average growth rate of the nucleation mode was 2.3 nm h−1 (Table 2). The soluble volume fraction calculated from the median HT-DMA spectra for 10 nm particles at 13:00 was 1.12 and 20 nm growth factor (GF) at 17:00 was 0.49. This transforms to mass flux ratio of I1/I2=1.54 between the insoluble (I1) and soluble (I2) material. During the clean event days the growth due to
insolu-20
ble components was 54% larger than size increase by condensation of water soluble components.
5 Conclusions
Aerosol particle size distributions and hygroscopicity were measured at two Mediter-ranean locations in Athens and Marseille regions. Log-normal curves were fitted to the
25
observed distributions. New particle formation was observed during more than 30% of days both at Athens and Marseille. Also previous investigations at Plan d’Aups,
ACPD
6, 8605–8647, 2006 Sub-micron atmospheric aerosol particles in the Mediterranean areaT. Pet ¨aj ¨a et al.:
Title Page Abstract Introduction Conclusions References Tables Figures J I J I Back Close
Full Screen / Esc
Printer-friendly Version Interactive Discussion
Marseille, during summer 2001 indicated gas-to-particle conversion (Marinoni et al., 2005).
The sub-micron aerosol population at the Mediterranean area can be characterized as two to three modal distribution. There is persistent accumulation mode at both sites. Athens site was characterized as slightly larger accumulation mode. Aitken (25–80 nm)
5
and nucleation modes are more variable at both sites.
Urban pollution affected strongly the Athens site. During these pollution episodes Aitken mode particles (Dp30–80 nm) dominated the number concentration in the sub-micron range. The fact that the measurement location was in the border of the city induced a strong wind direction dependency on the total concentrations and size
dis-10
tribution parameters.
The hygroscopic properties of aerosol population vary as a function of daytime and as a function of size. External mixing was observed both at Athens and Marseille. Hy-drophobic mode was present at both sites, with a contribution between 6–10%. More hygroscopic particles had a largest contribution during all observation. The grand
aver-15
aged peak value varied from 1.3 and 1.45 for 50 nm particles at Marseille and Athens, respectively, indicating differences in the average chemical composition between the measurement sites.
New particle formation events seems to be related to sulphuric acid formation and also related to small condensation sink. The higher the condensation sink the higher
20
fraction of clusters will coagulate to pre-existing aerosol particles and they will never grow up to 3 nm. The importance of solar radiation is also seen from the results: there were no events during rainy or cloudy days.
Anthropogenic influence to the properties of newly formed particles was evident dur-ing Athens campaign. As the event days were divided into two categories based on
25
dominant wind direction and gaseous pollutant levels, hygroscopic growth factor evo-lution revealed differences between the properties of condensing vapours. In a case of weak anthropogenic influence, the contribution of water insoluble material to nucle-ation mode growth was larger than by water insoluble components. On the other hand,
ACPD
6, 8605–8647, 2006 Sub-micron atmospheric aerosol particles in the Mediterranean areaT. Pet ¨aj ¨a et al.:
Title Page Abstract Introduction Conclusions References Tables Figures J I J I Back Close
Full Screen / Esc
Printer-friendly Version Interactive Discussion
during the polluted days the size increase from 10 nm to 20 nm was controlled by water soluble components. Corresponding mass flux ratios were 1.54 and 0.65 for clean and polluted event days, respectively. Previously,Stolzenburg et al.(2005) was able to ex-plain almost all the nucleation mode growth by water soluble sulphuric acid in polluted Atlanta atmosphere. On the other hand, a study by Boy et al. (2005) attributed only
5
10% of the observed growth to sulphuric acid.
Our results add to the information on the evolution of aerosol size distribution in the sub-micron size range in the Mediterranean Area. The observed hygroscopic proper-ties and characteristics of new particle formation events gives new insight on atmo-spheric chemistry and physics near Athens and Marseille. The size distribution and
10
hygroscopicity data set can be used in the regional air quality and global aerosol mod-els.
Acknowledgements. This work was supported by the Academy of Finland and the EU
5th Frame Programme within contract EVK2-CT-2001-00107 through the project “Biogenic Aerosols and Air Quality in the Mediterranean Area” (BOND). Help of D. Robin and the rest of 15
AIRMARAIX staff during the Marseille campaign and J. Bartzis and the staff of NCSR Demokri-tos during the Athens campaign are greatly appreciated. N. Gounaris (NCSR DemokriDemokri-tos) is acknowledged for production of the maps. NOAA Air Resources Laboratory (ARL) is acknowl-edged for the provision of the HYSPLIT transport and dispersion model and READY website
(http://www.arl.noaa.gov/ready.html) used in this publication. S. Lance is acknowledged for
20
revising the language.
References
Aalto, P., H ¨ameri, K., Becker, E., Weber, R., Salm, J., M ¨akel ¨a, J. M., Hoell, C., O’Dowd, C. D., Karlsson, H., Hansson, H.-C., V ¨akev ¨a, M., Koponen, I. K., Buzorius, G., and Kulmala, M.: Physical characterization of aerosol particles during nucleation events, Tellus, 53B, 344–358, 25
2001. 8609
in-ACPD
6, 8605–8647, 2006 Sub-micron atmospheric aerosol particles in the Mediterranean areaT. Pet ¨aj ¨a et al.:
Title Page Abstract Introduction Conclusions References Tables Figures J I J I Back Close
Full Screen / Esc
Printer-friendly Version Interactive Discussion
organic aerosol components from hygroscopic properties of submicrometer particles during a field study in the Lower Fraser Valley, Aerosol Sci. Technol., 38, 140-154, 2004. 8610
Baron, P. and Willeke, K.: Aerosol Measurement: Principles, Techniques, and Applications, 2nd edition, John Wiley and Sons, 2001. 8611
Bastin, S., Drobinski, P., Dabas, A., Delville, P., Reitebuch, O., and Werner, C.: Impact of the 5
Rh ˆone and Durance valleys on sea-breeze circulation in the Marseille area, Atmos. Res., 74, 303–328, 2005. 8613
Bilde, M. and Svenningsson, B.: CCN activation of slightly soluble organics: the importance of small amounts of inorganic salt and particle phase, Tellus, 56B, 128–134, 2004. 8607
Boy, M., Kulmala, M., Ruuskanen, T. M., Pihlatie, M., Reissell, A., Aalto, P. P., Keronen, P., 10
Dal Maso, M., Hellen, H., Hakola, H., Janson, R., Hanke, M., and Arnold, F., Sulphuric acid closure and contribution to nucleation mode particle growth, Atmos. Chem. Phys., 5, 863–878, 2005. 8624,8629
Brunekreef, B. and Holgate, S.: Air pollution and health, The Lancet, 360, 1233–1242, 2002.
8606
15
Cabada, J., Khlystov, A., Wittig, A., Pilinis, C., and Pandis, S.: Light scattering by fine particles during the Pittsburgh Air Quality Study: Measurements and modeling, J. Geophys. Res., 109, D16S03, doi:10.1029/2003JD004155, 2004. 8606
Cachier, H., Aulagnier, F., Sarda, R., Gautier, F., Masclet, P., Besombes, J.-L., Marchand, N., Despiau, S., Croci, D., Mallet, M., Laj, P., Marinoni, A., Deveau, P.-A., Roger, J.-C., Putaud, 20
J.-P., Van Dingenen, R., Dell’Acqua, A., Viidanoja, J., Martins-Dos Santos, S., Liousse, C., Cousin, F., Rosset, R., Gardrat, E., and Galy-Lacaux, C.: Aerosol studies during the ES-COMPTE: an overview, Atmos. Res., 74, 547–563, 2005. 8607
Carrico, C., Kreidenweis, S., Malm, W., Day, D., Lee, T., Carillo, J., McMeeking, G., and Collett Jr., J.: Hygroscopic growth behavior of a carbon-dominated aerosol in Yosemite National 25
Park, Atmos. Environ., 39, 1393–1404, 2005. 8610
Chaloulakou, A., Kassomenos, P., Spyrellis, N., Demokritou, P., and Koutrakis, P.: Measure-ments of PM10 and PM2.5 particle concentrations in Athens, Greece, Atmos. Environ., 37, 649–660, 2003. 8608
Colbeck, I., Chung, M. C., and Eleftheriadis, K.: Formation and transport of atmospheric 30
aerosol over Athens, Greece, Water Air Soil Pollut. Focus, 2, 223–235, 2002. 8608
Corsmeier, U., Behrendt, R., Drobinski, P., and Kottmeier, C.: The mistral and its effects on air pollution transport and vertical mixing, Atmos. Res., 74, 275–302, 2005. 8613
ACPD
6, 8605–8647, 2006 Sub-micron atmospheric aerosol particles in the Mediterranean areaT. Pet ¨aj ¨a et al.:
Title Page Abstract Introduction Conclusions References Tables Figures J I J I Back Close
Full Screen / Esc
Printer-friendly Version Interactive Discussion
Cros, B., Durand, P., Cachier, H., Drobinski, P., Frejafon, E., Kottmeier, C., Perros, P., Peuch, V.-H., Ponche, J.-L., Robin, D., Said, F., Toupance, G., and Wortham, H.: The ESCOMPTE program: an overview, Atmos. Res., 69, 241–279, 2004. 8607
Dal Maso, M., Kulmala, M., Riipinen, I., Wagner, R., Hussein, T., Aalto, P., and Lehtinen, K.: Formation and Growth of Fresh Atmospheric Aerosols: Eight Years of Aerosol Size Distribu-5
tion Data from SMEAR II, Hyyti ¨al ¨a, Finland, Boreal Env. Res., 10, 323–336, 2005. 8611,
8612,8622
Draxler, R. and Rolph, G.: HYSPLIT (HYsplit Single-Particle Lagrangian Intregrated Trajectory) model, Website (http://www.arl.noaa.gov/ready/hysplit4.html), NOAA Air Resources Labora-tory, Silver Spring, MD., USA, 2003. 8613,8616
10
Flocas, H., Assimakopoulos, V., Helmis, C., and G ¨usten, H.: VOC and O3distributions over the densely populated area of greater Athens, Greece, J. Appl. Meteorol., 42, 1799–1810, 2003.
8608
Flocas, H., Assimakopoulos, V. D., and Helmis, C. G.: An experimental study of aerosol dis-tribution over a Mediterranean urban area, Sci. Tot. Environ. 367, 872–887, 2006. 8608, 15
8617
Grivas, G., Chaloulakou, A., Samara, C., and Spyrellis, N.: Spatial and temporal variation of PM10mass concentrations within the greater area of Athens, Greece, Water Air Soil Pollut.,
158, 357–371, 2004. 8608
H ¨ameri, K., V ¨akev ¨a, M., Hansson, H.-C., and Laaksonen, A.: Hygroscopic growth of ultrafine 20
ammonium sulphate aerosol measured using an ultrafine tandem differential mobility anal-yser., J. Geophys. Res., 105, 22 231–22 242, 2000. 8610
Hussein, T., Dal Maso, M., Pet ¨aj ¨a, T., Koponen, I., Paatero, P., Aalto, P., H ¨ameri, K., and Kulmala, M.: Evaluation of an automatic algorithm for fitting the particle number size distri-butions, Boreal Env. Res., 10, 337–355, 2005. 8611,8614
25
Janh ¨all, S. and Hallquist, M.: A novel method for determination of size-resolved, submicrometer particle traffic emission factors, Environ. Sci. Technol., 39, 7609–7615, 2005. 8607
Jokinen, V. and M ¨akel ¨a, J. M.: Closed loop arrangement with critical orifice for DMA sheath/excess flow system, J. Aerosol Sci., 28, 643–648, 1997. 8609
Kittelson, D., Watts, W., and Johnson, J.: Nanoparticle emissions on Minnesota highways, 30
Atmos. Environ., 38, 9–19, 2004. 8606,8607
Kulmala, M., Dal Maso, M., M ¨akel ¨a, J., Pirjola, L., V ¨akev ¨a, M., Aalto, P., Miikkulainen, P., H ¨ameri, K., and O’Dowd, C.: On the formation, growth and composition of nucleation mode
ACPD
6, 8605–8647, 2006 Sub-micron atmospheric aerosol particles in the Mediterranean areaT. Pet ¨aj ¨a et al.:
Title Page Abstract Introduction Conclusions References Tables Figures J I J I Back Close
Full Screen / Esc
Printer-friendly Version Interactive Discussion
particles, Tellus B, 53, 479–490, 2001. 8612,8627
Kulmala, M.: How Particles Nucleate and Grow, Science, 302, 1000–1001, 2003. 8623
Kulmala, M., Laakso, L., Lehtinen, K., Riipinen, I., Dal Maso, M., Anttila, T., Kerminen, V.-M., H ˜orrak, U., Vana, M., and Tammet, H.: Initial steps of aerosol growth, Atmos. Chem. Phys., 4, 2553–2560, 2004a. 8624
5
Kulmala, M., Vehkam ¨aki, H., Pet ¨aj ¨a, T., Dal Maso, M., Lauri, A., Kerminen, V.-M., Birmili, W., and McMurry, P.: Formation and growth rates of ultrafine atmospheric particles: a review of observations, J. Aerosol Sci., 35, 143–176, 2004b. 8606,8622
Kulmala, M., Pet ¨aj ¨a, T., M ¨onkk ¨onen, P., Koponen, I., Dal Maso, M., Aalto, P., Lehtinen, K., and Kerminen, V.-M.: On the growth of nucleation mode particles: source rates of condensable 10
vapor in polluted and clean environments, Atmos. Chem. Phys., 5, 409–416, 2005. 8623
Laaksonen, A., Hamed, A., Joutsensaari, J., Hiltunen, L., Cavalli, F., Junkermann, W., Asmi, A., Fuzzi, S., and Facchini, M, C.: Cloud condensation nucleus production from nucleation events at a highly polluted region, Geophys. Res. Lett., 32, L06812, doi:10.1029/2004GL022092, 2005. 8607,8620
15
Marinoni, A., Laj, P., Deveaux, P., Marino, F., Ghermandi, G., Aulagnier, F., and Cachier, H.: Physicochemical properties of fine aerosols at Plan d’Aups during ESCOMPTE, Atmos. Res., 74, 565–580, 2005. 8607,8614,8620,8621,8628
Mertes, S., Schr ¨oder, F., and Wiedensohler, A.: The particle detection efficiency curve of the TSI-3010 CPC as a function of temperature difference between saturator and condenser, 20
Aerosol Sci. Technol., 23, 257–261, 1995. 8611
M ¨onkk ¨onen, P., Koponen, I., Lehtinen, K., H ¨ameri, K., Uma, R., and Kulmala, M.: Measure-ments in a highly polluted Asian mega city: observations of aerosol number size distribution, modal parameters and nucleation events, Atmos. Chem. Phys., 5, 57–66, 2005. 8623
O’Dowd, C.: Biogenic coastal production and its influence on aerosol radiative properties, J. 25
Geophys. Res., 106, 1545–1549, 2001. 8607
Peng, C., Chan, M., and Chan, C.: The hygroscopic properties of dicarboxylic and multifunc-tional acids: measurements and UNIFAC predictions, Environ. Sci. Tech., 35, 4495–4501, 2001. 8610
Putaud, J.-P., Raes, F., Van Dingenen, R., Br ¨uggemann, E., Facchini, M.-C., Decesari, S., 30
Fuzzi, S., Gehrg, R., G ¨uglin, C., Laj, P., Lorbeer, G., Maenhaut, W., Mihalopoulos, N., M ¨uller, G., Querol, X., Rodriguez, S., Schneider, J., Spindler, G., ten Brink, H., Tørseth, K., and Wiedensohler, A.: A European aerosol phenomenology – 2: chemical characteristics of