HAL Id: hal-00981540
https://hal-enpc.archives-ouvertes.fr/hal-00981540
Submitted on 22 Apr 2014HAL is a multi-disciplinary open access
archive for the deposit and dissemination of sci-entific research documents, whether they are pub-lished or not. The documents may come from teaching and research institutions in France or abroad, or from public or private research centers.
L’archive ouverte pluridisciplinaire HAL, est destinée au dépôt et à la diffusion de documents scientifiques de niveau recherche, publiés ou non, émanant des établissements d’enseignement et de recherche français ou étrangers, des laboratoires publics ou privés.
pollutant loads: Feedback on experimental catchments
within Paris conurbation.
Adèle Bressy, Marie-Christine Gromaire, Catherine Lorgeoux, Mohamed Saad,
Florent Leroy, Ghassan Chebbo
To cite this version:
Adèle Bressy, Marie-Christine Gromaire, Catherine Lorgeoux, Mohamed Saad, Florent Leroy, et al.. Efficiency of source control systems for reducing runoff pollutant loads: Feedback on experimental catchments within Paris conurbation.. Water Research, IWA Publishing, 2014, 57C, pp.234-246. �10.1016/j.watres.2014.03.040�. �hal-00981540�
Efficiency of source control systems for reducing runoff pollutant
1loads: Feedback on experimental catchments within Paris conurbation
2Adèle BRESSYa,1, Marie-Christine GROMAIREa, Catherine LORGEOUXa,2, Mohamed 3
SAADa, Florent LEROYa, Ghassan CHEBBOa 4
a Université Paris-Est, Leesu (UMR-MA-102), UPEC, ENPC, AgroParisTech, F-77455 Marne-la-Vallée Cedex 2
5 6
Highlights: 7
SUDS designed for peak flow control were monitored (flow, organic pollutants, metals) 8
Volume and contaminant loads were reduced by all SUDS even for ordinary events 9
Efficiency of SUDS depends strongly on the type of storage and its general conception 10
Strong reliance between pollutant mitigation and water volume reduction 11
Runoff reduction-oriented design of SUDS: an efficient solution for pollutant mitigation 12
13
Abstract: 14
Three catchments, equipped with sustainable urban drainage systems (SUDS: vegetated roof, 15
underground pipeline or tank, swale, grassed detention pond) for peak flow mitigation, have 16
been compared to a reference catchment drained by a conventional separate sewer system in 17
terms of hydraulic behaviour and discharged contaminant fluxes (organic matter, organic 18
micropollutants, metals). A runoff and contaminant emission model has been developed in 19
order to overcome land use differences. It has been demonstrated that the presence of peak 20
flow control systems induces flow attenuation even for frequent rain events and reduces water 21
discharges at a rate of about 50 % depending on the site characteristics. This research has also 22
1 Corresponding author 2
Present adress: G2R UMR-7566 CNRS/Université Henri Poincaré, BP 239, 54506 Vandœuvre-lès-Nancy Cedex, France
E-mail adresses: [email protected] (A. Bressy), [email protected] (M.-C. Gromaire), [email protected] (C. Lorgeoux), [email protected] (M. Saad), [email protected] (F. Leroy), [email protected] (G. Chebbo)
demonstrated that this type of SUDS contributes to a significant reduction of runoff pollutant 23
discharges, by 20 % to 80 %. This level of reduction varies depending on the considered 24
contaminant and on the design of the drainage system but is mostly correlated with the 25
decrease in runoff volume. It could be improved if the design of these SUDS focused not only 26
on the control of exceptional events but also targeted more explicitly the interception of 27
frequent rain events. 28
Keywords: flooding source control system; frequent rain event; micropollutants; stormwater; 29 SUDS 30 31 1. Introduction 32
Stormwater management has become a critical issue in the field of sustainable urban 33
development to protect civil society against flood and because runoff on urban surfaces has 34
been recognised as a major cause of the degradation of receiving waters (Burton and Pitt, 35
2001). In the past, stormwater was collected by drainage networks, but with fast urbanization 36
these networks have become inadequate, leading local authorities to develop strategies to 37
prevent flooding. 38
The first strategy adopted was the large-scale management of urban drainage systems by 39
building large reservoirs. It was not sufficient to remove the flooding risks and now a local 40
stormwater management approach is preferred (Brombach et al., 2005; Ellis and Revitt, 2010; 41
Jefferies et al., 2009; Roy et al., 2008). In recently urbanised areas, facilities are developed 42
simultaneously to the urban growth promoting retention or infiltration at a small scale. These 43
facilities are often called “Sustainable Urban Drainage Systems” (or SUDS). Two major types 44
of SUDS design are used worldwide: flow rate regulation and volume regulation. Both in 45
France and in the USA, the most widespread regulation is based on a limited flow rate value 46
(Petrucci et al., 2013; Roy et al., 2008). For example in the French department Seine Saint-47
Denis, in the suburb of Paris, the local authorities have imposed a flow rate regulation at 48
10 l/s/ha since 1993 (DEA, 1992). Thus SUDS are typically intended to facilitate hydraulic 49
management and have been designed for exceptional precipitation events; only on rare 50
occasion are contamination mitigation objectives actually addressed (Martin et al., 2007). 51
Studies have revealed that such SUDS are capable of: reducing the discharged volumes, 52
delaying catchment response, slowing flow velocities and increasing water residence time 53
within the various facilities (Jefferies et al., 2004; Scholes et al., 2008). Thus they can have a 54
substantial impact on the pollutant fluxes being conveyed by stormwater and discharged into 55
receiving waters. Purifying effects have indeed been observed at the system scale for several 56
types of SUDS (Jefferies et al., 2004; Pagotto et al., 2000; VanWoert et al., 2005). However, 57
there are few studies highlighting the overall effect of SUDS on pollutant fluxes control, at a 58
suburban catchment scale. The effect of SUDS that were designed for flow control and not 59
pollutant control remains poorly documented. Moreover literature data is usually limited to 60
metals and nutrients and few data is available on organic micropollutants (Diblasi et al., 2009; 61
Matamoros et al., 2012). 62
Therefore, the objective of this research is to assess the effect of peak flow control policies, 63
on the water and contaminant flows discharged during frequent rain events at a small 64
catchment scale. A special attention has been given to a selection of priority substances listed 65
in the Water Framework Directive (2000/60/EC), whose presence is significant in runoff 66
(Bressy et al. 2012), but whose fate in SUDS is not much documented to date. Three 67
catchments containing SUDS were compared to a reference catchment featuring a 68
conventional separate sewer network, in terms of hydraulic behaviour and discharged 69
contaminant fluxes (i.e., suspended solids (SS), organic carbon (OC), trace metals (copper, 70
lead, zinc) and organic micropollutants: polycyclic aromatic hydrocarbons (PAHs), 71
polychlorinated biphenyls (PCBs), and alkylphenols). Moreover, the deposits formed in 72
storage zones were characterised so as to better understand the fate of micropollutants during 73
their transfer and in order to devise the best strategy for recovering and treating these wastes. 74
75
2. Materials and methods 76
2.1 Site characterisation
77
A residential site, characterised by low-density traffic and no industrial activity within a 5-km 78
radius, was studied in a suburban area near Paris (France). The site was drained by a separate 79
sewer system. Land use on this site was quite homogenous, while the stormwater 80
management system featured a wide diversity. 81
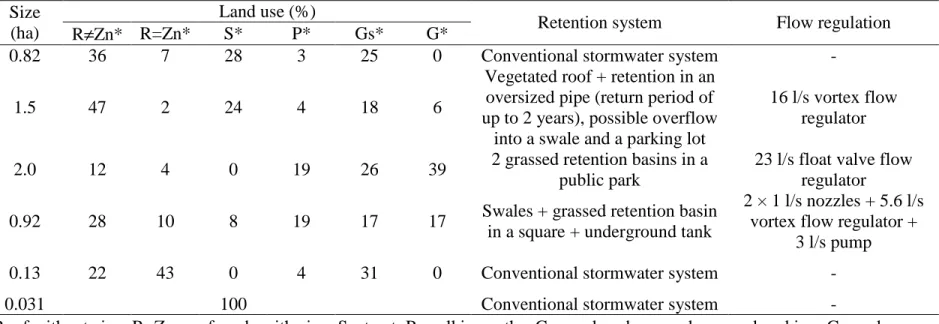
On this site, four small catchments ranging from 0.8 ha to 1.9 ha were studied. The 82
"Reference" catchment was drained by a conventional separate sewer system, while the other 83
three catchments ("North", "Park" and "South") temporarily stored stormwater in various 84
SUDS to comply with the 10 l/s/ha flow limitation imposed by local authorities. Stormwater 85
on the North catchment was stored in a vegetated roof and in an underground pipeline for 86
common rain events (up to 1 year return period) with an overflow onto a swale or on parking 87
for exceptional events. In the Park catchment, stormwater was stored in a grassed detention 88
pond that is part of a public garden. Stormwater management on the South catchment had 89
been incorporated into the land use plan and the practices associated various types of storage 90
facilities: underground tank for private parcels, swales and a public square covered by grass. 91
The outlets of the catchments with SUDS are fitted with flow-rate regulators as usual in 92
France (Table 1). According to Martin et al. (2007), these SUDS were representative of the 93
kinds of solutions adopted in France. 94
The characteristics of the catchments are listed in Table 1. The four catchments displayed a 95
homogeneous pattern of urbanisation and were located adjacent to one another (less than 96
400 m between two catchments), ensuring a relative homogeneity as regards atmospheric 97
contributions (i.e. rainfall and deposits). Differences in land use breakdown appeared across 98
these four catchments. The breakdown of the North catchment was similar to the Reference, 99
though automobile traffic was heavier on North due to the presence of retail shops. The Park 100
catchment was mainly composed of buildings and gardens and contains no streets. The South 101
catchment was relatively devoid of streets and contained a higher density of pedestrian paths 102
than the Reference. Consequently, the discharges for these four catchments could not be 103
directly compared and required introducing a set of land use-based modelling tools. 104
With the objective of establishing a model, the potential contaminant entry paths (atmospheric 105
fallout, pavement runoff and runoff from built parcels) were also examined. Atmospheric 106
fallout was measured on the flat roof of the highest building within the study area. Both types 107
of runoff (street and built parcel, i.e., roof and a private garden above slab underground 108
parking) were evaluated on the Reference catchment. The characteristics of these two sub-109
catchments are provided in Table 1 and described with greater details in Bressy et al. (2011). 110
111
2.2 Rainfall and flow measurements
112
Rainfall and flows at the four catchment outlets were continuously measured (every 0.2 mm 113
for the rain and every minute for the flow) for one year between July 2008 and August 2009. 114
115
2.2.1 Instrumentation
116
Rainfall depth was recorded using a rain gauge (3029, Alcyr) placed on a flat roof in the study 117
area. Runoff flows were measured at the Reference catchment outlet with a Sigma 950 flow-118
meter (water depth with a bubble pipe and velocity by Doppler Effect). At the source-119
controlled catchment outlets, runoff flows were measured just beyond the flow regulation 120
device with Sigma 950 flow-meters, by recording the water depth upstream of a V-notch weir. 121
2.2.2 Definition of a rain event
123
A rain event was defined as any precipitation leading to a flow signal. The beginning of an 124
event was the time of the first precipitation data point during the 20 minutes preceding 125
initiation of the flow signal for the Reference site and during the preceding 3 hours for the 126
other three sites. The end of the event was defined as the time of the last precipitation data 127
point during the flow signal period. 128
The following parameters were determined for each rain event: 129
- Peak flow: Qmax (in l/s/ha) was the maximum flow value during the rain event; 130
- Lag time: Tlag (h) was the time delay between maximum precipitation intensity and 131
peak flow signal; 132
- Emptying time: Tempty (h) was the time delay between the end of precipitation and the 133
end of the flow signal; 134
- Runoff water depth: Hrunoff (mm) was the effective water depth discharged by the 135
catchment during the rain event. 136
137
2.3 Sampling protocol and analytical procedure
138
2.3.1 Water sampling protocol
139
Both dry and wet bulk atmospheric depositions were sampled using 20-L bottles hermetically 140
connected to a 1-m² stainless pyramidal funnel. The bottles were placed underneath the funnel 141
just before the rain event and removed just afterward; they collected the wet deposition and 142
the washoff of the contaminants deposited on the funnel during the previous dry weather 143
period. Stormwater was collected from the storm sewer at the catchment outlet using 144
automatic samplers (Bühler 1029) controlled via the flow meter. The sampling protocol was 145
flow-proportional so as to obtain average concentrations throughout the event. 146
The campaigns conducted in order to analyse both organic contaminants (requiring the use of 147
glass bottles) and metals (plastic bottles) were based on different sets of events. SS and 148
organic matter were measured for all the events in glass or plastic bottles, but in this paper 149
only SS and TOC data for rain events sampled simultaneously on atmospheric fallout, built 150
parcel and street catchments were used. Table 2 provides the characteristics of the rain events 151
considered for each parameter. 152
153
2.3.2 Soil and sediment sampling protocol
154
Sediment deposits were observed and sampled both in the North catchment storage pipe and 155
upstream of the South catchment regulator. Several samples were collected in order to 156
constitute a representative average sample of the sediment deposit. Average samples were 157
reduced by quartering steps after homogenization. The soil of the public garden used as 158
storage on Park catchment was also sampled. The retention basin surface was divided into 159
three areas according to flooding frequency: one flooded at each rain event, another 160
occasionally flooded and the last area was very seldom flooded. To constitute the average soil 161
sample, 4 to 6 samples were collected in each area using a (20-cm long) corer, in following a 162
7-m2 mesh grid pattern, and then combined. One sample was analysed in triplicate for a 163
variability assessment: the signal deviation was below 20%. 164
165
2.3.3 Micropollutant analysis
166
The analytical procedures applied for organic compounds were previously described by 167
Bressy et al. (2012). Briefly, it was based on separating the dissolved and particulate fractions 168
(threshold: 0.45 µm). Dissolved fraction was extracted on a SPE C18 cartridge, while a 169
microwave-assisted extraction procedure was applied to the particulate fraction. The three 170
pollutant families (PCBs, PAHs and alkylphenols) were then separated during a purification 171
step on silica columns. Contaminants were quantified by internal calibration using gas 172
chromatography coupled with mass spectrometry (GC/MS, Focus DSQ, ThermoFisher 173
Scientific). Results are displayed as the sum of 13 PAHs3 (deriving from the US EPA list, 174
excluding naphthalene, acenaphthene and acenaphthylene, which are too volatile to be 175
correctly quantified), along with the sum of the 7 PCB indicators4. Among alkylphenols, 176
nonylphenols (NPs) and octylphenols (OPs) were studied. 177
Trace metals were analysed in both the total and dissolved fractions. Raw samples were 178
microwave acid-digested at 95°C with nitric and hydrochloric acids. Filtered samples on 179
0.45 m cellulose acetate membranes were acidified to pH 1 with nitric acid. Metal 180
concentrations were determined using Inductively Coupled Plasma Atomic Emission 181
Spectroscopy (ICP-AES, Varian Vista MPX) through external calibration with a multi-182
element standard solution (PlasmaNorm Multi-Elements). 183
The analytical uncertainties and the detection limits are given in Table S.1 in supplementary 184
files. 185
186
2.4 Methodology used for site comparisons
187
The various land use breakdowns did not exhibit the same runoff coefficient and moreover 188
did not produce the same pollutant quantities. Consequently a direct comparison of water and 189
contaminant fluxes between the Reference site and sites equipped with SUDS proved to be an 190
impossible task. 191
A water and contaminant emissions model was developed for each type of land use relative to 192
the Reference catchment. Then this model was applied to the land use breakdowns of each 193
catchment equipped with SUDS in order to simulate what the catchment behaviour would 194
have been in the absence of flow regulation. This methodology is shown Fig.1 and explained 195
3 Fluorene, phenanthrene, anthracene, fluoranthene, pyrene, benzo[a]anthracene, chrysene, benzo[b]fluoranthene, benzo[k]fluoranthene, benzo[a]pyrene, indeno[1,2,3]pyrene, di-benzo[a,h]anthracene, and benzo[g,h,i]perylene. 4
below. It is important to note that our methodology did not aim an accurate simulation of the 196
pollutant masses but the estimation of SUDS effectiveness. For this purpose, the pollutant 197
masses were simulated using low assumptions for sources, which allows to be sure that SUDS 198
effect on pollutants is not overrated. 199
200
2.4.1 Tool for runoff volume simulation
201
The aim of this model was to simulate the runoff volume that would have been produced with 202
conventional drainage systems based on the rainfall depth and land use dataset. The model 203
was adapted from Berthier et al. (2001) and distinguished 3 types of surfaces: roofs, streets 204
and gardens. 205
The initial losses on roofs and streets were modelled by a surface storage depth IL (mm). The 206
filling level of this surface storage at the beginning of a rain event depended on the amount of 207
rainfall during the previous 3 hours (H3h in mm) for roofs and previous 6 hours (H6h in mm) 208
for streets. Infiltration through the street’s pavement was modelled using a constant 209
infiltration rate Kinf,s (in mm/h). If H is the rainfall depth (mm), Train the rain event duration 210
(h) and Ar and As the proportions of roof and street surface areas on the catchment, the runoff 211
water depth (Hrunoff in mm) was given by: 212
For roof runoff: Hrunoff,r =
[
H−max{
ILr −H3h;0}
]
.Ar Equation 1 213For street runoff: 214
If ILs >H6h, then: Hrunoff,s =max
{
H −(ILs −H6h)−Kinf,s.Train;0}
.As Equation 2 215otherwise: Hrunoff,s =max
{
H−Kinf,s.Train;0}
.As216
Private gardens above underground parking (50 to 100 cm soil) with drainage systems were 217
modelled as a storage depth ILg (mm), with their filling level at the beginning of the event
218
being dependent on rainfall quantity over the previous 6 days (H6d in h). The storage filling
219
rate during the rain event was modelled by a constant infiltration rate Kinf,g;
evapotranspiration was not included in this modelling set-up. If Ag is the proportion of
221
gardens covering the catchment, the runoff water depth from private gardens (Hrunoff,g in mm)
222
was given by: 223
If ILg >H6d, then: Hrunoff,g =max
{
H −min{
ILg −H6d;Kinf,g.Train}
;0}
.Ag Equation 3 224otherwise: Hrunoff,g =H.Ag
225
The runoff water depth from the public garden was assumed to equal zero because, in a 226
conventional system, it would not have been connected to the sewer system. 227
The five model parameters (ILr, ILs, ILg, Kinf,s and Kinf,g) were calibrated using rainfall and
228
flow data over a 12-month period from the Reference catchment, by means of minimising the 229
sum of absolute error values. The calibrated parameter values listed in Table 3 lie within the 230
same interval as those found in the literature (Berthier et al., 2001). 231
232
2.4.2 Tool for micropollutant simulation
233
The objective of this tool was to simulate contaminant emissions from catchments equipped 234
with SUDS as if these catchments were being drained with a conventional sewerage system. 235
The principle consisted, for the sum of sampled events i (Cf. Table 2), of comparing the mass 236
measured at the outlet ( M ) with the mass simulated by summing the masses input via the 237
various entry paths ( M ) according to the equations 4 and 5. The validation of the tool was 238
done with the Reference data. 239
∑
⋅ = i i i Ref V C M , Equation 4 240[
]
∑
⋅
⋅
⋅
+
⋅
⋅
+
⋅
⋅
+
⋅
=
+
+
=
i g i g r i r i build s i s i s p i s i atm i building street pathS
CR
S
CR
C
S
CR
C
S
CR
C
H
M
M
M
M
)
(
, , , , , , , 241Where, for the event i, Hi is the rainfall depth; CRef,i, Catm,i, Cs,i, Cbuild,i the concentrations from Reference
242
catchment outlet, atmospheric deposit, street runoff and building runoff according to Bressy et al. (2012);
i s
CR , , CRr,i, CRg,i the runoff coefficients calculated from the volumes simulated section 2.4.1 for street,
244
roof and garden above underground parking; Sp, Ss, Sg the surfaces of path, street and garden; and Vi the
245
water volume measured at Reference catchment outlet.
246
For zinc introduced via roofing materials, the corrosion models described in Gromaire et al. 247
(2011) were used, distinguishing the zinc roofs of other: 248
(
)
∑
+
⋅
⋅
⋅
+
⋅
+
⋅
+
⋅
⋅
⋅
=
+
+
+
=
≠ = ≠ i i corrosion s i s i s i tot zinc r i r g i g p i s i atm i tot zinc building zinc building street pathM
S
CR
C
H
S
CR
S
CR
S
CR
C
H
M
M
M
M
M
, , , , , , , , , Equation 5 249Where, for the event i, Sr=zinc and Sr≠zinc are the roof surfaces with zinc and without and Mcorrosion,i the mass
250
from corrosion (Gromaire et al., 2011).
251
To avoid overestimating the simulated masses when data from Reference were missing due to 252
technical problems, i.e., to avoid overvaluing the SUDS effect during comparisons with 253
measurements, the simulated values were deliberately minimised by adopting hypotheses 254
based on entry path concentrations and runoff volumes. Only atmospheric input was 255
considered for PCB assuming the recent buildings or cars do not release them. For PAHs and 256
alkylphenols, when concentrations from road runoff were missing, the lowest measured value 257
was used. Uncertainties on model results induced by input data uncertainty (especially 258
measurement uncertainty on experimental data) were estimated with the law of propagation of 259
uncertainties (explanation in supplementary files Annexe A.1). 260
261
3. Results and discussion
262
3.1 Performance of the simulation tools
263
The errors and relative errors between simulated and measured Hrunoff values are shown in
264
Figure 2. Over a one-year period, model behaviour proved to be satisfactory (0.1% error 265
between simulated and measured annual volumes) since the simulations have yielded good 266
results for the events producing the majority of yearly discharged water volume (60% of 267
events were simulated with a margin of error less than ±30%, representing 80% of total 268
annual rainfall). To minimise errors, this model was always applied to the sum of studied 269
events, i.e., over the year for hydraulic simulation and over the sampled events for 270
micropollutant simulation. 271
Table 4 offers a comparison, for the Reference catchment, of measured mass vs. simulated 272
mass when aggregated over all sampled events (using Table 2 data). The simulated values lie 273
within the uncertainty of the corresponding measurement values (uncertainty on both water 274
volume and concentration measurements). This uncertainty does not cover scenario 275
uncertainty according to the classification described by Warmink et al. (2010) since the 276
scenario with the lowest value was initially chosen for sources. Our goal was not to develop a 277
model to simulate actual masses of pollutant but to assess the SUDS effect. This choice 278
allowed us to minimize the measured masses and therefore to avoid overestimation of the 279
SUDS efficiency. 280
281
3.2 Effects of source control systems on discharged water
282
3.2.1 Flow dynamics at the event scale
283
Flow dynamics were studied for all rain events between July 2008 and August 2009. Over this 284
period, 140 events could be distinguished on the Reference catchment (100 on North, 77 on 285
Park and 114 on South). The difference in number of events across catchments was due to the 286
slower dynamics of source-controlled catchments for which one event might correspond to 287
several for Reference. These results have been analysed with a focus on frequent rain events, 288
which represent most part of annual runoff volumes. 289
290
Peak flow reduction (see Fig. 3): 292
For Reference, Qmax spanned a wide range of values (0.2 to 209 l/s/ha as the 1st and 9th
293
deciles), yet it remained below 10 l/s/ha for 69% of rain events suggesting that for the 294
majority of rain events the 10 l/s/ha regulatory flow threshold did not necessarily imply water 295
retention. The situation would be quite different with lower thresholds: for instance, the 296
2 l/s/ha level would be exceeded for 66% of events. 297
Figure 3 provides a peak flow reduction for all source-controlled catchments. This effect was 298
observed for almost all rain events, even ordinary rainfall episodes whose flow did not reach 299
the nominal regulator flow (10 l/s/ha). The flow rate actually exceeded 2 l/s/ha for 19% and 300
13% of events at the North and Park outlets. At the South outlet, flow exceeded 2 l/s/ha for 301
63% of events; consequently, source control systems in place at the South site caused less 302
impact on frequent rain events. 303
In the case of North catchment, peak flows were mainly controlled by the flow regulator. 304
However, for Park and South catchments, the level required for the initiation of the regulator 305
was not reached for most rain event and peak flow attenuation was due to the natural retention 306
time in the garden and in the swales. 307
308
Staggering and lag time of discharged water (see Fig.4): 309
For the Reference catchment, flow dynamics were close to the rainfall dynamics: Tlag varied
310
between 3 and 14 minutes (1st - 9th deciles), and Tempty ranged from 0.8 to 5.8 hours. These
311
high Tempty values were due to drainage in the private gardens above underground parking.
312
For source-controlled catchments, the peak flows shifted in time relative to the rain peak: Tlag
313
varied from 16 minutes to 2.3 hours for North, 23 minutes to 2.6 hours for Park, and 8 314
minutes to 1.4 hours for South (1st - 9th deciles). 315
The North and Park catchments also showed much longer emptying times for the aggregate of 316
all rain events than either Reference or South. Storage emptying lasted between 1.7 and 17 317
hours for North and 2.3 to 10 hours for Park. The South catchment took between 0.9 and 3 318
hours to empty, which was of the same order of magnitude as Reference. The reactivity of the 319
South site could be explained by the type of regulation system installed (vortex regulator, 320
pump) with which flows quickly reached the nominal regulator flow. It may induce fewer 321
effects when a small quantity of water is being stored, i.e., for ordinary rain. 322
These results indicate that the design of retention devices and, more importantly, the choice of 323
regulation system have proven to be determinant as regards flow dynamics. 324
325
3.2.2 Effect on discharged volumes
326
For the three source-controlled catchments, the annual discharged volumes that would be 327
generated with a conventional storm sewerage system were simulated with the model 328
described in the section 2.4.1 and then compared in Table 5 to actual measured volumes as 329
regards annual runoff coefficient (calculated as the ratio of rainfall amount to runoff water 330
depth). 331
The annual runoff coefficient simulated for a conventional sewerage system was very close to 332
the proportion of impervious surfaces for all 4 catchments. A large reduction (43% to 55%) in 333
annual runoff volumes, compared to the hypothetical volumes with a conventional storm 334
sewer, was observed for all 3 source-controlled catchments. This significant reduction was not 335
surprising for the Park catchment since all its stormwater flowed through a garden and 336
potentially infiltrated into the soil. For South, the reduction was correlated with longer and 337
more extensive contact with vegetated surfaces (grass strips, swales, grassed basin). The 338
reduction was much less expected on the North site, where storage facilities are mostly 339
composed of impervious materials. One part of this reduction could be explained by vegetated 340
roof and the other part by greater initial losses within the source control systems (dead 341
volumes). 342
These reductions in annual runoff volumes represent very promising developments for 343
stormwater quality management. Discharged masses are indeed partly determined by 344
discharged volumes, as already observed by other authors (Davis et al., 2009; Trowsdale et 345
al., 2011), and lower annual runoff volumes can also induce a reduction in the discharged 346
pollutant load. 347
348
3.3 Effects of source control systems on pollutant loads in stormwater
349
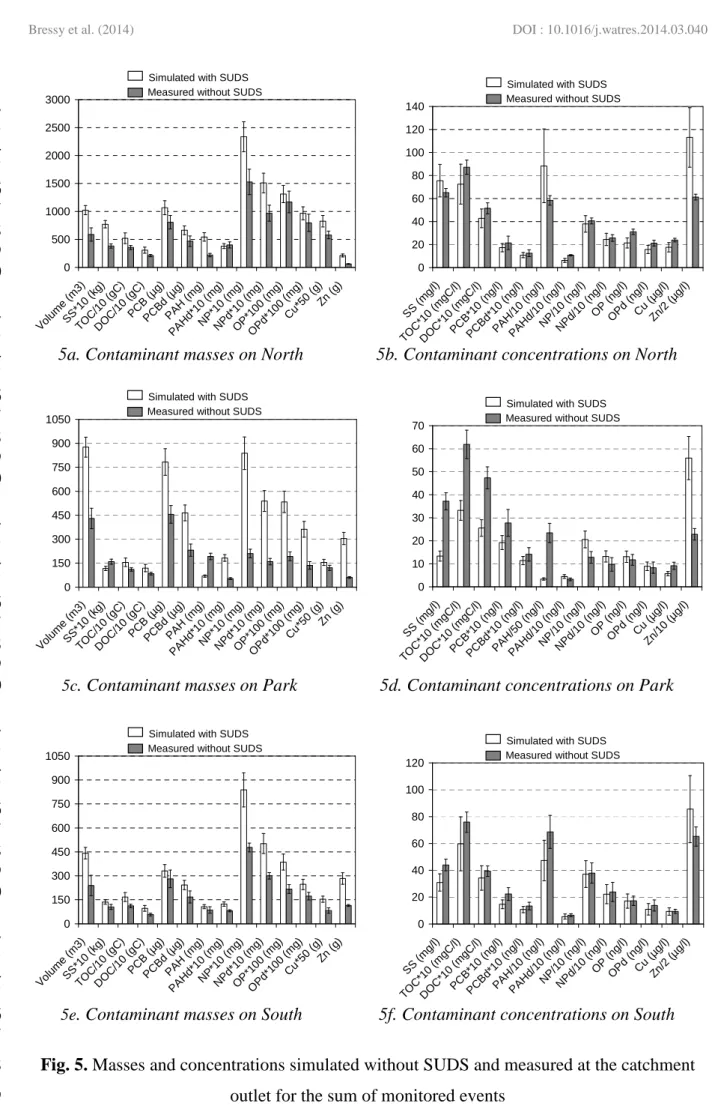
Figures 5a, 5c and 5e display, for all contaminants studied, both the masses measured (grey 350
histogram) at the outfall of each catchment and the simulated masses (white histogram) as if 351
the storm drainage system was conventional, for the sum of all monitored events. Water 352
volume data have been added for comparison. Figures 5b, 5d and 5f present the same types of 353
data for average concentrations. Uncertainty bars associated with measured data correspond to 354
measurement uncertainties and those associated with simulated data are model uncertainties 355
(with a 80 % confidence interval) (explanation in supplementary files Annexe A.1). 356
357
3.3.1 North catchment
358
For the North catchment, the mass values simulated for a situation with no SUDS ever 359
installed were higher than the measured masses on the whole, a finding that reveals a drop in 360
onsite contamination. The effect on contaminant concentrations depended on the type of 361
substance. Three categories of behaviour could be distinguished: 362
- For SS, total PAHs and zinc, the decrease in contaminant mass (50%, 60% and 72%, 363
respectively) was greater than the drop in water volume (43%). The measured concentrations 364
were thus lower than the simulation results. Since SS and PAHs are both particulate, we 365
assumed the level of settling would be substantial in the underground storage zones, given 366
that these decreases amounted to the same order of magnitude as the mass reductions 367
evaluated for large storage basins (Aires et al., 2003; Calabro and Viviani, 2006; Clark and 368
Pitt, 2012). The introduction of zinc, on the North site, occurred mainly in dissolved form via 369
the corrosion of metallic roof materials (80% in dissolved form according to Bressy et al. 370
(2012)). At the outfalls of large catchments, zinc has been proved to be 50% bind to 371
particulate matter (Zgheib et al., 2011), which proves that zinc tends to bond with particles. It 372
is suggested that part of the dissolved zinc became attached to particles and settled with them 373
or else bonded with either the drainage system or deposits in the storage zone. 374
- For PCBs and NPs, in their total and dissolved form, the decrease in contaminant mass 375
(between 24% and 36%) was assumed equal to the drop in water volume since the simulated 376
concentrations lied within the uncertainty interval of measured concentrations. These mass 377
amounts were thus lowered by the presence of storage, yet at a constant concentration. Let's 378
recall that these substances were at around 70% in dissolved form in our samples (Bressy et 379
al., 2012). This speciation was not expected to differ like it did for zinc since the distribution 380
here is the one measured in stormwater (Zgheib et al. 2011) or for the natural environment 381
(Cailleaud et al., 2007). It is therefore likely that a portion of the contamination has been 382
trapped during water losses due to sedimentation / filtration for the particulate fraction and to 383
adsorption / infiltration for the dissolved fraction. 384
- For the total (TOC) and dissolved organic (DOC) carbon, copper, dissolved PAHs and both 385
total and dissolved OPs, the decrease in contaminant mass when assuming no SUDS had been 386
installed was less than the drop in water volume or lied within the uncertainty interval of the 387
measures. The mass of released contaminants was in fact lower by use of on-site storage, 388
although the concentration released was slightly superior to that simulated for conventional 389
sewer. These substances are in the both fractions (Bressy et al., 2012) and should therefore 390
undergo at least the same decrease as the other substances, i.e. by sedimentation for the 391
particulate fraction and adsorption for the dissolved fraction. One hypothesis for these 392
findings might be that our simulation has underestimated the masses of these substances, as 393
automotive traffic is a major source of copper, PAHs and OPs (Bjorklund et al., 2009; Bressy 394
et al., 2012; Motelay-Massei et al., 2006). Automotive traffic is more intense on the North 395
catchment than the Reference site, which was used to calibrate the street-based contaminant 396
production function. But as explained in paragraph 3.1, our model intentionally 397
underestimates the simulated masses in order to avoid overestimation of the SUDS effect. As 398
a consequence, for these substances, our methodology does not allow us to conclude about the 399 effectiveness of SUDS. 400 401 3.3.2 Park catchment 402
Downstream of the Park catchment, the majority of simulated mass values exceeded the 403
measured values (except for SS and PAHs in the total fraction), thus indicating a mass drop 404
due to the use of open space storage. As mentioned for the North catchment, this decreasing 405
effect depended on the type of substance under consideration: 406
- For zinc, dissolved PAHs, total and dissolved NPs, and total and dissolved OPs, the decrease 407
in contaminant mass (80%, 71%, 70% and 60%, respectively) was greater than or equal to the 408
loss of water volume (60%). For these substances, which are mainly in dissolved form (80% 409
for zinc, 79% for NP and 74% for OP according to Bressy et al. (2012)), an adsorption effect 410
in the public garden was to be assumed, as demonstrated by Ray et al. (2006) on tree bark 411
samples or by Scholes et al. (2008). 412
- For TOC, DOC, PCBs, dissolved PCBs and copper, the contaminant mass decrease was less 413
than the actual volume loss. The simulated mass exceeded measurement results by 414
respectively 29%, 29%, 42%, 50% and 22%, with measured concentrations topping the 415
simulated concentration values. It was possible that the adsorption effect for these substances, 416
which were at 57% in particulate fraction for TOC, 36% for PCBs and 72% for copper 417
(Bressy et al., 2012), was less pronounced than for the group of substances described above. 418
- The mass of SS and total PAHs did not appear to be reduced by the upstream management 419
systems introduced. The measured masses of these substances exceeded the simulated values, 420
as if the fact of regulating discharges were raising the level of water contamination for these 421
parameters. It was likely that our simulation has underestimated the actual SS mass produced, 422
given that this value did not take into account particle production from the garden and 423
playground (sandpit). As above, for these substances, our methodology does not allow us to 424
conclude about the SUDS efficiency. 425
On this site, the decrease in water volume was high (over 50%), and the water residence time 426
in the basins was quite long according to Section 3.2.1 (median drainage time exceeds 5 427
hours). The contact time between water and potential substrates (plants and soil particles) was 428
also increased, thereby promoting both the adsorption of dissolved contaminants and their 429
infiltration into the soil. Moreover, since the storage facilities were not enclosed, it was 430
considered likely that the phenomenon of volatilisation, photolysis and biodegradation 431
eliminated a portion of soil contamination during dry weather periods (Scholes et al., 2008; 432 Weiss et al., 2007). 433 434 3.3.3 South catchment 435
On the South catchment, all simulated mass values exceeded measurements, which definitely 436
points to contaminant interception within the various SUDS systems. This decrease in mass 437
release however remains small in magnitude given that all simulated concentrations was less 438
than or equal to the measured concentrations, with the exception of zinc. 439
- As regards zinc, the mass decrease (60%) exceeded the drop in water volume (46%), and the 440
simulated zinc concentration was 24% higher than the measured value. On this catchment, the 441
majority of zinc (90%) entered in dissolved form through the corrosion of roofing materials 442
(Gromaire et al., 2011) and the roof runoff was recovered in both an underground tank and 443
planted swales. In these storage zones, sorption may indeed occur. 444
- As regards DOC, dissolved PCBs, dissolved PAHs, total and dissolved NPs, total and 445
dissolved OPs and copper, the mass decline was similar to the reduction in water volume. 446
Since all these parameters were essentially dissolved (Bressy et al., 2012), sorption or 447
infiltration effects were clearly apparent. 448
- The decreases in SS mass (23%), TOC (33%), total PCBs (15%) and total PAHs (19%) were 449
all less than the loss of water volume (46%): these parameters tend to be more particulate in 450
nature. 451
The decrease in South catchment contaminant mass thus appeared to be less pronounced than 452
that of the other sites. Flow control systems on this catchment were less efficient on current 453
flow rates than the other studied sites (Section 3.2.1), which results in lower residence times 454
and hence worse efficiency. 455
456
3.3.4 Fate of micropollutants in these systems
457
Level of deposit contamination: 458
Figure 6 presents the contaminant contents in deposits at both the North (underground pipe) 459
and South (storage zone upstream of the regulator) catchments. 460
The average PCB contents varied between 0.034 µg/g.dw for South and 0.058 µg/g.dw for 461
North: this range was 3 times weaker than contents measured in the Reference stormwater SS 462
(0.10 µg/g.dw, according to Bressy et al. (2012)). The particles held in storage prove to be the 463
coarsest as well as the least contaminated; in addition, they are comparable to those detected 464
by Jartun et al. (2008) in sediments from a separate urban sewer system in Norway (0.029 465
µg/g.dw) and below the limit established by the French decree relative to the spreading of 466
sewage sludge (Decree No. 97-1133, 1998), i.e. 0.8 µg/g.dw. 467
Average PAH contents was equal to 6.9 µg/g.dw in South sediment and 7.0 µg/g.dw in North 468
sediment, which places them at roughly 5 times less than the contents measured in the 469
Reference SS (33 µg/g.dw). These results were comparable to the values measured by Gasperi 470
et al. (2005) in particles from water used for street cleaning and above the contents recorded 471
by Jartun et al. (2008): 3.4 µg/g.dw. The contents were between 3.5 and 4 times weaker than 472
the limits established for the spreading of sewage sludge. 473
NPs contents ranged from 0.26 µg/g.dw at South to 6.3 µg/g.dw at North (0.04 and 474
0.70 µg/g.dw for OPs, respectively). The differences identified between these two sites may 475
be explained by a smaller proportion of road on South and a building age effect subsequent to 476
the European NP use restriction Directive (Directive 2003/53/EC). More specifically, the 477
South catchment contained more recent construction, meaning that the materials employed 478
could contain less NP. The contents found in Reference SS were measured at 6.8 µg/g.dw 479
(0.27 µg/g.dw for OPs). Bjorklund et al. (2009) found lower contents in sediments from a 480
separate sewer network in Sweden: below 1.5 µg/g.dw for NPs, and below detection limits for 481
OPs. No regulation has been adopted for alkylphenols as regards their spreading. 482
For trace metals, the contents recorded at South revealed: 0.059 mg/g.dw copper, 0.041 483
mg/g.dw lead, and 2.8 mg/g.dw zinc. North catchment results yielded: 0.16 mg/g.dw copper, 484
0.12 mg/g.dw lead, and 0.79 mg/g.dw zinc. The higher copper and lead contents found in 485
North stemmed from the greater volume of road traffic. The lower zinc values in North were 486
due to a much larger proportion of zinc roofs in South (Table 1). These entire values were 487
lower than those for Reference particles: 0.28 mg/g.dw copper, 0.26 mg/g.dw lead, and 488
5.5 mg/g.dw zinc. The order of magnitude remained the same as for measurements conducted 489
by Jartun et al. (2008), i.e., 6 times less than the spreading limits for copper, 7 times less than 490
those for lead and 4 times for zinc. 491
These deposits were thus only slightly contaminated, especially when compared to the 492
concentrations measured in stormwater SS: the coarsest, and hence least contaminated, 493
particles are those retained in the SUDS. This category of particles does not require any 494
special treatment, as opposed to the sludge generated by combined sewer networks. 495
496
Impacts of urban runoff retention on soil contamination: 497
To understand the fate of contaminants and to assess whether stormwater storage actually 498
degrades garden soil quality in Park catchment or not, contaminant contents were measured in 499
the soil as a function of the flooding gradient. Figure 7 displays the contents recorded across 500
the various zones. OPs are not displayed because contents were around the LOQ. 501
PAH concentrations varied between 0.33 and 1.1 µg/g.dw, while PCB contents ranged from 502
0.026 to 0.060 µg/g.dw and NP values from 0.22 to 0.45 µg/g.dw. These PAH and PCB 503
contents are comparable to measurements recorded in Seine River basin soils by Motelay-504
Massei et al. (2004) and are below the values from the Canadian Soil Quality Guidelines 505
(CCME, 2007) and far from the intervention values for remediation given by the regulation of 506
Netherlands (VROM, 2000). In contrast, the garden soil seems to be contaminated by NPs, 507
given the findings of Vikelsoe et al. (2002), who reported contents equal to 0.034 µg/g.dw in 508
runoff storage areas, but this value stay below the Canadian Soil Quality Guidelines (CCME, 509
2007). 510
Copper contents varied between 0.014 and 0.040 mg/g.dw, lead between 0.020 and 511
0.083 mg/g.dw, and zinc between 0.056 and 0.10 mg/g.dw. These values are of the same 512
order of magnitude as Paris region soils, according to Thévenot et al. (2007) and they respect 513
guidelines (CCME, 2007; VROM, 2000). 514
A comparison across the 3 zones of increasing flood frequency did not reveal any difference 515
in content for PCBs, and NPs. For PAHs and 3 trace metals, however, the most commonly 516
flooded zones showed contents of between 1.3 and 3.2 times less. These differences may be 517
attributed to sol heterogeneity or to an infiltration or degradation process, depending on 518
contaminants. Moreover, these results demonstrate that the Park catchment soil is not 519
significantly contaminated following its use for storage. 520
521
3.4 Discussion on micropollutant reduction measures for stormwater
522
Section 3.2 highlighted: i) a significant reduction in annual runoff volumes at the outlets of 523
the source-controlled catchments due to losses on permeable surfaces and higher initial losses 524
on impervious surfaces and ii) an increase in water retention time, which strongly depend on 525
facilities design. When the design of SUDS considers only exceptional rainfalls, retention 526
efficiency of common rainfall is highly variable depending on the type of storage (permeable 527
or impervious surfaces) and the method of flow regulation. For the facilities that naturally 528
increase the retention time, like the large grassed detention garden in Park catchment, the 529
effects due to the flow regulator itself become insignificant for common rainfall. 530
531
Section 3.3 proved that the presence of SUDS considerably lowered the contaminant masses 532
released by the catchments. This conclusion was based on a comparison of fluxes measured 533
with SUDS and simulated without SUDS. This methodology takes into account the 534
measurement uncertainty. Scenario uncertainty was not evaluated, however the simulated 535
scenario is an underestimating scenario. It is intentionally based on minimal emissions from 536
the different pollutant sources, so as to avoid overestimation of the SUDS effectiveness. 537
This decrease varied from 20% to 80% of the total released mass, depending on both the 538
study site and the type of pollutant. For underground storage facilities, the drop is substantial 539
for particulate pollutants (SS, particle-bound contaminants) which are sensitive to 540
sedimentation, and less pronounced for dissolved contaminants which might adsorb to the 541
structures or deposits. For storage scenarios in permeable planted zones, the most significant 542
contaminant decreases involve dissolved pollutants. Other effect of the SUDS can be 543
observed on the substances primarily introduced into stormwater in dissolved form (i.e. 544
metals from the corrosion of roofing materials) and that exhibits a strong affinity for organic 545
matter. In this case, the binding of these substances to deposits and soil is assumed, inducing a 546
stronger reduction of their release. Our findings should apply to other sites equipped with 547
SUDS if they are designed with the same criteria. These results are interesting at local scale 548
because it provides original data on organic micropollutants in SUDS and particularly useful 549
at global scale because they allow to make effective recommendations for design criteria in 550
terms of reducing pollution. 551
552
The effects on discharged contaminants may be correlated with hydraulic effects, namely the 553
followings. 554
- Discharged masses are strongly correlated to discharged volumes and a reduction in 555
annual runoff volumes may explain the highlighted mass decreases. Consequently, the 556
volume drop for ordinary rain events needs to be assigned a top priority when developing 557
stormwater management processes and, moreover, can be maximised by adding storages 558
in grassy areas. 559
- During runoff, the reduction in flow velocity may lower contaminant erosion at the 560
surface. 561
- In water storage facilities, reduced flow velocity allows for particle settlement (Calabro 562
and Viviani, 2006). A longer residence time increases contact time between water and 563
substrate (i.e., soil, sediments, building materials) and is therefore favourable to both 564
pollutant filtration trough permeable materials and sorption of dissolved fractions (Mason 565
et al., 1999; Ray et al., 2006). 566
- On a long-term basis and during dry weather periods, some of the pollutants retained in 567
the source control devices may undergo evaporation or degradation (biodegradation, 568
photodegradation, etc.) (Scholes et al., 2008; Warren et al., 2003). 569
In order to improve water quality, the design of SUDS should focus on systems that retain all 570
rain events, even those with the lowest intensity. To intercept ordinary events without 571
increasing the size of storage facilities, flow rate regulation may be adjusted according to the 572
importance of the event. It may be feasible to store the first few millimetres of rain in porous 573
materials without discharge and by emptying via infiltration and/or evapotranspiration. As an 574
example, "rain garden" and "bioretention" type systems are currently being promoted in other 575
countries (Dietz and Clausen, 2005; Jefferies et al., 2004). These recommendations are 576
consistent with Petrucci et al. (2013). They showed that flow-rate based regulations can 577
produce negative impacts on water discharge at the catchment scale and that volume-based 578
regulations should be encouraged for example local infiltration facilities. 579
580
4. Conclusion
581
The research presented herein has demonstrated that the use of SUDS systems, initially aimed 582
at peak flow attenuation, can also serve to slow and delay water flow for frequent rain events, 583
and result in a significant reduction of the annual discharged volumes. The masses of 584
discharged contaminants are also decreased. This phenomenon is correlated with hydraulic 585
effects: greater initial and continuous losses limit contaminant transfer downstream while an 586
extended residence time enhances the phenomena of substance sedimentation and adsorption. 587
This reduction in discharged contaminants is primarily explained by a drop in runoff water 588
volumes. These results do not systematically reveal any kind of "purifying effect" in the 589
classical meaning (i.e. lower concentrations), but instead an overall effect of reducing mass 590
discharges. 591
The effects are however highly variable from one site to another, and from one contaminant to 592
another. They depend on the hydraulic interception of small rainfalls. For impervious storage 593
structures the retention time of small events depends mainly on the characteristics of the flow 594
regulator device, whereas for pervious and vegetated storage structures natural losses 595
(infiltration, evapotranspiration) greatly contribute to the interception of frequent rain events. 596
597
Bressy et al. (2012) have exposed the benefit of managing stormwater upstream, for the 598
purpose of locally discharging the slightly contaminated water; refraining from mixing with 599
heavily polluted water, and avoiding the network cross contamination process. 600
Nowadays, in France, the design of SUDS is mainly intended to protect against flooding and 601
to limit discharged flows mainly by intercepting the exceptional rain events. To ensure 602
efficiency in terms of pollutant mitigation, this upstream stormwater management approach 603
must limit water transfer downstream and take into account frequent rain events when 604
designed. A regulation system needs to be introduced for retaining ordinary events without 605
excessively increasing the storage volume for ten-year return period rainfalls. As an example, 606
the first few millimetres of rainfall could be systematically stored in a porous material or a 607
vegetated zone without any discharge to the network but with drainage provided by 608
infiltration and/or evapotranspiration. 609
610
Acknowledgments
611
This study has been conducted within the framework of the OPUR and SISTEO research 612
programmes. The authors gratefully acknowledge the Paris Regional Council, the Seine- 613
Saint-Denis Departmental Council, the Val-de-Marne Departmental Council, the Seine- 614
Normandy Water Agency, the City of Paris, and the Interdepartmental Association for 615
Sewerage Services in the Paris Metropolitan Area (SIAAP). 616
617
Bibliography
618
Aires, N., G. Chebbo, J.-P. Tabuchi & P. Battaglia (2003) Dépollution des polluants urbains 619
de temps de pluie en bassin de stockage-décantation. Techniques Sciences et 620
Méthodes,12, 70-86. 621
Berthier, E., F. Rodriguez, H. Andrieu & G. Raimbault (2001) Simulation of regular rain 622
events: the limits of the traditionnal initial losses and runoff coefficient scheme. 4th 623
International Conference On Innovative Technologies In Urban Drainage, Novatech,
624
pp. 869-876. Lyon, France. 625
Bjorklund, K., A. P. Cousins, A. M. Stromvall & P. A. Malmqvist (2009) Phthalates and 626
nonylphenols in urban runoff: Occurrence, distribution and area emission factors. 627
Science of The Total Environment,407(16), 4665-4672. 628
Bressy, A., M. C. Gromaire, C. Lorgeoux & G. Chebbo (2011) Alkylphenols in atmospheric 629
depositions and urban runoff. Water Science and Technology, 63(4), 671-679. 630
Bressy, A., M. C. Gromaire, C. Lorgeoux, M. Saad, F. Leroy & G. Chebbo (2012) Towards 631
the determination of an optimal scale for stormwater quality management: 632
Micropollutants in a small residential catchment. Water Research, 46(20), 6799-6810. 633
Brombach, H., G. Weiss & S. Fuchs (2005) A new database on urban runoff pollution: 634
comparison of separate and combined sewer systems. Water Science and Technology, 635
51(2), 119-128. 636
Burton, G. A. J. & R. Pitt (2001) Stormwater Effects Handbook: A Toolbox for Watershed 637
Managers, Scientists, and Engineers. Taylor & Francis. 638
Cailleaud, K., J. Forget-Leray, S. Souissi, D. Hilde, K. LeMenach & H. Budzinski (2007) 639
Seasonal variations of hydrophobic organic contaminant concentrations in the water-640
column of the Seine Estuary and their transfer to a planktonic species Eurytemora 641
affinis (Calanoida, copepoda). Part 1: PCBs and PAHs. Chemosphere, 70(2), 270-280. 642
Calabro, P. S. & G. Viviani (2006) Simulation of the operation of detention tanks. Water 643
Research,40(1), 83-90. 644
CCME (2007) Canadian Soil Quality Guidelines for the Protection of Environmental and 645
Human Health - Update 7.0. In C. C. o. M. o. t. Environment (ed.). 646
Clark, S. E. & R. Pitt (2012) Targeting treatment technologies to address specific stormwater 647
pollutants and numeric discharge limits. Water Research, 46(20), 6715-6730. 648
Davis, A., W. Hunt, R. Traver and M. Clar (2009). Bioretention Technology: Overview of 649
Current Practice and Future Needs. Journal of Environmental Engineering, 135 ,109-650
117. 651
DEA (1992) Règlement de l’assainissement départemental. In Direction de l’Eau et de 652
l’Assainissement de la Seine Saint-Denis (ed.). 653
Decree n° 97-1133 (1998) Décret du 8 décembre 1997 relatif à l’épandage des boues issues 654
du traitement des eaux usées. JO du 10 décembre 1997, p. 17822-17825. 655
DiBlasi, C.J., L. Houng, A. P. Davis, U. Ghosh, (2009). Removal and Fate of Polycyclic 656
Aromatic Hydrocarbon Pollutants in an Urban Stormwater Bioretention Facility. 657
Environmental Science and Technology, 43(2), 494-502. 658
Dietz, M. E. & J. C. Clausen (2005) A field evaluation of rain garden flow and pollutant 659
treatment. Water Air and Soil Pollution, 167(1-4), 123-138. 660
Directive 2003/53/EC of the European Parliament and of the Council of 18 June 2003 661
amending for the 26th time Council Directive 76/769/EEC relating to restrictions on 662
the marketing and use of dangerous substances and preparations. 663
Ellis, J. B. & D. M. Revitt (2010) The management of urban surface water drainage in 664
England and Wales. Water Environ. J., 24(1), 1-8. 665
Gasperi, J., V. Rocher, R. Moilleron & G. Chebbo (2005) Hydrocarbon loads from street 666
cleaning practices: Comparison with dry and wet weather flows in a parisian 667
combined sewer system. Polycyclic Aromatic Compounds, 25(2), 169-181. 668
Gromaire, M. C., P. Robert-Sainte, A. Bressy, M. Saad, B. De Gouvello & G. Chebbo (2011) 669
Zn and Pb emissions from roofing materials - modelling and mass balance attempt at 670
the scale of a small urban catchment. Water Science and Technology, 63(11), 2590-671
2597. 672
Jartun, M., R. T. Ottesen, E. Steinnes & T. Volden (2008) Runoff of particle bound pollutants 673
from urban impervious surfaces studied by analysis of sediments from stormwater 674
traps. Science of The Total Environment, 396(2-3), 147-163. 675
Jefferies, C., A. Duffy, N. Berwick, N. McLean & A. Hemingway (2009) Sustainable Urban 676
Drainage Systems (SUDS) treatment train assessment tool. Water Science and 677
Technology,60(5), 1233-1240. 678
Jefferies, C., T. Wild, B. J. D'Arcy & N. McLean (2004) Assessing the performance of SUDS 679
for the management and control of surface water runoff in Scotland. Novatech. 680
Martin, C., Y. Ruperd & M. Legret (2007) Urban stormwater drainage management: The 681
development of a multicriteria decision aid approach for best management practices. 682
European Journal of Operational Research,181(1), 338-349. 683
Mason, Y., A. A. Ammann, A. Ulrich & L. Sigg (1999) Behavior of heavy metals, nutrients, 684
and major components during roof runoff infiltration. Environmental Science and 685
Technology,33(10), 1588-1597. 686
Matamoros, V. & V. Salvadó (2012). Evaluation of the seasonal performance of a water 687
reclamation pond-constructed wetland system for removing emerging contaminants. 688
Chemosphere, 86(2), 111-117. 689
Motelay-Massei, A., B. Garban, K. Phagne-Larcher, M. Chevreuil & D. Ollivon (2006) Mass 690
balance for polycyclic aromatic hydrocarbons in the urban watershed of Le Havre 691
(France): Transport and fate of PAHs from the atmosphere to the outlet. Water 692
Research,40(10), 1995-2006. 693
Motelay-Massei, A., D. Ollivon, B. Garban, M. J. Teil, M. Blanchard & M. Chevreuil (2004) 694
Distribution and spatial trends of PAHs and PCBs in soils in the Seine River basin, 695
France. Chemosphere, 55(4), 555-565. 696
Pagotto, C., M. Legret & P. Le Cloirec (2000) Comparison of the hydraulic behaviour and the 697
quality of highway runoff water according to the type of pavement. Water Research, 698
34(18), 4446-4454. 699
Petrucci, G., E. Rioust, J.-F. Deroubaix & B. Tassin (2013) Do stormwater source control 700
policies deliver the right hydrologic outcomes? Journal of Hydrology, 485(0), 188-701
200. 702
Ray, A. B., A. Selvakumar & A. N. Tafuri (2006) Removal of selected pollutants from 703
aqueous media by hardwood mulch. Journal of Hazardous Materials, 136(2), 213-704
218. 705
Roy, A. H., S. J. Wenger, T. D. Fletcher, C. J. Walsh, A. R. Ladson, W. D. Shuster, H. W. 706
Thurston & R. R. Brown (2008) Impediments and solutions to sustainable, watershed-707
scale urban stormwater management: Lessons from Australia and the United States. 708
Environmental Management,42(2), 344-359. 709
Scholes, L., D. M. Revitt & J. B. Ellis (2008) A systematic approach for the comparative 710
assessment of stormwater pollutant removal potentials. Journal of Environmental 711
Management,88(3), 467-478. 712
Thevenot, D. R., R. Moilleron, L. Lestel, M. C. Gromaire, V. Rocher, P. Cambier, P. Bonte, J. 713
L. Colin, C. de Ponteves & M. Meybeck (2007) Critical budget of metal sources and 714
pathways in the Seine River basin (1994-2003) for Cd, Cr, Cu, Hg, Ni, Pb and Zn. 715
Science of The Total Environment,375(1-3), 180-203. 716
Trowsdale, S. A. and R. Simcock (2011). Urban stormwater treatment using bioretention. 717
Journal of Hydrology,397, 167-174. 718
VanWoert, N. D., D. B. Rowe, J. A. Andresen, C. L. Rugh, R. T. Fernandez & L. Xiao (2005) 719
Green roof stormwater retention: Effects of roof surface, slope, and media depth. J. 720
Environ. Qual.,34(3), 1036-1044. 721
Vikelsoe, J., M. Thomsen & L. Carlsen (2002) Phthalates and nonylphenols in profiles of 722
differently dressed soils. Science of The Total Environment, 296(1-3), 105-116. 723
VROM (2000) Intervention values and target values - soil quality standards in Netherlands. In 724
T. M. o. H. S. P. a. Environment (ed.). 725
Warren, N., I. J. Allan, J. E. Carter, W. A. House & A. Parker (2003) Pesticides and other 726
micro-organic contaminants in freshwater sedimentary environments--a review. 727
Applied Geochemistry,18(2), 159-194. 728
Warmink,J.J., Janssen,J.A.E.B., Booij,M.J., and Krol,M.S. (2010) Identification and 729
classification of uncertainties in the application of environmental models. 730
Environmental Modelling and Software25 (12), 1518-1527. 731
Weiss, P. T., J. S. Gulliver & A. J. Erickson (2007) Cost and pollutant removal of storm-water 732
treatment practices. Journal of Water Resources Planning and Management-Asce, 733
133(3), 218-229. 734
Zgheib, S., R. Moilleron, M. Saad & G. Chebbo (2011) Partition of pollution between 735
dissolved and particulate phases: What about emerging substances in urban 736
stormwater catchments? Water Research, 45(2), 913-925. 737