HAL Id: hal-01962546
https://hal.uca.fr/hal-01962546
Submitted on 20 Dec 2018
HAL is a multi-disciplinary open access
archive for the deposit and dissemination of
sci-entific research documents, whether they are
pub-lished or not. The documents may come from
teaching and research institutions in France or
abroad, or from public or private research centers.
L’archive ouverte pluridisciplinaire HAL, est
destinée au dépôt et à la diffusion de documents
scientifiques de niveau recherche, publiés ou non,
émanant des établissements d’enseignement et de
recherche français ou étrangers, des laboratoires
publics ou privés.
ICING CLOUD MICROSTRUCTURE FROM IN SITU
MEASUREMENTS
J. F. Gayet, M Bain
To cite this version:
J. F. Gayet, M Bain.
ICING CLOUD MICROSTRUCTURE FROM IN SITU
MEA-SUREMENTS. Annals of Glaciology, International Glaciological Society, 1983, 4, pp.66-72.
�10.3189/S0260305500005255�. �hal-01962546�
Annals af Glacialagy 4 1983
© International Glaciological Society
ABSTRACT
ICING CLOUD MICROSTRUCTURE FROM
IN
SITU
MEASUREMENTS
byJ.
F. Gayet and M. Bain
(Laboratoire Associe de Meteorologie Physique, Universite de Clermont 11, S.P. 45, 63170 Aubiere, France)
2. CLOUD PHYSICS INSTRU~1ENTATION I n several experiments carri ed out in France, the
Republic of the Ivory Coast, and Spain, icing clouds \~ere penetrat.ed at di fferent hei ghts by i nstrumented research aircraft. This paper descrihes the range and the frequencies of occurrence of the relevant icing parameters compute~ on the cloud scale and for different cloud types. Comparisons between micro-physical parameters and meteorological radar signatures show the limitations of these radars when used as a means of locating icing clouds.
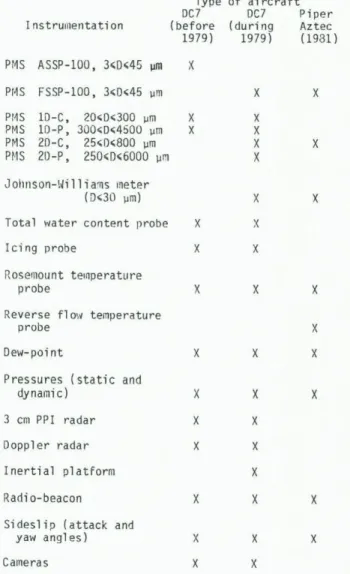
The available instrumentation on the two air-craft is described in Table I. The spatial resolu-tion of the tape-recorded data was about 100 m for all the parameters and for both aircraft. A more
1. INTRODUCTION
Existing weather statistics demonstrate some significant operational limitations due to icing of aircraft (both aeroplanes and helicopters). Unfortun-ately, the existing meteorological database is in-sufficient to describe the operating environment in which aircraft must conduct flights. In addition to the inadequacies of existing atmospheric icing models, a great deal of improvement is needed in short- and long-range forecasting capability. Since 1972, the Laboratoire Associ~ de M~t~orologie Physique has been involved in studies on meteoro-logical problems concerning the icing of aircraft. Instrumentation for studying the atmosphere and cloud physics has been extended and improved. It was mounted on a DC7* research aircraft up to 1979 and on a Piper Aztec** aircraft in 1931.
Several experiments were carried out in France during the winter and summer months of 1975 to 1977, in the Republic of the Ivory Coast in October 1977, and in Spain during the winter and spring months of 1979 and 1981. This paper describes the range of the
relevant icing parameters measured during the first exploratory experiments in France and the Ivory Coast, and a statistical analysis of the icing cloud microstructure in Spain, where the data were better documented. Some comparisons between microphysical parameters and radar echo signatures are also described to give the limitations of meteorological radar when it is used as a means of locating icing clouds.
* The DC7 aircraft was sponsored and operated by the Direction des Recherches Etudes et
Techniques and by the Centre d'Essais en Vol in Breti gny. France.
** The Piper Aztec aircraft is sponsored and operated by the Meteoro10gie Nationa1e, France. 66
TABLE I. AIRCRAFT INSTRUMENTATION Type of aircraft
OC7 OC7
I nstrull1entati on (before (during 1979) 1979) PMS ASSP-100, 3(D~;45 IIm X Pr4S FSSP-100, 3(0(45 llm X Pt4S ID-C, 20,,0,,300 llm X X Pt4S lO-P, 300,,0,,4500 llm X X PMS 2D-C, 25,,0,,800 Ilm X P~1S 21)-P. 250(0(6000 1Ji:l X Joh"son-Willia~s meter (0<30 Ilm) X
Total water content probe X X
Icing probe X X
Rosetnount te,operatllre
probe X X
Reverse f1 O\~ temperature probe
Dew-poi nt X X
Pressures (static and
dynami c) X X
3 cm PPI radar X X
Doppler radar X X
Inertial platform X
Radio-beacon X X
Sideslip (attack and
yaw angles) X X Cameras X X Piper Aztec ( 1931) X X X X X X X X X
detailed description of the aircraft instrumentation and the accuracies and limitations of measurements has been discussed in previous papers (Gayet and Friedlander 1979, Gayet 1981, Personne and others 1982) .
3. AN ATTEMPT TO QUANTIFY ICING SEVERITY
The intensity of icing can be related to the rate of ice accretion on an ice collector as a
func-tion of several parameters: air temperature, super-cooled liquid water content, ice content, collection efficiency, and flight speed and duration in the
cloud. Qualitative observations made from the nC7 aircraft (100 m s-1 cruise speed) show that icing generally occurred in most of the clouds encountered at temperatures <-2 to _3°C. With the Piper Aztec
(cruise speed 60 m s-l I, the corresponding tempera-ture limit was ahout _1°C due to a lower dynamic
lO
'u) N •E
E.S
IPC~5l
-1•
0:::
•
0
0
1.0
"7Ul N 'E
E·5
0:::
0.5
LWC
(g.m3)
IPC>S
r'
a
/
•
.,
~I
/ / / / / //
.5
-3LWC
(g.m)
•
lO
/ /to
Fig.l. Icing rate R plotted against cloud liquid
water content LWC:
(a) clouds with an ice particle concentration <5 particles per litre,
(b) clouds with an ice particle concentration >5 particles per litre.
Gayet and Bain: Icing cloud micpostpuctupe
~eating of the ice probe. Quantitative measurements of the ice profiles on a fixed cylinder (Bain and Gayet 1982) show that increasing liquid water content is generally accompanied by increasing icing
inten-sity. Figure 1(a) is based nn the experiment in Spain in spring 1979 and shows the icinq rate measured by an ici~g probe plotted against the liquid water con-tent for several penetrations of strati form and cumuliform clouds containing a low ice particle concentration {less than 5 particles per litrel.
The effect of the ice particles on the icing intensity has not been clarified. Helicopters flying in natural icing conditions have occasionally experienced a sudden rise in the severity of icing (Lake and Bradley 19761. This effect has been explained by the presence of ice crystals in the
supercooled clouds. On the contrary, Rain and Gayet (19821 have demonstrated a reduction of the icing rate in cumuliform clouds (near -20°CI containing a noticeable ice particle concentration (more than 5 particles per litre) as shown in Figure l(b). This
figure shows a measured icing rate lower than that in Figure l(a), possibly because of the erosion caused by the ice particles impinging on the ice depos it.
The overall collection efficiency depends upon several parameters: those related to the air (temper-ature, density, viscosity), those related to the ice collector (shape and stream velocity), and those related to the cloud (concentration of water/ice,
droplet spectrum). Therefore, it is expected that a given type of aircraft will be sensitive to a range
of hazards created by icing on the airframe, rotor blades, air intakes, etc., and that different air-craft will experience these problems to varying
degrees.
These considerations lead us to present our results in terms of meteorological parameters rather than in terms of icing severities.
4. SOME RESULTS OF THE EXPLORATORY EXPERIMENTS CARRIED OUT IN FRANCE AND THE IVORY COAST
Figure 2(a) shows the mean values of the liquid
water content versus the temperature at the pene-tration level for each traverse of icing clouds per-formed in France. Two symbols are used to distinguish the cumul iform clouds {A 1 and the stratiform clouds
{ • I, sol id and open symbol s correspondi ng to wi nter and summer clouds respectively. Figure 2{bl relates to the tropical cumuliform clouds experienced in the
Ivory Coast. These two figures show scattered values
of the liquid water content for a temperature range
between -3 and -15°C.
In France, for all cases studied, the values of the liquid water content ranged from 0.03 to
1.80 g m-3, and 40% of the clouds have a liquid water
content >O.S g m-3 (mean value about O.S g m-31. The
maximum frequency of occurrence of icing clouds is found between -S and _7°C which corresponds to heights of 2 700 m a.s.l. in winter and 4 300 m a.s.l. in summer.
Tropical cumuliform clouds are characterized by larger liquid water contents, from 0.2 to 5.8 g m-3
{mean value of 1.3 g m-31, and 80% of the clouds have
a liquid water content >O.S g m-3 • The maximum fre-quency of occurrence of icing clouds is also found near _6°C, which corresponds to a height of 5 800 m a.s.l. The scattered values of the liquid water con-tent are due to the cloud microphysical structure which is variable both spatially and temporally depending on the stage of the life of the cloud. Local values of liquid water content, which were much greater than the values displayed on Figures 2{al and 2(bl, were observed, particularly in tropical clouds where 20 9 m-3 was measured in an accumulation zone
associated with strong updrafts up to 23 m S-1 (Gayet and others unpublished).
Qualitative observations of the icing probe made during these cloud penetrations have shown that the
Gayet and Bain: Icing cLoud micpostl"uctuJ"e
(a) ICING CUMULIFORM (A' ~
STRATIF~M (., CLOUDS
(b) TROPICAL ICING CUMULlFORM
CLOUDS (IVORY COAST .1977)
(FRANCE 1975-19n ) 25 c~ses
"" : summer clouds 18 cases • • : winter clouds. 15 cases
5.0 5.0
•
.& .&-
L;...,
'E A . ~ d>•
-1.0•
•
""
~ ~•
Z wi
L;. ~ L;.•
Z L;. 0 L;. L;.•
U•
.& .&..,
.& .& .&
'E .& .& en .& -1.0 .& ~ .&
~
Z .& W .& ~ .& .& Z .&.& 0 .A U Cl::""
Cl:: .& .& UJ UJ ~ L;. L;.«
30.1 A L;. ~«
3 0.1 0 0-~ L;. 0
•
~ 0 -..J•
L;.•
..J I I J I I I 0 -5-10
-15 0 -5-10
-15TEMPERATURE (OC) TEMPERATURE (OC)
Fig.2. Mean values of liquid water content plotter:! against te1nperatllre at the npnetration levPl: (a) clour:!s
sampled in France, (b) clour:!s sampler:! on the Ivory Coast.
icing intensity was not severe despite a large liquid water content due to a loss of water by shedding.
Indeed, when the liquid water content is much larger
than the critical water content (limit of Ludlam 1951), the supercooled drops are not completely frozen during the impact, the ice grows wet, and
run-off of water occurs.
We have also noted that the ice deposit can be partially eroded due to the presence of large
part-i cl es (graupel or hail).
5. STATISTICAL STUDY OF THE MICROSTRUCTURE OF THE
CLOUDS SAMPLED IN SPAHI (1979-1981 EXPERn1ENTS)
The results presented in this section have been
obtained from data collected in an area in north-west Spain during Site Selection Phase 3 of the World Meteorological Organization Precipitation Enhancement Project (PEP) in 1979 (from 27 March to 4 April) and in 1981 (from 27 March to 16 May). Approximately 650 cloud penetrations at negative temperatures were performed on 33 days; this
repre-sents a total in-cloud length of about 3 000 km.
Despite the fact that these data are geographically restricted and concern a short period (three months), they give a representative cloud sample including several synoptic situations and are presented as a statistical analysis.
This analysis concerns microphysical anrl thermo-dynamical parameters averaged over the cloud penetra-tion. We call penetration a flight in a cloud with a length greater than ~ 1 km (i.e. 10 discrete meas-urements) and in whi ch the 1 i qui d ~/ater content is
>0.05 9 m-3 or the ice particle concentration is
greater than 0.1 particles per litre. Under these
criteria, the median penetration length was 4.5 km
and 80% of the penetration lengths were between 1 and
6 km.
68
The mean value of the temperature at the
pene-tration level is about _8°e and 13% of penetrations
were carried out at a temperature less than -14°C. Three types of icing cloud are considerer:l: (i) tne cumuliform clouds, including cumulus medio-cris, winter cumulus congestus and cumulonimbus, (i;) the low stratiform clouds, including
strato-cumulus and nimbostratus, and (iii) the mediu~
strati-form clouds, including altocumulus and altostratus. This cloud classification was made from aircraft observations.
The mean heights of penetration of the different
cloud types descrihed above were 2 800, 2 400 anrl
3 200 m a.s.l. respectively. Due to the sampling
period (winter/spring) the cumulus clouds were not
very welldeveloped vertically (mean thickness of
about 2.1 km) and were found in most cases in complex
cloudy situations (embedded convection). The low
and medium strati form clouds had a similar thickness
of1.1km.
5.1. General characteristics of each cloud category
Fi gures 3 to 5 di spl ay the hi stograms of the
cloud liquid water content, the median volume
dia-meter and the ice particle concentration for the
cumuli form, low, and medium stratiform cloud
cate-gories, respectively. Table 11 summarizes the mean
values and the standard deviations of the above
mentioned parameters together with the horizontal
cloud length. Figures 3 to 5 and Table 11 show that
the liquid ~ater contents are similar (0.3 9 m-3 )
in cumuliform and low stratiform clouds, but lower
(0.18 g
m-
3) in medium strati form clouds. ~oticeabledifferences appear between the cumuli form and the
low stratiform clouds for the median volume diameter
(20.8 against 16.1 ~m) and for the ice particle con
-centration (10.1 and 2.9 particles per litre), while
intermediate values are found in the medium
Fig
3
:
CUMULlFORM CLOUDS (393 penetrationsl 50 SO lOO i- Wo.: 1751-' ~ u ! 25 50 ::> 0...
..
...
0 0 20Fig
4:
LOW STRATlFORM CLOUDS (204 penC!trations)50
:!--
~ u ! 25 25 SO ::> 0..
lE...
0 0 lISFig
5:
MEDIUM STRATJFORM CLOUDS (55 penelriltionsl50 50 100 :!-~ u ~ 25 25 so :> 0
...
0:...
a 0 lISFigs.3,4,5. Frequency rlistributions of cloud liquid water content LWC, median volume diameter DV, and
ice particle concentration IPC for cumuliform,
low and medium stratiforrn clouds.
respectively). The horizontal cloud length is found to be greater in the medium strati form clouds (9.3 km), but this parameter does not represent the hori-zontal cloud extent on account of the flight proced-ures and the rlata processing method. Sometimes, strati form cloud decks exhibit holes which are not taken into account in the evaluation of the
micro-physical parameters.
5.2. Stratification of the microstructure versus the
temperature and the level of penetrations
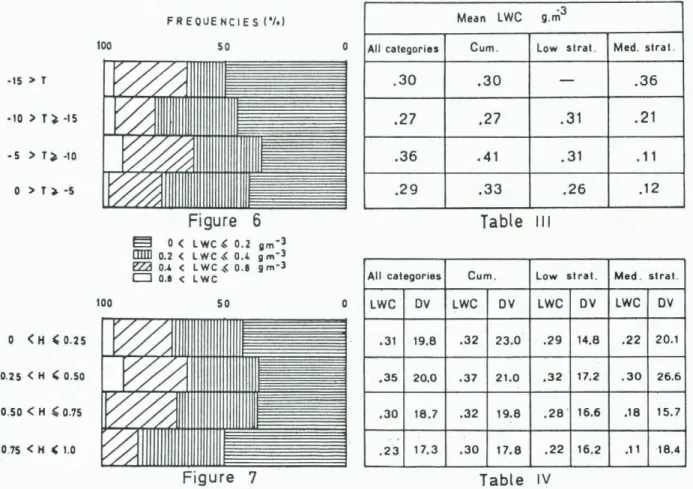
Figure
6
shows the frequency distributions of the liquid water content plotted against four rangesGayet and Bain: Icing cloud mic1"ost1"Uctul'e
of the penetration temperature for all the cloud
categories. Table III shows the mean values of the
1 i qui d water contents in the same ranges of telnpera-ture for the sum of all cloud categories and for each cloud category individually. It appears that the largest liquid water contents are found between -5 and -10·C, particularly for cumuliform clouds (0.41 9 m-3 • This trend is not observed in medium strati form clouds (maximum values observed for T <-15·C) because most of these clouds occur below -10·C.
Figure 7, with the same representation as Figure
6, shows the frequencies of liquid water content for
the four ranges of the penetration level relative to
the cloud depth (H = 0 corresponrls to the cloud top,
and H
=
1 to the cloud base!. Table IV shOl~s themean values of liquid water content and median vol-ume diameter in the corresponding relative altitude ranges.
For each cloud category, the greatest values of liquid water content are founrl three-quarters of the way up from the cloud base (maximum value in
cUllluli-form cloud is 0.37 g m-3 ) and the median volume
dia-meter increases from the base to the top for
cumuli-form clouds (17.8 to 23 ~m).
5.3. Stratification of the microstructure versus the
horizontal cloud length and versus the ice particle
concentration
The relation between the horizontal extent of
the cloud anrl the extent of icing is an important
meteorological parameter for the quantification of icing severity. Figure 8 shows the frequency distri-butions of the liquid water content plotted against
four ranges of the fractional cloud length which
con-tains a liquid water content greater than 0.05 g m-3 ,
for all the cloud categories. (For example, when the
fractional cloud length is J.25, this corresponds to
25% of the cloud penetration length, characterized
by a liquid water content >0.05 g m-3 and the
other 75% of the cloud only contains an ice particle
concentration greater than 0.1 particles per litre).
Table V sumlllarizes the mean values of the horizontal
cloud length HCL, in km, and the liquid water content
(mean values) in the same ranges as defined in Figure
8 for each cloud category. Figure 8 and Table V
suggest that the mean value of the liquid water
content increases with the proportion of cloud con-taining a liquid water content greater than
0.05 g m-3 for all cloud categories. The lowest
values of liquid water content were found rlurinq the longest cloud penetrations (6.2 km) which correspond
to the IllOst glaciated clouds. This trend i~ confirmed
in Figure 9 and Table VI where the frequency
distri-butions of the liquid water content are plotted
against four ranges of the ice particle concentration.
TABLE I!. MICROPHYSICAL CHARACTERISTICS OF THE THREE CLOIJD CATEGORIES
LWC
DV
IPC
HCL
g.m
3IJm
r
1km
MV
SO
MV
SO
MV
SO
MV
Cumuliform
0.33 0.25 20.8 6.9 10.1 21.9 4.5Low
Med.
strat.
0.29 0.19 16.15.7
2.95.7
3.9stral.
0.18 0.27 18.9 9.7 7.2 13.8 6.8LWC: liquid water content, DV: median volume diameter,
IPC:
ice particle concentration,HCL:
horizontal cloud e~te~t.MV
andSO
correspond to the mean'values and standard devlatlonsrespectively.
SO
4.9 4.6 9.3
Gayet and Bain: Icing cloud micr'ostr'uctur'e -15 > T -la
>
T) -IS - 5>
T) -lao
> T ~ -5o
<
H ' 0.25 0.25<
H<:
0.50 0.50<
H '0.75 0.75<
H , 1.0 100 100 FREOUENCIES ('/,) 50Figure 6
§ O( LWC~ 0.2 gm-3mm
0.2 < LWC~ 0.4 gm-J EZiI 0.4 < L WC ~ 0.8 SI m-Jo
0.8 < LWC 50Figure 7
o
All categories.30
.27
.36
.29
All categorieso
LWC DV .31 19.8 .35 20.0 .30 18.7 .23 17.3 Mean LWC 9.ni3Cum. Low stral. Med. strat.
.30
-
.36
.27
.31
.21
.41
.31
.11
.33
.26
.12
Table
III
Cum. Low st ra t. Med. stral.
LWC DV LWC DV LWC DV .32 23.0 .29 14.8 .22 20.1 .37 21.0 .32 17.2 .30 26.6 .32 19.8 .28 . 16.6 .18 15.7 .30 17.8 .22 16.2 .11 18.4
Table
IVFigs.6,? Frequency distributions of the cloud liquid water content LWC plotted against four ranges of the penetration temperature T (Fig.6) and against four ranges of the penetration level H (Fig.?). V-axis for Figures 6 and 7 also refer to Tables III and IV respectively (for tahle legends, see text).
o
< L , 0.25 0.25 < L , 0.50 0.50 < L , 0.75 MS<
L (; 1.0 I PC < 0.1 0.1 ' I PC <1.0 1. 0 , I PC < 1 0.0 10.0" I PC 100 100 FREOUENCIE S ('/,1 SO ~ 0 <LWC 1> 0.2 g.m-Jmmn
0.2 <LWC < 0.4 gm-J !221 0.4 <LWC < 0.8 gm-JDo
.
•
<LWC 50Figure 9
o
o
A" categories
Cum
.
L.
.
strat
.
M.strat.
HCL km LWC LWC LWC LWC6
.
2
0.08
0.09
0.07
0
.
05
4.1
0
.
19
0.21
0
.
20
0
.
08
4.40.25
0
.
28
0
.
21
0.26
4.2
0.40
0.42
0.36
0.32
Table
VMean
LWCg
.
m
3All categ
.
Cum.
L.
strat.
M.
strat.
0.32
0.37
0.26
0.10
0.36
0.36
0.34
0.45
0.30
0.33
0.31
0
.
14
0.23
0.25
0.16
0.09
Table
VIFigs.a,g. Frequency distributions of the cloud liquid water content LWC plotted against four ranges of the fractional cloud length L (Fig.a) and against four ranges of the ice particle concentration (Fig.9). V-axis of Figures a and 9<also refer to Tables V and VI respectively (for table legends, see text).
The largest values of liquid water content were
found in clouds contai~ing the lowest ice particle concentrations (less than one particle per litre). 6. DETECTION OF THE IC I NG ZONES FROM CONVENTIONAL
METEOROLOGICAL RADARS
The object of this section is to link meteoro-logical radar information with the microphysical par-ameters and to indicate the limitations of these radars when used as a means of locating icing clouds. To illustrate our purpose, we discuss the results of
two successive penetrations carried out with the DC7 aircraft in a growing cumulus congestus cloud at the
level 4 300 m a.s.l., with a temperature of _5°C (summer 1976).
Ouring the first traverse, the cloud is a single cell (labelled A) in the growing stage. The vari-ations of the vertical velocity and the microphysical parameters are shown in Figure 10. An updraft of 7 m s-l is found in the cloud core and the liquid
water content reaches 1 g m-3 • The median volume
diameter of the cloud droplet spectrum is about 15 ~m and no particles >200 ~m are measured. During
this penetration no echo was detected by the airborne meteorological radar* (A
=
3 cm, power=
220 k~ andrange scale = 200 NI", (0400 km). However a. 1 i gh~ icing was observed due to a short penetrat10n t1me
'111
10
E
5
O~~~~--~~~~~1.5
';'~
1.0
...9'1u
.5
~
I -
I
I
I
I __
I
OL--_----L.:'--_ _ ...>e:> _ _ - - - '30
~
15
>
o
o
10.
u
1-a...
cell
A
0.1
L...-_ _ _ _ _ _ _ _ _ _ _ _ _ _ _ _ ----'~IN CLOUD~
o
2 km
Fig.10. Variation along the flight track of the
vertical velocity WA, clouc1 water content LHC, median volume diameter DV, and ice particle concentration IPC measured during the first cloud penetration (4 300 m a.s. I., temperature of _5°C). * This is a modified version of the radar type DRAA
2B. In addition to the meteorological information, the radar also provides navigational information.
Cayet and Bain: Icing cloud micpostpuctupe
-;-1/1
10
E
<!5
~ 0!---"~..--.----rr-;>-~----~t-'rt'----'''<::=>1
1.5
7f;
1.0
.E
3.5
:..Jo
300
o
100.
10.
u1.
(l...0.1
o
2
km
aircraft trajectory
radar
echo
contour
'---)
B
Fig.11. As in Figure 10 for the second cloud penetration. Also shows radar echo contour. (40 s) and a low mean value of the liquid water content.
Figure 11 represents the evolution of the para-meters described above measured ten minutes later, during the second penetration of the same cloud, and the corresponding radar echo contour. This figure re-veals sharp discontinuities in the microphysical and dynamical features of the cloud and two cell s can be identified: 8, which is mainly composed of super-cooled droplets (liquid water content -1 g m-3 , med-ian volume diameter -15 ~m), and
A
(previously sam-pled) which presents no dynamical activity (vertical velocity approximately zero, low values of liquidwater content, noticeable concentration of particles greater than 200 ~m (up to 50 particles per litre), mec1ian volume diameter (calculated on the ASSP-10 C range 3<D<300 ~m) of about 200 ~m. Only cell A is correlated with the radar echo contour; however, the 1c1n9 was judged more severe in cell
B
(light) than in cellA (trace).These two examples show that the radar echo sig-nature is a consequence of precipitation particles and that all the icing zones are not related to the radar echo.
Gayet and Bain: Icing eloud miel"ostl"ueturo
The detection threshold depends on the concentra-tion, size, and, also, the nature of these particles (drops or ice crystals). From other investigations and considering the statistically significant mini-mum concentration of particles measured by the probes (10-C or 20-C), a concentration greater than
0.1 particles per litre >200 vm in diameter seems to
indicate the lowest limit of detectability with this radar. In the PEP data described in section V, about
27% of the clouds samp1 ed are characteri zed by very
low particle (O>200 vm) concentration (<0.1
partic-les per litre in non-precipitating clouds). This suggests that such a percentage of icing clouds
which contain a noticeable liquid water content
(mean value: 0.3 g m-3 , see Table VI) are not
detectable by conventional meteorological radars.
7. COtJCLU SIONS
From the data collected during several
experi-,;Jents in France, the Ivory Coast and Spain, the
range of the relevant icing parameters dre given.
Scattered values of liquid water content are found
at temperatures between -3 and -15°C due to the
spatial and temporal variabilities of the cloud
microstructure. Extreme values of liquid water
con-t~nt, up to 20 g m-3 were found in tropical
cumulo-nimbus cloud.
In Spain, the icing zones associated with the greatest values of liquid water content were found
in a range of temperature between -5 and -10°C and
were situated in the upper third quarter of the
cloud.
The most extensive clouds, horizontally, and the
most glaciated clouds present the lowest mean liQui~
water content and consequently t~e lowest icing
occurrence. These observations are found to be
generally true for the three suggested cloud
cate-gories. The detection of icing zones by conventional
meteorological radars seems to be ineffective for
27% of the sampled clouds. A specific experiment on
the teledetection of icing clouds was carried out
last winter (1981-a2) in France with an instrumented
helicopter (using similar devices to those described
here). The results (not yet published) confirm that
all icing clouds cannot he detected by conventional
meteorological radars. Allowance must therefore be
made for this inadequacy when radars dre used for
forecasting. The alternative is to use other methods.
ACK fIOWLEDGEr~E NT S
The authors would like to express their
appreci-ation to Professor Soul age for his guidance during
this stlJdy, Professor Coulman for his comments on
the manuscript, and ~r Pointin for helpful
dis-cussions. Thanks are due to the technical staff at
the Laboratoire Associ~ de M~t~oro10gie Physique,
Universit~ de C1ermont 11, and to the crews of
the aircraft used in these experiments.
This research was supported by the Direction des
Recherches Etudes et Techni~ues under the contracts
79.34.183 and 80.34.294.
REFERENCE S
Bain ~1, Gayet J F 1982 Aircraft measurements of
icing in supercooled and water droplets/ice
crystals clouds. Jour>nal of Applied Meteol"oZogy
21: 11-21
Gayet J F 1981 Participation du L.A.M.P.
a
1 'experience PEP 81. Labol"atoiro Assoeie de
Meteol"oZogie Physique. Rappol"t Seientifique
39
Gayet J F, Fri ed1 ander
r
'
l
1979 The DC 7 researchaircraft of the Centre d'Essais en Vo1 de Bretigny.
WMO Proeipitation Enhancement Pl"ojeet Repol"t 13
Gayet J F, Jarrnuzynski M, Soulage R G Unpublished.
Microstructure of an accumulation zone in a tropical
Cb cloud. Presented at the Conference on cloud physics
and atmospheric electricity, July 31-August 4, 1978, Issaquah, WA : 318-323 (Preprint)
72
Lake H B, Bradley J 1976 The problem of certifying
helicopters for flight in icing conditions.
Ael"onautieaZ Jour>naZ 80(790): 419-433
Ludl am S H 1951 The heat economy of a rimed cyl i nder.
Qual"tel"Zy Jour>naZ of the RoyaZ Meteol"oZogieaZ Soeiety
77: 663-666
Personne P, Brenguier J L, Pinty J
P,
PointinY
1982Comparative study and calibration of sensors for the measurement of the liquid water content of clouds
wi th sma 11 drop1 ets. Jour>naZ of Applied Meteol"oZogy