HAL Id: insu-00162748
https://hal-insu.archives-ouvertes.fr/insu-00162748
Submitted on 16 Jul 2007
HAL is a multi-disciplinary open access
archive for the deposit and dissemination of sci-entific research documents, whether they are pub-lished or not. The documents may come from teaching and research institutions in France or abroad, or from public or private research centers.
L’archive ouverte pluridisciplinaire HAL, est destinée au dépôt et à la diffusion de documents scientifiques de niveau recherche, publiés ou non, émanant des établissements d’enseignement et de recherche français ou étrangers, des laboratoires publics ou privés.
Variation of the water retention properties of soils:
Validity of class-pedotransfer functions
Hassan Al Majou, Ary Bruand, Odile Duval, Isabelle Cousin
To cite this version:
Hassan Al Majou, Ary Bruand, Odile Duval, Isabelle Cousin. Variation of the water retention prop-erties of soils: Validity of class-pedotransfer functions. Comptes Rendus Géoscience, Elsevier Masson, 2007, 339 (9), pp.632-639. �10.1016/j.crte.2007.07.005�. �insu-00162748�
Variation of the water retention properties of soils: Validity of class-pedotransfer functions
Variation des propriétés de rétention en eau des sols : Validité des classes de pédotransfert
HASSAN AL MAJOUa,b, ARY BRUANDa, ODILE DUVALc, ISABELLE COUSINc
a
Institut des Sciences de la Terre d’Orléans (ISTO), UMR 6113, CNRS – Université d’Orléans, 1A rue de la Férollerie, 45072 Orléans Cedex 2, France
b
Département des Sciences du Sol, Faculté Agronomique, Université de Damas, PO Box 30621, Damas, Syrie.
c
INRA, UR0272 Science du Sol, Centre de Recherche d’Orléans, BP20619, 45166 Olivet Cedex, France.
Corresponding author: [email protected]
Tel: 33 (0)2 38 25 53 96 Fax: 33 (0)2 38 63 64 88
Abstract
Water retention properties of soils vary according to soil characteristics and understanding of their variation remains controversial. Numerous pedotransfer functions (ptfs) that enable prediction of the water retention properties of soils were developed but their validity was poorly discussed. In this study we compare the performance of textural and texturo-structural class-ptfs with more sophisticated class- and continuous-ptfs developed using the same set of soils. We showed that the former led to prediction performance that are better or similar to those recorded with the more sophisticated class- and continuous-ptfs studied. Thus, textural and texturo-structural class-ptfs that are quite easy to establish are potentially worthwhile tools for predicting the water retention properties of soils, particularly at scales for which semi-quantitative or qualitative basic soil characteristic such as the texture are the only characteristic available. More generally, our results pointed out that the discussion of ptfs performance should refer to those recorded with easy to establish ptfs, thus enabling to quantify how much prediction bias and precision can be gained when increasing the complexity of ptfs and consequently the number and quality of predictors required.
Keywords: Texture, Bulk density, Horizon, Structure, Prediction bias, Prediction precision
Résumé
Les propriétés de rétention en eau des sols varient en fonction de leur composition et elles sont encore largement discutées. De nombreuses fonctions de pédotransferts (fpt) permettant de les prédire ont été développées mais leur validité n’a été que rarement discutée. Dans cette étude, nous comparons les performances de classes de fpt texturales et texturo-structurales développées en utilisant un même jeu de données. Nous montrons que les classes de fpt conduisent à des performances de prédiction qui sont meilleures ou similaires à celles
enregistrées avec les fpt plus sophistiquées étudiées par ailleurs dans cette étude. Ainsi, les classes de fpt texturales et texturo-structurales qu’il est aisé d’établir sont potentiellement des outils utiles pour la prédiction des propriétés de rétention en eau des sols, en particulier aux échelles auxquelles seules des données semi-quantitatives ou qualitatives comme la texture sont disponibles. Plus généralement, nos résultats mettent en évidence que les performances des fpt devraient être discutées en prenant comme référence celles enregistrées avec des fpt faciles à établir comme les classes de fpt texturales. En procédant ainsi, il est alors possible d’apprécier le gain de performance en terme de biais et de précision quand on complexifie les fpt et que l’on accroît le nombre et qualité des caractéristiques de sols requises.
Mots-clés : Texture, Densité apparente, Horizon, Structure, Biais de prédiction, Précision
Introduction
Understanding of soil water retention properties of soil remains a major issue in soil science. Because of the growing demand for soil hydraulic properties, a common solution has been to use pedotransfer functions (ptfs) that relate basic soil properties that are considered as easily accessible to the less often measured soil properties such as hydraulic properties [1]. A huge number of ptfs was developed over the last three decades and we are facing today to the continuous development of ptfs of increasing complexity with very little or no information about the potential increase in the prediction quality. There is some information available about the performance of continuous-ptfs [11, 17], very little about the performance of class-ptfs [14,17] and less again about the compared performance of these two types of class-ptfs [15]. The aim of this study is to show that variation of water retention properties can be predicted by using stratification based on information about particle size distribution and structure. We
show also that the quality of the prediction is similar or better than with much more sophisticated ptfs despite what is usually admitted.
Materials and methods
The ptfs developed in the literature
Most ptfs published in the literature are continuous-pedotransfer functions (continuous-ptfs), i.e. mathematical continuous functions between the water content at discrete values of potential or the parameters of a unique model of water retention curve and the basic soil properties (mostly particle size distribution, organic carbon content and bulk density) [12, 17]. Besides these continuous-ptfs that enable continuously the prediction of water content at particular water potentials [13] or estimation of the parameters of models of the water retention curve [5, 11, 17], there are class pedotransfer functions (class-ptfs) that received little attention because their accuracy is considered as limited [15]. The existing class-ptfs provide often average water contents at particular water potentials or one average water retention curve for every texture class [2, 10]. Due to the range in particle size distribution, clay mineralogy, organic matter content and structural development within each texture class, water retention properties for individual soils were considered as varying considerably [16]. Despite their possible inaccuracies, class-ptfs enable the prediction based on successive stratification using soil characteristics. Moreover, class-ptfs are easy to use because they require little soil information and are well adapted to the prediction of water retention properties over large areas [9, 15, 16]. There is some information available about the performance of continuous-ptfs [11, 17], very little about the performance of class-ptfs [14, 17] and less again about the compared performance of these two types of ptfs [15].
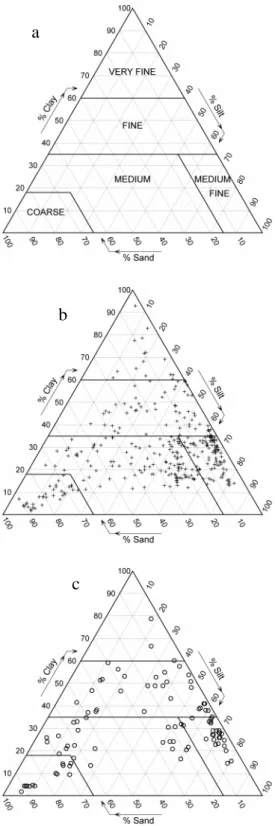
Class- and continuous-ptfs were developed using a set of 320 horizons comprising 90 topsoils (from 0 to 30 cm depth) and 230 subsoil horizons (>30 cm depth) collected in Cambisols, Luvisols, Planosols, Albeluvisols, Podzols and Fluvisols [8] located mainly in the Paris basin and secondarily in the western coastal marshlands and Pyrenean piedmont plain. A set of 107 horizons comprising 39 topsoil and 68 subsoil horizons was constituted in order to test the ptfs established. These horizons were collected in Cambisols, Luvisols and Fluvisols [8] located in the South of the Paris basin. Basic characteristics and water retention properties of the horizons were determined as earlier described by Bruand and Tessier [3] (Figure 1, Table 1). Their bulk density (Db) was measured by using cylinders 1000 cm3 in volume when the
soil was near to field capacity.
Analysis of the PTFs performance
In order to discuss the global validity of the ptfs, most studies used the root mean square error (RMSE) that is also called root mean squared deviation or root mean square residual [17]. Because the RMSE varies according to both the prediction bias and precision, we computed the mean error of prediction (MEP) that enables discussion of the prediction bias alone on one hand and the standard deviation of prediction (SDP) that enables discussion of the prediction precision alone on the other hand. We computed MEP and SDP for the whole water potentials as follows:
∑
∑
= = − ⋅ = l i i j m i j p l j l l MEP 1 , , , , ' 1 ' ( ) 1θ
θ
[
]
1/2 1 2 , , , , ' 1 ' ( ) 1 − − ⋅ =∑
∑
= = l i i j m i j p l j MEP l l SDPθ
θ
where
θ
p,j,i is the predicted water content at potential i for the horizon j,θ
m,i,j is the measuredwater content at potential i for the horizon j, and l is the number of water potentials for each horizon (l=7 in this study) and l’ is the number of horizons (l’ ≤ 107 in this study). The MEP corresponds to the bias and indicates whether the ptfs overestimated (positive) or underestimated (negative) the water content, whereas SDP measures the precision of the prediction.
In order to discuss the validity of the ptfs at the different water potentials we computed also the mean error of prediction (MEP’) and the standard deviation (SDP’) of prediction at every water potential as follows:
(
)
∑
= − = ' 1 , , ' ' 1 l j j m j p l MEPθ
θ
(
)
[
]
2 1/2 ' 1 ' , , ' ' 1 − − =∑
= l j j m j p MEP l SDPθ
θ
.Results and discussion
The class- and continuous-ptfs developed
The ptfs developed in this Note were established according to the texture (textural class-ptfs) in the CEC triangle [4] and then according to both that texture and Db (texturo-structural
class-ptfs). The resulting class-ptfs corresponded to the average water content at 7 water potentials that was computed within every class of texture (textural class-ptfs) (Table 2) and every class combining both texture and Db (texturo-structural class-ptfs) (Table 3). More
complex class-ptfs were established by fitting the van Genuchten’s model [6] on the arithmetic mean value of
θ
at the different values of water potential using the RETC code [7]for every class of texture (VG texture class-ptfs) according to the CEC triangle [4] and the type of horizon (topsoil and subsoil) (Table 4).
Continuous-ptfs were also developed. They correspond to multiple regression equations as follows:
θ
= a + (b×%Cl) + (c×%Si) + (d×%OC) + (e×Db)with
θ
, the volumetric water content at a given water content, a, b, c and e the regressioncoefficients, %Cl and %Si, respectively the clay and silt content, %OC, the organic carbon content and Db, the bulk density (Table 5). Other continuous-ptfs were developed as earlier
done by Wösten et al. [16] for the parameters of the van Genuchten’s model using multiple regression equations (VG continuous-ptfs) (Table 6). For every horizon, the parameters of the van Genuchten’s model were computed using the RETC code [7].
Validity of the class-ptfs
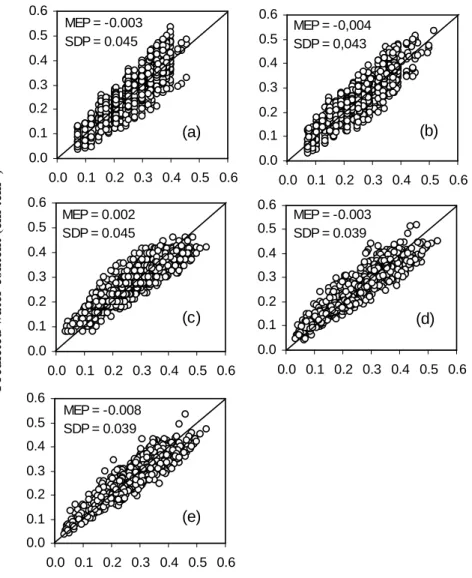
The textural class-ptfs underestimated very slightly the water retained (MEP = –0.003 cm3 cm-3) when they are applied to the test dataset without any other stratification than according to the texture. There was no decrease in the prediction bias with the texturo-structural class-ptfs (MEP = –0.004 cm3 cm-3) but the bias was already very small with the textural class-ptfs studied. However the precision was slightly better with the texturo-structural class-ptfs (SDP = 0.043 cm3 cm-3) than with the textural class-ptfs (SDP = 0.045 cm3 cm-3) (Figure 2a and b). Compared to the textural class-ptfs, the VG textural class-ptfs showed similar performance. The bias was very small (MEP = 0.002 cm3 cm-3) and the precision poor (SDP = 0.045 cm3 cm-3) as recorded for the textural class-ptfs (Figure 2c). The comparison of the class-ptfs performance at every value of water potential showed small bias (–0.008 ≤ MEP’ ≤ 0.007 cm3 cm-3) except for
θ
4.2 for the textural and texturo-structural class-ptfs (MEP’ = –0.020 and –0.019 cm3 cm-3) and forθ
1.0 for the VG Class-ptfs (MEP’ = 0.014cm3 cm-3) for which it was greater (Table 7). This comparison showed also poor precision for the three class-ptfs studied whatever the water potential (0.040 ≤ SDP’ ≤ 0.047 cm3 cm-3).
Validity of the continuous-ptfs
When applied to the test data set, the continuous-ptfs leads to very small bias (MEP = –0.003 cm3 cm-3) and showed poor precision (SDP = 0.039 cm3 cm-3). Results showed a greater bias with the VG continuous-ptfs (MEP = –0.008 cm3 cm-3) and similar poor precision (SDP = 0.039 cm3 cm-3) than with the continuous-ptfs (Figure 2d and e). The comparison of the continuous-ptfs performance at every value of water potential showed small bias for the continuous-ptfs (–0.006 ≤ MEP’ ≤ 0.005 cm3 cm-3) except for
θ
4.2 (MEP’ = –0.022 cm3 cm-3). For the VG continuous-ptfs the bias was greater for six water potentials with absolute value ofMEP’ ≤ 0.020 cm3 cm-3 except for
θ
1.5 (MEP’ = 0.004 cm3 cm-3) (Table 7). The precision was poor for the simple and VG Continuous-ptfs (0.030 ≤ SDP’ ≤ 0.044 cm3 cm-3) but results showed that SDP decreased with the water potential.Comparison of the class- and continuous-ptfs
Results showed very little difference between the ptfs studied. The bias recorded was small (– 0.008 ≤ MEP ≤ 0.002 cm3.cm-3) and the greatest absolute value of bias was recorded with the VG continuous-ptfs (MEP = –0.008 cm3.cm-3). On the other hand, the precision was poor (0.039 ≤ SDP ≤ 0.045 cm3.cm-3), the greatest precision being recorded with the two types of continuous-ptfs studied. If the VG Continuous-ptfs led to the greatest precision (SDP = 0.039 cm3.cm-3), they led also the greatest value of bias (MEP = –0.008 cm3.cm-3).
Our results showed that textural class-ptfs led to prediction performance that are similar to those recorded with more sophisticated class-ptfs and with continuous-ptfs. Thus without knowing the particle size distribution, organic carbon content and bulk density as required by most ptfs, we can predict the water retention properties with similar prediction quality by using the texture alone. Our results showed also that use of both texture and bulk density slightly increase the precision when compared to the precision recorded with the textural class-ptfs. Finally, we showed also that class-ptfs, including very simple ptfs, should be still considered as useful tools for predicting the water retention properties of soils, particularly at scales for which semi-quantitative or qualitative basic soil characteristic such as the texture are the only characteristic available. More generally, our results pointed out that discussion of ptfs performance should refer to those recorded with simple ptfs, thus enabling to quantify how much prediction bias and precision can be gained when increasing the complexity of ptfs and consequently the number and quality of predictors required.
References
[1] J. Bouma, H.A.J. van Lanen, Transfer functions and threshold values: from soil characteristics to land qualities. p 106–111. In: Beek K.J., P.A. Burrough and D.E. McCormack (eds.), Proc. ISSS/SSSA Workshop on Quantified Land Evaluation Procedures. Int. Inst. for Aerospace Surv. and Earth Sci., Publ. No 6, Enschede, The Netherlands (1987).
[2] A. Bruand, P. Pérez Fernandez, O. Duval, Use of class pedotransfer functions based on texture and bulk density of clods to generate water retention curves. Soil Use and Management, 19 (2003) 232–242.
[3] A. Bruand, D. Tessier, Water retention properties of the clay in soils developed on clayey sediments: Significance of parent material and soil history. European Journal of Soil Science, 51 (2000) 679– 688.
[4] Commission of the European Communities (CEC), Soil map of the European Communities. Scale 1:1000000. CEC-DGVI, Luxembourg (1985).
[5] H.P. Cresswell, Y. Coquet, A. Bruand, N.T. McKenzie, The transferability of Australian pedotransfer functions for predicting water retention characteristics of French soils. Soil Use and Management, 22 (2006) 62–70.
[6] M.Th. van Genuchten, A closed-form equation for predicting the hydraulic conductivity of unsaturated soil. Soil Science Society of America Journal, 44 (1980) 892–898.
[7] M.Th. van Genuchten, F.J. Leij, S.R. Yates, The RETC code for quantifying the hydraulic functions of unsaturated soils. USDA Salinity Laboratory, Riverside, CA, United States Environmental Protection Agency, document EPA/600/2-91/065 (1991).
[8] ISSS Working Group RB, World Reference Base for Soil Resources: Introduction (eds J.A. Deckers, F.O. Nachtergaele & O.C. Spaargaren), First Ed. International Society of Soil Science (ISSS). ISRIC-FAO-ISSS-Acco. Leuven (1998).
[9] A. Lilly, J.H.M. Wösten, A. Nemes, C. Le Bas, The development and use of the HYPRES database in Europe. In: MTh van Genuchten & FJ Leij, eds, Characterization and measurement of the hydraulic properties of unsaturated porous media. Proceedings of the International Workshop Riverside, California, October 22-24, 1997 (1999) pp 1283-1204. [10] A. Nemes, M.G. Schaap, J.H.M. Wösten, Functions evaluation of pedotransfer functions
derived from different scales of data collection. Soil Science Society of America Journal, 67, (2003) 1093–1102.
[11] B. Minasmy, A.B. McBratney, K.L. Bristow, Comparison of different approaches to the development of pedotransfer functions for water-retention curves. Geoderma, 93, 225–253.
[12] Pachepsky, Y.A, Rawls, W.J., Lin, H.S., 2006. Hydropedology and pedotransfer functions. Geoderma. 131 (1999) 308–316.
[13] W.J. Rawls, D.L. Brakensiek, K.E. Saxton, Estimation of soil water properties. Trans. ASAE, 26 (1982) 1747–1752.
[14] F. Ungaro, C. Calzolari, E. Busoni, Development of pedotransfer functions using a group method of handling for the soil of the Pianura Padano – Veneta region of North Italy: water retention properties. Geoderma, 124 (2005) 293–317.
[15] J.H.M Wösten, P.A. Finke, M.J.W Jansen, Comparison of class and continuous pedotransfer functions to generate soil hydraulic characteristics. Geoderma, 66 (1995) 227– 237.
[16] J.H.M Wösten, A. Lilly, A. Nemes, C. Le Bas, Development and use of a database of hydraulic properties of European soils. Geoderma, 90 (1999) 169–185.
[17] J.H.M. Wösten, Y.A. Pachepsky, W.J. Rawls, Pedotransfer functions: bridging the gap between available basic soil data missing soil hydraulic characteristics. Journal of Hydrology, 251 (2001) 123–150.
Fig. 1: Triangle of texture used (a), texture of the horizons used to develop the class- and continuous-ptfs (b) and texture of those used to test their validity (c).
Fig. 1 : Triangle de texture utilisé (a), texture des horizons utilisés pour développer les classes de fpt et les fpt continues (b) et texture des horizons utilisés pour discuter leur validité (c).
a
b
Fig. 2: Validity of the textural class-ptfs (a), texturo-structural class-ptfs (b), VG textural class-ptfs
(c), continuous-ptfs (d), and VG continuous-ptfs (e) developed.
Fig. 2 : Validité des classes de fpt texturales (a), texturo-structurales (b) et VG texturales (c), ainsi que
des fpt continues (d) et VG continues. 0.0 0.1 0.2 0.3 0.4 0.5 0.6 0.0 0.1 0.2 0.3 0.4 0.5 0.6 MEP = -0.003 SDP = 0.045 0.0 0.1 0.2 0.3 0.4 0.5 0.6 0.0 0.1 0.2 0.3 0.4 0.5 0.6 MEP = -0,004 SDP = 0,043 (b) 0.0 0.1 0.2 0.3 0.4 0.5 0.6 0.0 0.1 0.2 0.3 0.4 0.5 0.6 MEP = -0.003 SDP = 0.039 0.0 0.1 0.2 0.3 0.4 0.5 0.6 0.0 0.1 0.2 0.3 0.4 0.5 0.6 MEP = 0.002 SDP = 0.045 (a) (c) (d) 0.0 0.1 0.2 0.3 0.4 0.5 0.6 0.0 0.1 0.2 0.3 0.4 0.5 0.6 MEP = -0.008 SDP = 0.039 (e) P re d ic te d w a te r co n te n t (c m 3 .c m -3 )
Table 1
Characteristics of the horizons of the data set used to develop the ptfs and of the test data set. Tableau 1
Caractéristiques des horizons de l’ensemble de données utilisé pour développer les fpt et de celui utilisé pour en discuter la validité.
Particle size distribution (%)
Volumetric water content (cm3 cm-3)
<2 µm 2-50 µm 50-2000 µm OC g.kg-1 CaCO3 g.kg-1 CEC cmolckg-1 Db g.cm-3 θ1.0 θ1.5 θ2.0 θ2.5 θ3.0 θ3.5 θ4.2
Horizons used to establish class- and continuous-ptfs (n=320)
mean 28.9 46.2 24.9 5.7 65 14.3 1.53 0.350 0.335 0.316 0.289 0.257 0.220 0.179 s.d. 15.1 20.8 23.9 4.9 189 8.0 0.15 0.067 0.065 0.070 0.070 0.075 0.074 0.070 min. 1.9 2.8 0.1 0.0 0.0 0.8 1.00 0.123 0.100 0.080 0.056 0.048 0.033 0.013 max. 92.9 82.1 90.1 28.8 982 52.8 1.84 0.606 0.596 0.586 0.558 0.510 0.462 0.370
Horizons used to test the ptfs (n=107)
mean 30.2 40.6 29.2 6.6 38 15.8 1.51 0.356 0.332 0.312 0.287 0.261 0.224 0.202 s.d. 15.4 24.3 28.6 5.3 134 10.8 0.13 0.075 0.079 0.082 0.084 0.086 0.083 0.080 min. 1.9 4.1 1.6 0.0 0.0 0.6 1.10 0.161 0.121 0.099 0.072 0.045 0.041 0.033 max. 78.7 80.3 91.8 28.2 656 50.2 1.77 0.534 0.498 0.482 0.457 0.440 0.396 0.369
Table 2
Textural class-ptfs developed. Tableau 2
Classes de fpt texturales développées.
Volumetric water content (cm3 cm-3)
θ1.0 θ1.5 θ2.0 θ2.5 θ3.0 θ3.5 θ4.2 Very fine (n = 15) 0.455 0.437 0.424 0.402 0.385 0.357 0.322 Fine (n = 60) 0.399 0.388 0.373 0.351 0.331 0.301 0.254 Medium fine (n = 96) 0.356 0.342 0.327 0.298 0.254 0.210 0.173 Medium (n = 117) 0.334 0.320 0.302 0.273 0.242 0.203 0.156 Coarse (n = 32) 0.249 0.224 0.181 0.149 0.120 0.100 0.076 Table 3
Texturo-structural class-ptfs developed. Tableau 3
Classes de fpt texturo-structurales développées.
Volumetric water content (cm3 cm-3)
θ1.0 θ1.5 θ2.0 θ2.5 θ3.0 θ3.5 θ4.2 1.10≤ Db<1.30 0.498 0.473 0.451 0.423 0.405 0.371 0.330 1.30≤ Db<1.50 0.459 0.439 0.428 0.405 0.385 0.352 0.328 Very Fine (n =15) 1.50≤ Db<1.70 0.359 0.359 0.361 0.353 0.347 0.340 0.294 1.00≤ Db<1.20 0.519 0.499 0.494 0.461 0.431 0.373 0.281 1.20≤ Db<1.40 0.452 0.443 0.421 0.385 0.373 0.340 0.271 1.40≤ Db<1.60 0.391 0.378 0.361 0.344 0.321 0.289 0.250 Fine (n = 32) 1.60≤ Db<1.80 0.338 0.334 0.325 0.307 0.291 0.275 0.244 1.20≤ Db<1.40 0.348 0.338 0.323 0.291 0.232 0.188 0.153 1.40≤ Db<1.60 0.359 0.343 0.328 0.298 0.258 0.211 0.175 Medium Fine (n = 96) 1.60≤ Db<1.80 0.353 0.345 0.329 0.303 0.263 0.230 0.190 1.20≤ Db<1.40 0.354 0.337 0.314 0.278 0.245 0.193 0.140 1.40≤ Db<1.60 0.346 0.329 0.310 0.275 0.235 0.193 0.146 1.60≤ Db<1.80 0.320 0.307 0.293 0.270 0.248 0.214 0.167 Medium (n = 117) 1.80≤ Db<2.00 0.296 0.289 0.274 0.266 0.258 0.231 0.186 1.40≤ D<1.60 0.241 0.210 0.164 0.135 0.106 0.093 0.075 Coarse
Table 4
Parameters of the van Genuchten’s model corresponding to the VG textural class-ptfs developed according to the type of horizon (topsoil and subsoil).
Tableau 4
Paramètres du modèle de van Genuchten correspondant aux classes de ptf VG texturales développées en fonction du type d’horizon (horizon de surface et horizon de subsurface).
θr θs α n m Topsoils Coarse 0,025 0,397 1,0592 1,1530 0,1327 Medium 0,010 0,428 0,4467 1,1000 0,0909 Medium fine 0,010 0,465 0,6860 1,1027 0,0931 Fine 0,010 0,477 0,6153 1,0652 0,0612 Very Fine 0,010 0,587 5,9433 1,0658 0,0617 Subsoils Coarse 0,025 0,367 1,0535 1,1878 0,1581 Medium 0,010 0,388 0,1851 1,0992 0,0903 Medium fine 0,010 0,416 0,1611 1,0978 0,0891 Fine 0,010 0,437 0,1334 1,0632 0,0594 Very Fine 0,010 0,472 0,0745 1,0499 0,0475 Table 5
Regression coefficients and coefficient of determination R2 recorded for the continuous-ptfs developed.
Tableau 5
Coefficients de régression et coefficients de détermination R2 enregistrés pour les ptf continues développées.
Water potential (hPa)
-10 -33 -100 -330 -1000 -3300 -15000 a 0.4701*** 0.3556*** 0.2620*** 0.1301*** 0.0184 -0.0504 -0.0786** b 0.0026*** 0.0029*** 0.0034*** 0.0038*** 0.0045*** 0.0047*** 0.0045*** c 0.0006*** 0.0008*** 0.0012*** 0.0012*** 0.0008*** 0.0005*** 0.0003*** d -0.0006 -0.0002 0.0002 0.0010 0.0017*** 0.0012** 0.0004 e -0.1447*** -0.0939*** -0.0647*** -0.0084 0.0398* 0.0697*** 0.0710*** R2 0.59 0.64 0.69 0.74 0.77 0.82 0.86
θ = a + (b×%Cl) + (c×%Si) + (d×%OC) + (e×Db) with θ volumetric water content at a given water content.
*** P = 0.001. ** P = 0.01. * P = 0.05.
Table 6
VG continuous-ptfs developed for the parameters of the van Genuchten’s model. Tableau 6
Relations correspondent aux fpt VG continues développées pour les paramètres du modèle de van Genuchten. θθθθs = 1.1658 – 0.0032*C – 0.4737*D + 2*10-7*S2 – 0.0001*OC2 + 0.0373*C-1 + 0.0131*S-1 – 0.0072*ln(S) + 0.00003*OC*C + 0.0022*D*C – 0.0002*D*OC – 0.0001*S (R2 = 0.95) αααα* = 25.61+ 0.0439*C + 0.1129*S + 1.1914*OC + 32.21*D – 10.48*D2 – 0.0009*C2 – 0.0146*OC2 – 0.3781*OC-1 – 0.0178*ln(S) – 0.1032*ln(OC) – 0.1*D*S – 0.6001*D*OC
(R2 = 0.26)
n* = – 15.29 – 0.0659*C + 0.0115*S – 0.2115*OC + 12.33*D – 1.3578*D2 + 0.0006*C2 + 0.0031*OC2 + 4.0005*D-1 + 2.2003*S-1 + 0.1643*OC-1 – 0.1205*ln(S) + 0.2693*ln(OC) – 9.9367*ln(D) + 0.003*D*C + 0.0694*D*OC
(R2 = 0.35)
θs is a model parameter, α* , n* are transformed model parameters in the Mualem-van Genuchten equations; C = percentage clay
Table 7
Validity of the continuous- and class-ptfs according to the water potential. Tableau 7
Validité des classes de fpt et des fpt continues aux différentes valeurs de potentiel de l’eau.
Volumetric water content (cm3.cm-3)
Mean Error of Prediction (MEP’) Standard Deviation of Prediction (SDP’)
θ1.0 θ1.5 θ2.0 θ2.5 θ3.0 θ3.5 θ4.2 θ1.0 θ1.5 θ2.0 θ2.5 θ3.0 θ3.5 θ4.2 Textural class-ptfs -0.006 0.004 0.003 0.001 -0.004 -0.001 -0.020 0.046 0.046 0.044 0.045 0.047 0.044 0.042 Texturo-structural class-ptfs -0.006 0.002 0.002 0.001 -0.005 -0.002 -0.019 0.042 0.042 0.041 0.043 0.045 0.044 0.041 VG class-ptfs 0.014 0.007 -0.003 -0.008 -0.007 0.007 0.002 0.045 0.045 0.045 0.046 0.046 0.043 0.040 Continuous-ptfs -0.006 0.001 0.005 0.001 -0.003 0.002 -0.022 0.044 0.044 0.040 0.039 0.036 0.032 0.030 VG continuous-ptfs 0.012 0.004 -0.008 -0.017 -0.020 -0.008 -0.016 0.044 0.041 0.038 0.039 0.035 0.033 0.032