HAL Id: hal-00317606
https://hal.archives-ouvertes.fr/hal-00317606
Submitted on 30 Mar 2005
HAL is a multi-disciplinary open access
archive for the deposit and dissemination of
sci-entific research documents, whether they are
pub-lished or not. The documents may come from
teaching and research institutions in France or
abroad, or from public or private research centers.
L’archive ouverte pluridisciplinaire HAL, est
destinée au dépôt et à la diffusion de documents
scientifiques de niveau recherche, publiés ou non,
émanant des établissements d’enseignement et de
recherche français ou étrangers, des laboratoires
publics ou privés.
Influence of the ionosphere on the altitude of discrete
auroral arcs
C. S. Deehr, M. H. Rees, A. E. H. Belon, G. J. Romick, D. Lummerzheim
To cite this version:
C. S. Deehr, M. H. Rees, A. E. H. Belon, G. J. Romick, D. Lummerzheim. Influence of the ionosphere
on the altitude of discrete auroral arcs. Annales Geophysicae, European Geosciences Union, 2005, 23
(3), pp.759-766. �hal-00317606�
SRef-ID: 1432-0576/ag/2005-23-759 © European Geosciences Union 2005
Annales
Geophysicae
Influence of the ionosphere on the altitude of discrete auroral arcs
C. S. Deehr, M. H. Rees, A. E. H. Belon, G. J. Romick, and D. LummerzheimThe Geophysical Institute University of Alaska Fairbanks 903 Koyukuk Ave Fairbanks, Alaska 99775-7320, USA Received: 24 August 2004 – Revised: 2 January 2005 – Accepted: 21 January 2005 – Published: 30 March 2005
Abstract. The altitude of the maximum luminosity of single,
discrete auroral arcs was measured by photometric triangu-lation from two stations (College and Fort Yukon, Alaska) located 226 km apart on nearly the same magnetic meridian. The average height of the evening aurora decreases smoothly with increasing solar depression angle (sda) from 160 km near 12◦sda to 100 km after 18◦sda. The average height re-mains constant until around 12◦sda in the morning. This diurnal variation is similar to that of the electron density in the F region of the ionosphere. Thus, the behavior is consis-tent with the concept that the mean auroral electron energy increases as the ionospheric conductivity decreases due to ionospheric recombination in the evening twilight. However, the mean electron energy decreases in magnitude at dawn when the solar ionizing radiation returns and the electron density in the F region increases. The magnetospheric ac-celeration mechanism associated with discrete auroral arcs thus appears to be inversely proportional to the ionospheric conductivity, because the time variation of the acceleration mechanism coincides with the local F region electron den-sity and not with any obvious magnetospheric process. Pre-vious auroral altitude observations, using similar triangula-tion methods, showed that the altitude of discrete auroral arcs increases as a function of latitude. When these data are cor-rected for the twilight effect, the dependence of altitude on latitude disappears. Thus, the average altitude of discrete au-roral arcs and, by inference the magnetospheric auau-roral elec-tron acceleration mechanism, is significantly influenced by the initial ionospheric conductance.
Keywords. Ionosphere (Auroral ionosphere) –
Magneto-spheric physics (Magnetosphere – Ionosphere interactions) – Space plasma physics (charged particle motion and accel-eration)
1 Introduction
Prior to the advent of in-situ measurements using rockets and satellites, ground-based observations contributed widely to our knowledge of auroral processes. In addition to
occur-Correspondence to: C. S. Deehr
rence frequency and location, measurements of the altitude of the aurora have been used to determine a number of pa-rameters including incoming particle energy, magnetospheric origin, and atmospheric and plasma effects. Methods include paralactic photography (first used by Størmer) (Fuller, 1933; Størmer, 1946), photometric triangulation (Romick and Be-lon, 1967b), and single station photography (Rees, 1963). When these measurements of the altitude of lower borders, maximum luminosity, or any identifiable features are com-pared with the incoming particle energies using model atmo-spheres, reaction rates and excitation cross-sections, agree-ment within approximately 20% is usually achieved, with the remainder attributed to uncertainties of the model input pa-rameters, and unknown processes.
Scientists at the Geophysical Institute of the University of Alaska began a program of two-station photometric tri-angulation of the aurora during the International Geophysi-cal Year (IGY, 1957–1958). This program was continued in Alaska for approximately two decades until 1978. Since that time, the meridian-scanning photometers in the auroral zone have been used mainly to provide a matrix time series of au-roral emissions in the N/S geomagnetic meridian for synoptic studies (Lummerzheim et al., 1990) and only sporadically for auroral height determination (Sigernes et al., 1996).
There were two main data sets: The first was taken in the 1960s during the IGY and the International Quiet Sun Year (IQSY, 1964–1965). These data were taken with 2.8” diam-eter telescopes either scanning or pointed at a 45◦ rotating mirror and recorded as analog voltage changes using paper charts or 16 mm film. The second data set was an improved system using tilting filters to separate the background sig-nal from the emission of interest and digital photon counting electronic signals recorded as frequency modulated levels on magnetic tape. The former set successfully measured lumi-nosity profiles (Belon et al., 1966), auroral heights (Romick and Belon, 1967a; Romick and Belon, 1967b), and occur-rence frequencies (Stringer and Belon, 1967), but was of limited use in morphology studies because of background contamination (Belon et al., 1974). The problem of back-ground contamination was solved with the introduction of the tilting filters, and the interest in altitude/luminosity pro-files was replaced by studies of the relative morphologies of
760 C. S. Deehr et al.: Discrete auroral arc altitude
individual emissions, especially for the separation of hydro-gen emission from electron-induced aurora (Deehr and Lum-merzheim, 2001). Photon counting, combined with computer control was introduced by 1976 (Romick, 1976), so only one season of simultaneous msp measurements were made be-tween FYU and PKR before the Fort Yukon msp was moved to Longyearbyen, Svalbard in the summer of 1978 (Deehr et al., 1980)
Extensive observing efforts during the IGY culminated in a series of height measurements of discrete auroral arcs for six days near the end of March 1960. These arcs were cho-sen from strip chart data and the triangulation and plotting procedures were carried out by hand. Plots were made of the altitude of single, discrete arcs as a function of time and lat-itude. A highly distracting result of this exercise turned up in the form of a twilight decay of altitude in the evening and a sudden increase in the morning. The effect was duly re-ported at a scientific meeting (Belon and Romick, 1962) and puzzled over for at least two years. When no physical pro-cess (including competing excitation propro-cesses and diurnal atmospheric density variations) was found to account for the effect, it was apparently forgotten.
By the end of the decade, computer processing of data had begun, and the altitude of “quiet” (discrete) arcs for the 1965/1966 season had been read onto IBM cards. These ob-servations, along with the station locations at Ester Dome (EDO), Fort Yukon (FYU), and Bar I (Herschel Island) were used to calculate the altitude of the arcs as a function of diur-nal time and latitude by John Stuart Boyd, a master’s degree student at the time. Boyd’s thesis (Boyd, 1969), described a diurnal variation, decreasing in the evening and constant through the night. Most attention, however, was directed to the increasing altitude with latitude that he found during all time periods (Boyd et al., 1971). These data were combined with Størmer’s lower latititude observations (Størmer, 1946) by (Omholt, 1971) to show a convincing plot of increas-ing altitude with latitude. Inconsistencies between a num-ber of data sets showing various result of the latitude effect, led Deehr (Deehr, 1983) to conclude “With all other effects either unimportant or removed, the geomagnetic latitude is shown to have a strong influence on the height of the aurora observed... Data sets from different periods are irreconcil-able, however, and it is suggested that differing solar activity may be the cause.” It is unfortunate that Boyd’s data were recorded on IBM cards that were discarded after they could no longer be easily read.
We would have been left with this enigma if it were not for a fortunate circumstance near the end of the 1980s when one of us (C. Deehr) saved the envelope containing the plots of the 1960 auroral heights data from the trash during a clean-up at the Geophysical Institute. Thus, the twilight effect was again briefly revived and then forgotten one more time. It was finally remembered for good when Newell et al. com-pleted a large statistical comparison of auroral acceleration events in the sunlit and non-sunlit ionosphere (Newell et al., 1996; Newell et al., 1996). They found that the magneto-spheric auroral acceleration mechanism originally proposed
by Evans (Evans, 1968), is a function of local magnetic time, and is less frequent in the sunlit atmosphere. They compared DMSP satellite observations of electron spectra for solar zenith angles <85◦with those for solar zenith angles >110◦ and found the acceleration mechanism to be surpressed dur-ing the day. It became obvious then that the change in alti-tude of auroral arcs in twilight is probably a manifestation of the transition in auroral electron spectra between the sunlit and non-sunlit atmospheres. It is the purpose of this paper to document that relationship and to expose the ramifications of this discovery in previous studies of the altitude of discrete auroral arcs.
2 Instrumentation
The meridian-scanning photometers used in the IGY stud-ies are described by Romick and Belon (Belon et al., 1966; Romick and Belon, 1964). They consisted of four parallel telescopes mounted in a yoke and motorized in elevation to scan the geomagnetic meridian once per minute. A field stop at the focal point of the 2.8” aperture f/3.0 objective lens was configured to be 1◦vertically and 4◦ horizontally to illumi-nate the rectangular photocathode of an RCA 1P21 photo-multiplier. Four auroral emissions were isolated with inter-ference filters with a typical half-transmission bandwidth of 10 ˚A and 50% transmission at the wavelengths of interest: 3914 ˚A (N+2 1 N.G.), 5577 ˚A [OI] 1S, 6300 ˚A [OI] 1D, and 6475 ˚A (N2 1 P.G.). A U.S.-IGY all-sky camera and
a meridian spectrograph were also operated routinely to aid in the selection and interpretation of the meridian-scanning photometer data.
3 Observations
The photometric observations of quiet, discrete auroral arcs in March of 1960 were carried out from two stations: Col-lege, Alaska (Ballaine Lake, 64◦ 52◦N Lat., 147◦ 49◦W Long.) and Fort Yukon, Alaska (66◦ 34◦N Lat., 145◦ 17◦W Long.), located approximately on the same geomag-netic meridian at 257◦magnetic longitude. The location of the stations and the extent of the observational horizon are shown in Fig. 1. The span of magnetic latitude for the mea-surement of arc altitude was determined to be between 61◦ and 70◦magnetic latitude (Romick and Belon, 1967a). The combined error in latitude and altitude approached 15 km, or one pressure scale height around 150 km altitude when the elevation of the auroral arc above the horizon from the far-thest station fell below 10◦.
Figure 2 shows the method of isolating the luminosity of a single, discrete arc seen from the two stations. First, the arc was underdrawn by hand in order to isolate the luminosity of the background and then subtract it from the scan. The remaining curve was corrected for extinction and scattering and the elevation angle of the peak in the corrected curve was noted from both stations. Correction for scattering from the background or other arcs was found to be insignificant in
Fig. 1. The location along the 256◦magnetic longitude and extent of observations from the two Alaskan stations used in this study of the altitude of discrete auroral arcs by photometric triangulation.
cases when the single discrete arc of interest was the brightest source in the sky (Belon et al., 1966). The brightest atomic line (5577 ˚A [OI]) in the visible spectrum was best suited to the analysis. Figure 3 shows an example of the location of maximum intensity at the intersection of lines drawn at the elevation angle of the peak corrected curve from each of two stations (Belon et al., 1966).
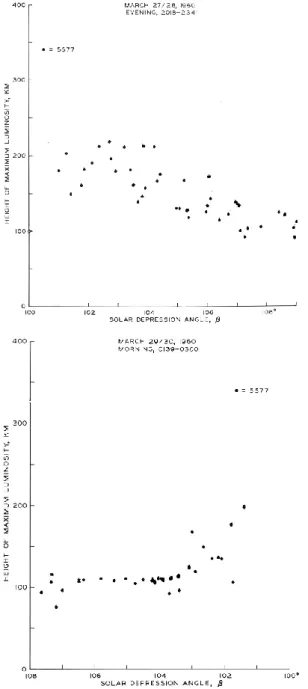
Figure 4 shows the altitude of the maximum 5577 ˚A [OI] emission brightness of discrete auroral arcs as a function of solar depression angle for the evening twilight (Fig. 4a, 27 March 1960) and for the morning twilight (Fig. 4b, 30 March 1960). Note that the altitude decreases slowly in the evening from around 200 km when observations begin at 11◦ solar
depression angle to the average nighttime altitude of 100 km by astronomical twilight at 18◦solar depression angle. In the
morning, the altitude is relatively constant from astronomical twilight until around 13◦solar depression angle when it in-creases nearly to 200 km by the end of observations at 11◦ so-lar depression angle. This pattern is unique to this particuso-lar day. When all of the data points from the March/April, 1960 data set are plotted together in Figs. 5a and b for evening and morning twilight, respectively, the evening decrease re-mains, but the morning altitudes remain essentially the same throughout twilight (as does the Pedersen conductance).
The magnitude of the change in altitude of the discrete au-roral arcs between 11◦and 18◦solar depression angle in the
Fig. 2. Raw data from two simultaneous photometer scans from
College and Fort Yukon (upper panel). The background brightness is removed by subtracting the dotted line from the data. The peaks in the remaining data are used to triangulate on the location of max-imum brightness (lower panel).
Fig. 3. Showing the method of locating the maximum 5577 ˚A [OI] intensity as triangulated from the two stations in the magnetic meridian.
evening is as much as 100 km, or several times the mean pres-sure scale height in the region. The change in arc altitudes in the morning (even when we include the five sporadic high measurements) is insignificant in comparison. This change in arc altitude reflects a change in the energy of the primary energetic electron stream above the atmosphere. An estimate
762 C. S. Deehr et al.: Discrete auroral arc altitude
Fig. 4. (a) The height of maximum brightness of 5577 ˚A [OI] emis-sion as a function of solar depresemis-sion angle for the evening twilight
at College Alaska on 27 March 1960 (20:18–23:41 150◦WMT).
(b) Same as Fig. 4a, except for morning twilight, 30 March 1960
(01:39–03:00, 150◦WMT)
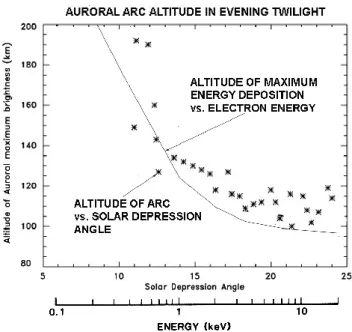
of the magnitude of this energy change was calculated by (Rees et al., 1987), and this curve plotted in Fig. 6 shows that the change in altitude of the auroral arcs during twilight cor-responds to a change of the energetic primary electron stream from 100 eV near nautical twilight to 3 keV for the average nighttime value.
There is a significant scatter in the observed auroral alti-tudes. Some points are well beyond the single pressure scale height estimated error discussed earlier in this section. This is not surprising, since the literature shows a wide variation in
Fig. 5. (a) Same as Fig. 4a, except for all eight days in March
and April of 1960. A second order polynomial least squares fit to the data is shown along with the conductance as a function of solar depression angle. (b) Same as Fig. 5a, except for morning twilights.
arc altitude with time during the night (Egeland and Omholt, 1966). The important aspect of these twilight plots is that the least squares fit curves in Figs. 5a and b show a decay in al-titude in the evening between 12 and 18 deg solar depression angle, and little or no change between the 18 to 13 deg solar depression angles in the morning twilight.
4 Discussion
4.1 Altitude with ionospheric conductance
It is clear from the observations presented in Sect. 3 that the altitude of discrete auroral arcs and, by inference, the energy of the auroral primary electron stream decays in the evening and while remaining constant in the morning; possibly rising around nautical twilight. This behaviour is similar to that of the electron density in the F region of the ionosphere. The conductance of the ionosphere is a measure of the total elec-tron and ion density. The Pedersen conductivity occurs at higher altitudes where ion-neutral collisions are negligible, while the Hall conductivity peaks at a lower altitude where
ion-neutral collisions occur. The conductance is the height-integrated conductivity. The Pedersen and Hall photocon-ductances are plotted in Figs. 5a and b for comparison with the change in discrete arc altitude with twilight solar depres-sion angle. The Pedersen conductance best follows the pat-tern of arc altitude, which is not surprising, since the Hall conductivity peaks in the E region which almost disappears by local evening civil twilight (6◦solar depression angle).
There are statistical studies that support this result. In the first of these, (Newell et al., 1996) found the occurrence fre-quency of energetic electron events in the dusk to midnight sector to occur 3 times more often for solar zenith angles
>110◦than for solar zenith angles <85◦. They concluded that the acceleration mechanism for discrete auroral arcs is dependent on the ionospheric conductivity. Subsequent sta-tistical studies using independent data sets have supported this result (Newell et al., 2001). The study of auroral arc altitude change in the twilight period reported here is the first observation of the transition of the mean electron energy from day to night. As such, it supports the contention that the ionospheric conductance is important to the operation of magnetospheric acceleration mechanisms.
Our measurements in the transition region between day and night suggest that electron acceleration is proportional to the ionospheric conductance. This linear dependence on ionosphereric conductance may explain the range of occur-rence frequencies of “energetic electron events” found sta-tistically in other regions of the auroral oval (Newell et al., 1996). There are obviously other effects on auroral arc al-titude, as indicated by the wide scatter in the data. For example, we must account for the observation of low alti-tude discrete arcs in twilight by admitting that the magne-tosphere/ionosphere is a coupled system and that there are times when the magnetospheric electron acceleration mech-anism is able to function at full power, even into a sunlit, con-ducting atmosphere. However, the most significant effect on the average auroral arc altitude (and by inference the electron energy (Newell et al., 1996), geomagnetic effects (Lyatsky et al., 2001), and auroral brightness (Shue et al., 2001)) appears to be the initial ionospheric conductance. It has been found adequate for and consistent with the equinoctial preference for auroral activity as well Cliver et al., 2002; Liou et al., 2001; Lyatsky et al., 2001)
The purpose of this exercise has been to show that what-ever the magnetospheric auroral electron acceleration mech-anism is, it appears to be affected by the state of the iono-sphere, in particular the Pedersen conductance. If this is true, some limitations are imposed on the possible acceler-ation mechanism. If the mechanism were entirely an electro-static potential drop, variations in the Pedersen conductance would have little effect (Ronnmark and Hamrin, 2000). We may conclude that the observations presented here support at least a combination of electrostatic potential and plasma wave propagation (Bryant, 2002).
Fig. 6. Same as 5a except averaged data points every 1/2◦solar depression angle. In addition, the altitude of maximum energy de-position is shown as a function of monoenergetic primary electron energy (Rees, 1987).
4.2 Altitude with latitude
Studies of auroral altitude as a function of latitude have led to some conflicting results. In particular, the result by Boyd et al. (Boyd et al., 1971), using a statistically significant number of data points in a three-station triangulation study in Alaska, showed an increase of arc altitude with latitude. Boyd’s frequently quoted graph of these data is shown in Fig. 7. This dependence of altitude on latitude is not found in older data (Deehr, 1983), nor is it compatible with the results of space shuttle measurements by Jack and Hallinan (Jack and Hallinan, 1994) Unfortunately, the Boyd et al. data set disappeared with the demise of IBM punched cards, so it is no longer possible to separate the latitude and the altitude dependence using Boyd’s data.
The March/April 1960 data set that is the subject of this paper was preserved on graph paper and was read off to an electronic file. When all of the data points from the eight days are replotted as a function of latitude (Fig. 8), the lat-itude dependence found by Boyd et al. (1971) emerges. In addition, we have plotted the median values of all the 1960 data as dashed lines on Boyd et al.’s (1971) graph in Fig. 7. Boyd et al.’s (1971) data are more extensive in latitude be-cause a third station at Hershel Island was in use at that time. It is apparent that the 1960 data are consistent with those of Boyd et al. (1971).
When the measurements made only after 18◦sda and be-fore 12◦ sda in the morning are plotted as a function of latitude, the dependence of altitude on latitude disappears (Fig. 9). After noting that Jack and Hallinan (Jack and Hal-linan, 1994) were careful to exclude sunlit aurora, and that Boyd’s altitude variations (Fig. 7) may also be explained by
764 C. S. Deehr et al.: Discrete auroral arc altitude
Fig. 7. Distribution if the height of the peak emission of 5577 ˚A [OI] emission as a function of dipole latitude for four 3-h time periods
shown as 150◦WMT (Boyd et al., 1971). Local magnetic midnight is approximately 01:15 150◦WMT. The median point of the distribution
in each latitude interval is shown by a circle. The dashed lines are median data from the complete 1960 data set, for comparison.
Fig. 8. Distribution if the height of the peak emission of 5577 ˚A [OI] emission as a function of dipole latitude for all of the 1960 ob-servations shown in Fig. 5a. The line is a second order polynomial least squares fit and the diamonds are median values.
twilight enhancement, we conclude that there is little or no dependence of discrete auroral arc altitude on either latitude or time, but instead on ionospheric conductance.
4.3 Altitude with solar activity
There have been a number of attempts to show some rela-tionship between the altitude of the aurora and solar activity (Deehr, 1983; Egeland and Omholt, 1966). The main statisti-cal correlation with sunspots has to do with the height of the various types of auroral forms [Egeland and Omholt, 1966]. The ionospheric conductance changes markedly over the so-lar cycle. This change undoubtedly leads to the tall rays and Type-a arcs prevalent in solar maximum aurorae. Although the processes leading to these phenomena have not yet been
Fig. 9. Distribution of the height of the peak emission of 5577 ˚A [OI] emission as a function of dipole latitude for only the nighttime
data (solar depression angle >18◦from the 1960 observations. The
line is a second order polynomial least squares fit and the diamonds are median values.
explained, they are probably not magnetospheric or solar, but ionospheric in origin.
5 Conclusions
1. The average altitude of discrete auroral arcs is observed to fall slowly from over 150 km to 100 km between 12◦ sda and 18◦sda in the evening twilight. It rises from 100 km sometime after 12◦sda in the morning. 2. Because the altitude of the discrete aurora is inversely
proportional to the energy of the auroral primary elec-trons, it follows that the magnetospheric acceleration
mechanism is inversely dependent on the local F re-gion electron density, or more specifically, the Peder-sen conductance. We presume that there is no similar time variation associated with the magnetospheric ac-celeration region (4000–8000 km) because the sun nei-ther rises nor sets nei-there.
3. One of the ramifications of the observations of the vari-ation of arc altitude in the transition region between day and night is that the magnetospheric acceleration mechanism is in some way proportional to the initial ionospheric conductance. Thus, it occurs weakly in sit-uations of intermediate values of ionospheric conduc-tance, such as in the summer hemisphere or the dayside aurora.
4. There is a scatter in the arc altitude data that is larger than the observational error of one pressure scale height. It is consistent with the occasional observation of low altitude arcs in regions of high photoconductance. This indicates that the magnetospheric acceleration mech-anism is part of a coupled magnetosphere/ionosphere system.
5. One of the most extensive studies of the altitude of nighttime discrete auroral arcs with geomagnetic lati-tude (Boyd et al., 1971) showed an increase in altilati-tude with latitude. A similar analysis of the 1960 data shows that (Boyd et al., 1971) latitude effect is due to the en-hancement of altitude in the twilight, prevalent at higher latitudes.
6. The most significant influence on the average altitude of discrete auroral arcs appears to be the initial iono-spheric conductance. This implies that the magneto-spheric electron acceleration mechanism has a signifi-cant plasma wave component.
Acknowledgements. The authors gratefully acknowledge the con-tribution of H. Tryon to the plotting and analysis of the original ob-servational data. Reading and replotting of the data was done by C. Weatherby, C. S. Deehr, M. H. Rees, A. E. Belon, and G. J. Romick, thank their wives for patience and forbearance in tending the home fires during the many winter nights of observations, and in all of the intervening 40 years it took to get it right. As co-authors, thesis advisors, or reviewers, C. S. Deehr, M. H. Rees, A. E. Belon, and G. J. Romick, extend an apology to J. S. Boyd, for not suggesting that he include in his thesis and resulting publication, the twilight enhancement that they had discovered 10 years earlier.
This research was supported by grants 8754, 15725, GP-947 and GP-5540 from the Atmospheric Sciences Section of the Na-tional Science Foundation to the Geophysical Institute of the Uni-versity of Alaska.
Topical Editor in chief thanks P. Newell and another referee for their help in evaluating this paper.
References
Belon, A. E. H. and Romick, G.: The Influence of Sunlight on the Height of the Aurora, in American Meteorological Society, 1962.
Belon, A. E. H., Romick, G., and Rees, M. H.: The energy spectrum of primary auroral electrons determined from auroral luminosity profiles, Planet. Space Sci., 14, 597–615, 1966.
Belon, A. E. H., Romick, G. J., and Stringer, W. J.: Proton precipita-tion during the auroral breakup, Planet. Space Sci., 22, 735–742, 1974.
Boyd, J. S.: Photometric measurements of the height, latitude and intensity of quiet auroral arcs, MS thesis, University of Alaska, Fairbanks, 1969.
Boyd, J. S., Belon, A. E. H., and Romick, G. J.: Latitude and time variation in precipitated electron energy inferred from measure-ments of auroral heights, J. Geophys. Res., 76, 7694–7700, 1971. Bryant, D. A.: The roles of static and dynamic electric fields in the auroral acceleration region, J. Geophys. Res., 107(A6), doi:10.1029/2001JA900162, 2002.
Cliver, E. W., Kamide, Y., and Ling, A. G.: The semiannual vari-ation of geomagnetic activity: phases and profiles for 130 years of ˚adata, J. Atmos. Solar-Terr. Phys., 64(1), 47–53, 2002. Deehr, C. and Lummerzheim, D.: Ground-based optical
observa-tions of hydrogen emission in the auroral substorm, J. Geophys. Res., 106(A1), 33–44, 2001.
Deehr, C. S.: A Relation Between the Altitude of the Aurora and Solar Activity, J. Geophys. Res., 88(A1), 395–397, 1983. Deehr, C. S., Sivjee, G. G., Egeland, A., Henriksen, K.,
Sand-holt, P. E., Smith, R. W., Sweeney, P., Duncan, C., and Gilmer, J.: Ground-based observations of F-Region aurora associated with the magnetospheric cusp, J. Geophys. Res., 85, 2185–2182, 1980.
Egeland, A. and Omholt, A.: Carl Størmer’s height measurements of aurora, Geofysiske Publikasjoner, 26(6), 1–30, 1966. Evans, D. S.: The observations of a near monoenergetic flux of
auroral electrons, J. Geophys. Res., 73, 2315–2323, 1968. Fuller, V. R.: Auroral heights from central Alaska, Terr. Mag.
At-mos. Elec., 38, 207, 1933.
Jack, T. M. and Hallinan, T. J.: Measurement of auroral rays from the space shuttle, J. Geophys. Res., 99(A5), 8865–8872, 1994. Liou, K., Newell, P. T., and Meng, C.-I.: Seasonal effects on
au-roral particle acceleration and precipitation, J. Geophys. Res., 106(A4), 5531–5542, 2001.
Lummerzheim, D., Rees, M. H., and Romick, G.: The application of spectroscopic studies of the aurora to thermospheric neutral composition, Planet. Space Sci., 38(1), 67–78, 1990.
Lyatsky, W., Newell, P. T., and Hamza, A.: Solar Illumination as Cause of the Equinoctial Preference for Geomagnetic Activity, Geophy. Res. Lett., 28(12), 2353–2356, 2001.
Newell, P. T., Greenwald, R. A., and Ruohoniemi, J.M.: The role of the ionosphere in aurora and space weather, Rev. Geophys., 39(2), 137–149, 2001.
Newell, P. T., Lyons, K. M., and Meng, C.-I.: A large survey of electron acceleration events, J. Geophys. Res., 101(A2), 2599– 2614, 1996.
Newell, P. T., Meng, C.-I. and Lyons, K. M.: Suppression of discrete aurora by sunlight, Nature, 381, 766, 1996.
Omholt, A.: The Optical Aurora, Springer-Verlag, New York, 1971. Rees, M. H.: A Method for Determing the Height and Geograph-ical Position of an Auroral Arc from One Observing Station, J. Geophys. Res., 68(1), 175–183, 1963.
Rees, M. H.: Modelling of the Heating and Ionizing of the Polar Thermosphere by Magneospheric Electron and Ion Precipitation, Physica Scripta, T18, 249–255, 1987.
Romick, G. and Belon, A. E. H.: Geophysical Institute Report UAG-R149, in Geophysical Institute Reports, University of
766 C. S. Deehr et al.: Discrete auroral arc altitude
Alaska, Fairbanks, Alaska, 1964.
Romick, G. and Belon, A. E. H.: The spatial variation of auro-ral luminosity-I: the behavior of synthetic model auroras, Planet. Space Sci., 15, 475–493, 1967a.
Romick, G. and Belon, A. E. H.: The spatial variation of auro-ral luminosity-II: determination of volume emission rate profiles, Planet. Space Sci., 15, 1695–1716, 1967b.
Romick, G. J.: The detection and study of the visible spectrum of the aurora and airglow, in Methods for Atmospheric Radiometry, 63–70, Soc. of Photo-Optical Inst. Eng., 1976.
Ronnmark, K. and Hamrin, M.: Auroral Electron acceleration by Alfven waves and electrostatic fields, J. Geophys. Res., 105(A11), 25 333–25 344, 2000.
Shue, J.-H., Newell, P. T., Liou, K., and Meng C.-I.: The quan-titative relationship between auroral brightness and solar EUV Pedersen conductance, J. Geophys. Res., 106(A4), 5883–5894, 2001.
Sigernes, F., Moen, J., Lorentzen, D. A., Deehr, C. S., Smith, R. W., Oieroset, M. O., Lybekk, B., and Holtet, J.: SCIFER: Height measurements of the midmorning aurora, Geophys. Res. Lett., 23(14), 1889–1892, 1996.
Størmer, C.: Frequency of 12 330 measured heights of aurora, Terr. Mag. Atmos. Elec., 51(4), 501, 1946.
Stringer, W. J. and Belon, A. E. H.: The Statistical auroral zone dur-ing IQSY and its relationship to magnetic activity, J. Geophys. Res., 72, 245–250, 1967.
![Figure 4 shows the altitude of the maximum 5577 ˚ A [OI]](https://thumb-eu.123doks.com/thumbv2/123doknet/14793736.602632/4.892.96.403.91.538/figure-shows-altitude-maximum-oi.webp)
![Fig. 8. Distribution if the height of the peak emission of 5577 ˚ A [OI] emission as a function of dipole latitude for all of the 1960 ob-servations shown in Fig](https://thumb-eu.123doks.com/thumbv2/123doknet/14793736.602632/7.892.466.819.470.731/distribution-height-emission-emission-function-dipole-latitude-servations.webp)
