HAL Id: hal-01447953
https://hal.archives-ouvertes.fr/hal-01447953
Submitted on 2 Feb 2017
HAL is a multi-disciplinary open access
archive for the deposit and dissemination of
sci-entific research documents, whether they are
pub-lished or not. The documents may come from
teaching and research institutions in France or
abroad, or from public or private research centers.
L’archive ouverte pluridisciplinaire HAL, est
destinée au dépôt et à la diffusion de documents
scientifiques de niveau recherche, publiés ou non,
émanant des établissements d’enseignement et de
recherche français ou étrangers, des laboratoires
publics ou privés.
Nondestructive measurement of the roughness of the
inner surface of hollow core-photonic bandgap fibers
Xavier Buet, Coralie Brun, Jérôme Gâteau, Bruno Bresson, Seyed Reza
Sandoghchi, Eric Numkam Fokoua, Marco Petrovich, Francesco Poletti, David
Richardson, Damien Vandembroucq, et al.
To cite this version:
Xavier Buet, Coralie Brun, Jérôme Gâteau, Bruno Bresson, Seyed Reza Sandoghchi, et al..
Non-destructive measurement of the roughness of the inner surface of hollow core-photonic bandgap
fibers. Optics Letters, Optical Society of America - OSA Publishing, 2016, 41 (21), pp.5086-5089.
�10.1364/OL.41.005086�. �hal-01447953�
Nondestructive Measurement of the Roughness of the
Inner Surface of Hollow Core-Photonic Bandgap Fibers
X
AVIER
B
UET
1,2,3,
C
ORALIE
B
RUN
1,2,
J
ÉRÔME
G
ÂTEAU
3,
B
RUNO
B
RESSON
1,
S
EYED
R
EZA
S
ANDOGHCHI
4,
E
RIC
N
UMKAM
F
OKOUA
4,
M
ARCO
P
ETROVICH
4,
F
RANCESCO
P
OLETTI
4,
D
AVID
R
ICHARDSON
4,
D
AMIEN
V
ANDEMBROUCQ
1,
G
ILLES
T
ESSIER
2,3,*1
Laboratoire PMMH, ESPCI, CNRS UMR 7636, Univ. Paris 6 UPMC, Univ. Paris 7 Diderot, 10 rue Vauquelin 75231 Paris cedex 05, France
2 Institut Langevin, ESPCI, CNRS UMR 7587, 1 rue Jussieu, 75238 Paris cedex 05, France 3
Neurophotonics Laboratory, CNRS UMR 8250, Univ. Paris Descartes, 45 Rue des Saints Pères, Paris, France
4
Optoelectronics Research Centre, Univ. Southampton, Highfield, Southampton, SO17 1BJ, UK *Corresponding author: gilles.tessier@parisdescartes.fr
Received XX Month XXXX; revised XX Month, XXXX; accepted XX Month XXXX; posted XX Month XXXX (Doc. ID XXXXX); published XX Month XXXX
We present optical and atomic force microscopy measurements of the roughness of the core wall surface within a Hollow Core Photonic Bandgap Fiber (HC-PBGF) over the [3×10⁻² µm-1 – 30µm-1] spatial frequency range.
A recently developed immersion optical profilometry technique with picometer-scale sensitivity was used to measure the roughness of air-glass surfaces inside the fiber at unprecedentedly low spatial frequencies, which are known to have the highest impact on HC-PBGF scattering loss and thus determine their loss limit. Optical access to the inner surface of the core was obtained by selective filling of the cladding holes with index matching liquid using techniques borrowed from micro-fluidics. Both measurement techniques reveal ultra-low roughness levels exhibiting a 1/f spectral power density dependency characteristic of frozen surface capillary waves over a broad spatial frequency range. However, a deviation from this behavior at low spatial frequencies was observed for the first time. © 2016 Optical Society of America
OCIS codes: (120.6660) Surface measurements, roughness; (120.4290)
Nondestructive testing, (060.5295) Photonic crystal fibers, (240.5770) Roughness
http://dx.doi.org/10.1364/OL.99.099999
Hollow core-photonic bandgap fibers (HC-PBGFs) represent a potential candidate for optical communication applications that require ultra-low latency. HC-PBGFs are essentially formed by a periodic cladding made of air holes in a silica glass matrix which confine light in a central air core. Guidance in an air core allows for a much lower nonlinearity and latency compared to classical solid-core fibers [ 1, 2]. Furthermore, HC-PBGFs offer reduced losses by
Rayleigh scattering, impurities, or multiphonon absorption relative to solid fibers. However, the lowest loss values reported on HC-PBGFs so far are still one order of magnitude higher than those of solid single mode fibers [3]. Losses in HC-PBGFs are fundamentally limited by scattering at the numerous and intrinsically “rough” air/glass interfaces present in these structures [ 3]. Scattering due to the surface roughness component at low spatial frequencies (i.e. below 1µm-1) is understood to provide the dominant contribution
to the overall loss [ 4]. The study of roughness in this frequency range requires precise surface measurements over distance scales of several hundreds of micrometers, which is not possible with most Atomic Force Microscopes (AFMs).
The structure of glasses is amorphous, mostly owing to their past liquid state: to a first approximation, glass can be viewed as a liquid abruptly frozen at the glass transition temperature TG.
Surface capillary waves (SCWs) that are thermally excited in the liquid state are suddenly frozen during the fiber drawing process [ 3, 5, 6]: the glass surface structure therefore reflects the thermal fluctuations of the liquid surface at TG.. These SCWs result from the
interplay of two opposing effect: thermal noise (which tends to destabilize the surface), and interface tension (which tends to dampen the oscillations and flatten the surface). A simple estimate of the variance of the height fluctuations, δh², is given by the ratio between the thermal noise energy at glass transition kBTG, and the
interface tension γ. This fundamental thermodynamic process imposes the ultimate limit to roughness in glasses, and thus to the loss of HC-PBGFs. The resulting roughness is extremely low: for standard values of TG and γ of amorphous silica, the RMS
roughness amounts toσ ≈ k TB G/ γ ≈0.4nm. However, this value provides only a partial measure of the superposition of roughness contributions which extend over a wide range of length scales, ranging from the nanometer to the millimeter regime [ 6], as shown below.
In this work, we demonstrate a method for the selective filling of HC-PBGFs which allows the focusing of an optical profilometer inside the hollow core to measure for the first time the surface roughness at frequencies below 1 µm-1. The measured roughness
levels are compatible with AFM measurements and SCW-based roughness modelling over most of the spectrum but they deviate considerably below a certain cutoff frequency, providing new insight on the loss limits in these complex fiber waveguides.
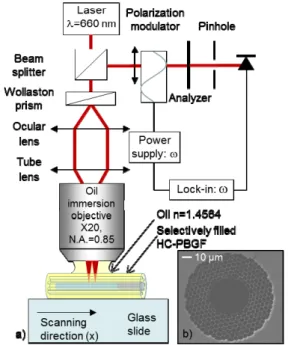
Fig. 1: a) Polarization-modulated differential scanning interferometer. b) Scanning Electronic Microscopy image of a section of the HC-PBGF showing its inner structure.
Fig.1a shows the polarization-modulated differential profilometer which we used to measure the glass roughness on the inner surface of the core of HC-PBGFs (Fig.1b). The measurements were performed over length scales of hundreds of micrometers with a picometer-range vertical precision. Immersion oil matching the PBGFs’ refractive index was used to eliminate unwanted reflections. In this system inspired by Gleyzes and Boccara [ 7], a laser beam polarized at 45° relative to the axes of a Wollaston prism is divided in two beams of identical intensity carrying orthogonal polarizations. The beams corresponding to each arm are focused into two laser spots separated by a distance d ≈ 3 µm on the surface of the sample. After reflection on the surface of interest, these beams are recombined in the Wollaston prism, following precisely their previous path if the prism is in the back focal plane of the objective. The beamsplitter then deflects a portion of the beam to a photoelastic polarization modulator working at 50 kHz. Both polarizations are projected on an analyzer set at 45° relative to both of them to allow interference, and the beam is collected by a photodiode. After lock-in detection, the interference yields a signal proportional to the optical path difference between the two beams, and therefore to the height difference D(x)=h(x+d/2)-h(x-d/2) between them (where x is the horizontal coordinate along the surface and h(x) the height profile). D(x) is measured while continuously moving the sample along the x direction (with a PI M 126.2S1 translation stage), and
can be equated in a first approximation to the spatial derivative of the profile.
The ultra-low noise levels obtained with this instrument, around six to ten picometers [ 8], make it especially suited to the characterization of ultrasmooth glass surfaces with typical RMS roughness in the sub-nanometer range. The accuracy of the instrument was validated by cross-comparison with AFM measurements on reference samples [ 8].
Fig. 2: Selective filling process: (a) a portion of HC-PBGF fiber is (b) dipped in a UV-curable polymer (arrow). Due to its viscosity, the polymer penetrates faster in the central hollow core than in the smaller peripheral capillaries. After UV curing, the fiber is cleaved along the red dotted line to obtain (c) a PBGF with a polymer plug obstructing the core. (d) The PBGF is immersed in index-matching oil (yellow), which penetrates the whole structure except the air-filled core (blue) which becomes the only optically visible feature.
However, accessing the inner wall of a micrometer-sized HC-PBGF with an AFM probe is extremely difficult. Several techniques have been developed in order to expose portions of the inner core and allow AFM measurements. Crushing the fiber and identifying a portion of the walls of the central hole among the fragments [ 3] or bending the fiber and polishing until a sufficient portion of the inner core is exposed [ 9] are efficient methods, but contamination of the surface by glass fragments, dust, or the polishing solution are difficult to avoid and are thus are very likely to affect the measurement results. More recently, an efficient method using thermal expansion has been proposed in order to cleave fibers along their axis [10] and analyze tubes with AFM or electron microscopy. We have found that an overestimation of the intrinsic roughness due to surface contamination is highly likely if a complex cleaning procedure is not followed scrupulously. Moreover, access to the surface over millimeter-range distances remains extremely difficult.
As previously demonstrated [ 8], oil immersion eliminates unwanted reflections off the outer surface of glass objects. In this paper, to study the inner hollow core of PBGFs without opening the fiber, we chose to fill the small tubes defining the cladding with oil while leaving the central core filled with air. To achieve this, we developed a technique similar to [11], based on selective filling of the PBGF (Fig.2). Exploiting capillary action, the core and cladding were partially filled with a viscous photopolymer which propagates faster and (in a given short time) further in the core than in the smaller cladding holes (Fig. 2.b). The traveling front of the infusing polymer was cured and fixed by UV photo-polymerization and the fiber was cleaved under a microscope,
precisely in the region (typically a few millimeters) where the polymer has only penetrated the core. The fiber portion which had a core obstructed by the polymer on one side (Fig. 2.c) was then immersed in index-matching oil. The obstruction only allowed the oil to penetrate into the cladding holes (Fig. 2.d). Under an oil-immersion objective, and with an oil index that matches that of the glass, the only remaining optically visible feature was therefore the boundary of the central air-filled core. The two beams of the optical profilometer (Fig.1) were then focused on this surface and the fiber was scanned longitudinally to measure the inner roughness of the core wall. This technique allows scans over several millimeters with picometer vertical precision inside pristine, un-contaminated fibers. Therefore, it is extremely valuable in the accurate characterization of the roughness of HC-PBGFs. In particular, as shown below, this gives access to the roughness at low spatial frequencies, i.e. below 1 µm-1, which have
substantial impact on the losses of these fibers.
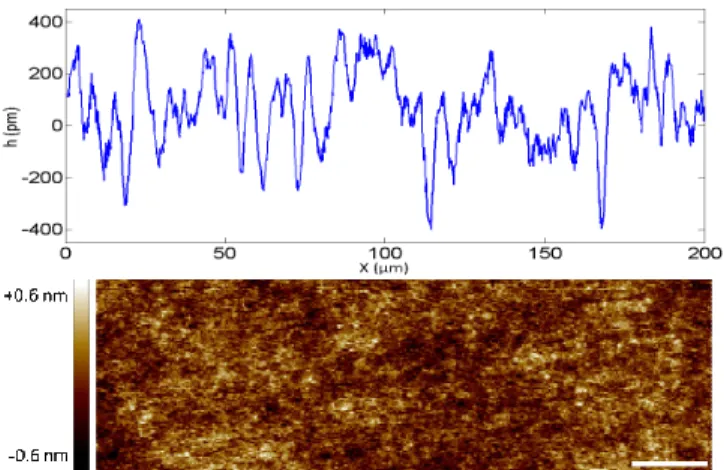
Fig. 3 : (Top) Differential profile of the hollow core wall of a selectively filled PBGF measured by optical profilometry over 200 µm. (Bottom) 10 x 2.5 µm AFM image (scale bar : 1 µm) of the inner surface of the same fiber. In both cases, the height fluctuations are of the order of a few hundreds of pm.
The recorded data was processed to extract information on the roughness. In Fig.3 (top), we show a differential profile measured on the inner surface of a PBGF over 200 µm (extracted from a 2 mm long scan). The extremely low height fluctuations (a few hundred pm) are compatible with a frozen capillary waves scenario [3,5,6]. To be more quantitative, we characterize the Fourier spectrum of the height profile, for which a 1/f profile is expected (where f is the spatial frequency) in a frozen capillary wave scenario. Let us call hSCW the height fluctuations induced by
surface capillary waves, the Power Spectral Density (PSD) expected over 1D profiles can be expressed as [3, 5, 6]:
( ) ² 4 B G SCW k T h f f πγ = (1)
with kB the Boltzmann constant, TG the glass transition
temperature, γ the surface tension, and a Fourier transform defined as:
( )
( ) 2i fx g f +∞g x e π dx −∞ =
(2)The most straightforward way to obtain the roughness of the sample would be to integrate the measured differential signal to obtain the profile of the surface, and then compute its Fourier spectrum. However, as discussed in [ 8], the measured profile is not the exact derivative of the height of the surface due to the finite distance d between the probe beams and the size of the spots. For this reason, the PSD of the height signal ( ) ²h f was obtained by dividing, in the Fourier space, the PSD of the bare differential signal
( ) ²
D f by the experimental response function of the measurement system, R f( ) ². The result can be quantitatively compared with the theoretical expectation hSCW( ) ²f given above in Eq. (1) for surface capillary waves. Note here that, because of its differential nature, the experimental set-up is blind to the spatial frequency fd =1/d and its multiples, associated with
the distance d separating the two beams. This can be understood easily by considering that the two beams would always be at the same height when scanned on a hypothetical sinusoidal surface with a period d, yielding an artificially null differential signal. This blind frequency translates as a zero in the response function,
( )
d 0R f = , and therefore a high noise level at frequencies close to fd. The lowest accessible spatial frequency, currently a few 10-3
µm-1, is essentially set by the available measurement length.
Currently, the translation stage is limited to ~2 mm due to practical difficulties in maintaining a correct alignment and focusing over longer scanning distances. Nonetheless, this already represents an improvement by 2-3 orders of magnitude in comparison to AFM, and could probably be further improved with better mechanical alignment since the selective filling process is able to produce samples measurable over a few centimeters.
The PBGF on which we measured the roughness was fabricated using the conventional two-step stack and draw process and is shown Fig.1b). In a first step, meter-long cylindrical fused silica capillaries were stacked in a triangular lattice with 37 capillaries omitted to form the core defect. The assembly was then drawn into meter long canes of a few mm in diameter. In a second step, the cane was inserted into a sleeve jacket and the assembly drawn down to fiber dimensions. The application of positive pressure resulted in a fiber with a large air filling fraction of ~90% and an average cladding pitch Λ=4.8 μm. The fiber core measured on average 36μm in diameter. The fiber loss measured by cutback had a minimum value of 9.3 dB/km at 1.55 μm.
Using the selective filling procedure described above on this fiber, we performed optical measurements on the inner surface of its core. For validation purposes, AFM measurements were also carried out on a portion of the same fiber. Under a microscope, the fiber was mechanically cleaved at low angles with respect to the fiber axis in order to expose portions of the core. Although this procedure is much simpler than the one described in [10], it is relatively inefficient and therefore time-consuming. The measurements were carried out using a Bruker Dimension Icon AFM, and one of the images (10x2.5 µm) is presented in Fig. 3
In Fig. 4, we present power spectral densities (PSDs) obtained through the data processing presented above for optical profilometry, and with a procedure described in [6] for the AFM measurements. The optical profilometry PSD results from the average of 12 PSDs obtained on the same fiber from independent differential profiles acquired over typically 1-2 mm, in order to have enough statistics and to reduce the noise. We note that in the
range [5×10⁻² µm-1 – 2×10⁻¹ µm-1], the PSDs are reasonably
consistent with the 1/f behavior expected from a capillary wave model. This behavior had already been measured in the range [0.3 µm-1 – 30 µm-1] by AFM measurements [3] but, to the best of our
knowledge, the lower frequency regime presented here, which has the highest impact on PBGF losses, had not yet been measured. The values of TG/γ which best describe these PSDs is of the order
of 2500, and is lower than the classical TG/γ value of 5000 given for
amorphous silica. This effect, which could be attributed to the strain applied to the fibers during the drawing process, remains to be investigated in more detail.
As discussed above, the optical profilometry PSD near 0.3 µm-1 is
affected by the proximity of the blind frequency fd and was
discarded. While a spatial frequency down to 10-3 µm-1 would in
principle be accessible with 2 mm long scans, we chose to truncate the data below 6.10-3 due to its limited statistical significance and
to the fact that low frequencies are affected by the limited length of the scan and possibly by mechanical noise in the motorized translation stage.
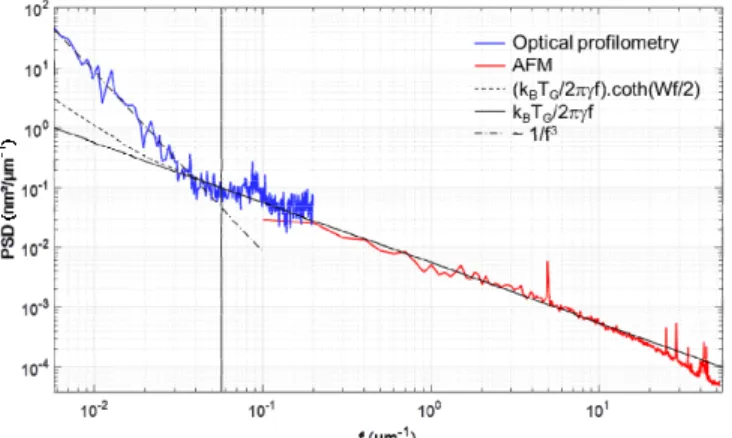
Fig. 4: Roughness measurements of the inner wall of a PBGF by AFM (red curve) and optical profilometry (blue). The optical profilometry PSD is calculated by averaging 12 independent measurements, and is valid up to an instrumental cutoff frequency of 2.10-1 µm-1. The continuous black line corresponds to the capillary waves model described by equation (1), plotted for TG/γ=2500. The dashed lines correspond to Equ. (3) and 1/f3. The vertical line indicates the spatial frequency 2π/W of the inflection point of Equ. (3)
Interestingly, in the measurement presented here and in others we have conducted on similar samples, we consistently observe an increase in the slope of the PSD function for frequencies below 5.10-2 µm-1. A similar change had been predicted (but never
observed before) due to the “cylindrical” nature of the core which quantifies the azimuthal component of the roughness spatial frequency, resulting in a PSD of the form [3]:
( )
2(
)
coth 4 B G SCW k T h f Wf f π πγ = (3)where W is the perimeter of the core boundary. This curve is also shown in Fig.4. Note that the 1/f scaling of the one-dimensional PSD along the fibre axis results from a re-summation over the azimuthal modes along the perimeter. The lack of such modes at low spatial frequency due to the periodic boundary condition associated with the cylindrical geometry induces a crossover
toward the 1/f² scaling of the longitudinal modes. While this theory predicts quite accurately the inflection frequency at which the slope changes, 2π/W (W=110μm), the measured slope is actually much steeper than the expected asymptotical 1/f2
behavior of the coth function. As shown in the figure a better fit is achieved assuming a 1/f3 dependency. Based on our current
understanding, this appears to be a true feature of the surface, since measurements on larger tubes did not deviate from a classical 1/f behavior [8].While the origin of this behavior remains unclear, it suggests that, while the roughness at high frequencies can be well explained by a SCW model for planar structures, more work is required to fully interpret the deviations observed at lower frequencies.
To summarize, we have described a method for the selective filling of the cladding of HC-PBGFs which enables the direct optical interferometric characterization of their inner core roughness with picometer-scale sensitivity without the need to physically open (i.e. crush) the fibers. This measurement technique is therefore remarkably immune to sample contamination issues, noises, and vibrations. Besides, it allows reaching a previously inaccessible range of spatial frequencies, [6.10-3, 2.10-1] µm-1. Using this method
we have characterized the inner core surface of a 37cell PBGF. Over a wide spectral range the results have shown good agreement with separate AFM measurements obtained, in contrast, by crushing the fiber microstructure. However, an inflection point in the PSD at short frequencies has been directly observed for the first time. Whilst more work is required to lower the minimum frequency range measurable with confidence with this method, we believe that the ability to characterize nondestructively the roughness of fabricated HC-PBGFs over relevant spatial scales shown here will prove most valuable in attempts to optimize their loss.
Funding sources. This work was supported by the EU 7th Framework Programme under grant agreement 228033 (MODE-GAP). X.B. acknowledges the support of Programme DIM OxyMORE, Ile de France.
References
1. F. Poletti, M. N. Petrovich, and D. J. Richardson, Nanophotonics 2, 315– 340 (2013).
2. V. A. J. M. Sleiffer, J. Yongmin, N. K. Baddela, J. Surof, M. Kuschnerov, V. Veljanowski, J. R. Hayes, N. V. Wheeler, E. N. Fokoua, J. P. Wooler, D. R. Gray, N. H. Wong, F. R. Parmigiani, S. U. Alam, M. Petrovich, F. Poletti, D. J. Richardson, H. D. Waardt, J. Lightwave Tech. 32, 854 (2014). 3. P. J. Roberts, F. Couny, H. Sabert, B. J. Mangan, D. P. Williams, L. Farr, M.
W. Mason, A. Tomlinson, T. A. Birks, J. C. Knight, and P. S. Russell, Opt. Express 13, 237 (2005).
4. E. N. Fokoua, F. Poletti, D. J. Richardson, Opt. Express 20, 20980 (2012). 5. J. Jäckle and K. Kawazaki, J. Phys. Cond. Matt. 7, 4351–4358 (1995). 6. T. Sarlat, A. Lelarge, E. Søndergård, and D. Vandembroucq, Eur. Phys. J.
B 54, 121–127 (2006).
7. P. Gleyzes and A. C. Boccara, J. Opt. 25, 207–224 (1994).
8. C. Brun, X. Buet, B. Bresson, M.S. Capelle, M. Ciccotti, A. Ghomari, P. Lecomte, J.P. Roger, M.N. Petrovitch, F. Poletti, D.J. Richardson, D. Vandembroucq, G. Tessier, Optics Express 22, 24, 29554, (2014). 9. M. C. Phan-Huy, J. M. Moison, J. A. Levenson, S. Richard, G. Mélin, M.
Douay, Y. Quinquempois, J. of Lightwave Technology, 27:1597 (2009). 10. O.W.B. Benningshof, D.H. Nguyen, M.R. Dadema, A.F. Beker, T.H.
Oosterkamp, R. Jochemsen, Physica E 66, 33-39 (2015)
References with journal titles
1. F. Poletti, M. N. Petrovich, and D. J. Richardson, “Hollow-core photonic bandgap fibers: technology and applications”, Nanophotonics 2, 315– 340 (2013).
2. V. A. J. M. Sleiffer, J. Yongmin, N. K. Baddela, J. Surof, M. Kuschnerov, V. Veljanowski, J. R. Hayes, N. V. Wheeler, E. R. N. Fokoua, J. P. Wooler, D. R. Gray, N. H. L. Wong, F. R. Parmigiani, S. U. Alam, M. N. Petrovich, F. Poletti, D. J. Richardson, and H. D. Waardt, “High capacity mode-division multiplexed optical transmission in a novel 37-cell hollow-core photonic bandgap fiber”, J. Lightwave Tech. 32, 854 (2014).
3. P. J. Roberts, F. Couny, H. Sabert, B. J. Mangan, D. P. Williams, L. Farr, M. W. Mason, A. Tomlinson, T. A. Birks, J. C. Knight, and P. S. Russell, “Ultimate low loss of hollow-core photonic crystal fibres”, Opt. Express 13, 237 (2005).
4. E. N. Fokoua, F. Poletti, and D. J. Richardson, “Analysis of light scattering from surface roughness in hollow-core photonic bandgap fibers”, Opt. Express 20, 20980 (2012).
5. J. Jäckle and K. Kawazaki, “Intrinsic roughness of glass surfaces”, J. Phys. Cond. Matt. 7, 4351–4358 (1995).
6. T. Sarlat, A. Lelarge, E. Søndergård, and D. Vandembroucq, “Frozen capillary waves on glass surfaces: an AFM study”, Eur. Phys. J. B 54, 121–127 (2006).
7. P. Gleyzes and A. C. Boccara, “Interferometric polarization picometric profile .1. single detector approach”, J. Opt. 25, 207–224 (1994). 8. C. Brun, X. Buet, B. Bresson, M.S. Capelle, M. Ciccotti, A. Ghomari, P.
Lecomte, J.P. Roger, M.N. Petrovitch, F. Poletti, D.J. Richardson, D. Vandembroucq, G. Tessier, “Picometer-scale surface roughness measurements inside hollow glass fibres”, Optics Express 22, 24, 29554, (2014).
9. M. C. Phan-Huy, J. M. Moison, J. A. Levenson, S. Richard, G. Mélin, M. Douay, and Y. Quinquempois, “Surface roughness and light scattering in a small effective area microsctructured fibre”, J. of Lightwave
Technology, 27:1597 (2009).
10. O.W.B. Benningshof, D.H. Nguyen, M.R. Dadema, A.F. Beker, T.H. Oosterkamp, R. Jochemsen, “Characterization of the channel walls roughness in photonic crystal fibers”, Physica E 66, 33-39 (2015) 11. Y. Huang, Y. Xu, and A. Yariv, “Fabrication of functional microstructured
optical fibers through a selective-filling technique,” Appl. Phys. Lett. 85, 5182–5184 (2004)