HAL Id: hal-00295939
https://hal.archives-ouvertes.fr/hal-00295939
Submitted on 20 Jun 2006
HAL is a multi-disciplinary open access
archive for the deposit and dissemination of
sci-entific research documents, whether they are
pub-lished or not. The documents may come from
teaching and research institutions in France or
abroad, or from public or private research centers.
L’archive ouverte pluridisciplinaire HAL, est
destinée au dépôt et à la diffusion de documents
scientifiques de niveau recherche, publiés ou non,
émanant des établissements d’enseignement et de
recherche français ou étrangers, des laboratoires
publics ou privés.
J. Morland, B. Deuber, D. G. Feist, L. Martin, S. Nyeki, N. Kämpfer, C.
Mätzler, P. Jeannet, L. Vuilleumier
To cite this version:
J. Morland, B. Deuber, D. G. Feist, L. Martin, S. Nyeki, et al.. The STARTWAVE atmospheric water
database. Atmospheric Chemistry and Physics, European Geosciences Union, 2006, 6 (8),
pp.2039-2056. �hal-00295939�
www.atmos-chem-phys.net/6/2039/2006/ © Author(s) 2006. This work is licensed under a Creative Commons License.
Chemistry
and Physics
The STARTWAVE atmospheric water database
J. Morland1, B. Deuber1,*, D. G. Feist1, L. Martin1, S. Nyeki1,2, N. K¨ampfer1, C. M¨atzler1, P. Jeannet2, and L. Vuilleumier2
1Institute of Applied Physics, University of Bern, Sidlerstrasse 5, Bern 3012, Switzerland 2MeteoSwiss, Atmospheric Data Department, Les Invuardes, Payerne 1530, Switzerland *now at: BKW FMB Energie AG, Switzerland
Received: 13 July 2005 – Published in Atmos. Chem. Phys. Discuss.: 28 October 2005 Revised: 9 February 2006 – Accepted: 4 April 2006 – Published: 20 June 2006
Abstract. The STARTWAVE (STudies in Atmospheric
Ra-diative Transfer and Water Vapour Effects) project aims to investigate the role which water vapour plays in the cli-mate system, and in particular its interaction with radi-ation. Within this framework, an ongoing water vapour database project was set up which comprises integrated wa-ter vapour (IWV) measurements made over the last ten years by ground-based microwave radiometers, Global Position-ing System (GPS) receivers and sun photometers located throughout Switzerland at altitudes between 330 and 3584 m. At Bern (46.95◦N, 7.44◦E) tropospheric and stratospheric water vapour profiles are obtained on a regular basis and in-tegrated liquid water, which is important for cloud charac-terisation, is also measured. Additional stratospheric water vapour profiles are obtained by an airborne microwave ra-diometer which observes large parts of the northern hemi-sphere during yearly flight campaigns. The database allows us to validate the various water vapour measurement tech-niques. Comparisons between IWV measured by the Payerne radiosonde with that measured at Bern by two microwave radiometers, GPS and sun photometer showed instrument biases within ±0.5 mm. The bias in GPS relative to sun photometer over the 2001 to 2004 period was −0.8 mm at Payerne (46.81◦N, 6.94◦E, 490 m), which lies in the Swiss plains north of the Alps, and +0.6 mm at Davos (46.81◦N, 9.84◦E, 1598 m), which is located within the Alps in the eastern part of Switzerland. At Locarno (46.18◦N, 8.78◦E, 366 m), which is located on the south side of the Alps, the bias is +1.9 mm. The sun photometer at Locarno was found to have a bias of −2.2 mm (13% of the mean annual IWV) relative to the data from the closest radiosonde station at Mi-lano. This result led to a yearly rotation of the sun pho-tometer instruments between low and high altitude stations to improve the calibrations. In order to demonstrate the
ca-Correspondence to: J. Morland
pabilites of the database for studying water vapour varia-tions, we investigated a front which crossed Switzerland be-tween 18 November 2004 and 19 November 2004. During the frontal passage, the GPS and microwave radiometers at Bern and Payerne showed an increase in IWV of between 7 and 9 mm. The GPS IWV measurements were corrected to a standard height of 500 m, using an empirically derived expo-nential relationship between IWV and altitude. A qualitative comparison was made between plots of the IWV distribution measured by the GPS and the 6.2 µm water vapour channel on the Meteosat Second Generation (MSG) satellite. Both showed that the moist air moved in from a northerly direc-tion, although the MSG showed an increase in water vapour several hours before increases in IWV were detected by GPS or microwave radiometer. This is probably due to the fact that the satellite instrument is sensitive to an atmospheric layer at around 320 hPa, which makes a contribution of one percent or less to the IWV.
1 Introduction
Water vapour plays a crucial role in the earth’s radiation bal-ance, both directly through the absorption of solar radiation and emission of longwave radiation and indirectly through the formation of clouds. No projection of climate change is complete without considering the effects of future changes in water vapour. Because the maximum amount of water vapour which can be present in the atmosphere increases with in-creasing temperature (the Clausius-Clapeyron relationship), atmospheric water vapour is expected to increase in a warmer climate. This water vapour feedback could approximately double the warming expected due to greenhouse gases alone (IPCC, 2001). It is therefore essential to set up networks to monitor atmospheric water vapour.
Stratospheric water vapour contributes to radiation cool-ing by infrared emission. It is also the main source of the
Fig. 1. A map of Switzerland showing the locations of the AGNES GPS stations, the sun photometer (SPM) stations and the Payerne
radiosonde. The altitude in metres is given beneath the station name.
OH radical which is involved in many reactions, including stratospheric ozone depletion. Observations have shown that stratospheric water vapour has increased in recent years (see for example Oltmans et al., 2000). However, the processes leading to this increase are poorly understood and long-term monitoring is necessary.
Clouds constitute a major radiation feedback but at the same time there are many uncertainties about their role in climate and climate change. They have been identified by the Intergovernmental Panel on Climate Change (IPCC) as the single largest uncertainty in the estimates of climate sen-sitivity (IPCC, 2001). A comparison of model predicted in-tegrated liquid water (ILW) with measurements obtained by a network of ground-based microwave radiometers during CLIWA-NET (the Baltic sea experiment cloud liquid water network) showed that atmospheric models generally over-predict the amount of clouds containing liquid water as well as the frequency and duration of precipitation events (van Meijgaard and Crewell, 2005). In an observational study, Senegupta et al. (2003) demonstrated that surface radiation is highly sensitive to variations in liquid water path (equiva-lent to ILW). In this context, there is a clear need for regular liquid water measurements.
Until the recent development of remote sensing tech-niques, in-situ measurements by radiosondes were the only means of determining atmospheric water vapour. However, the radiosonde network was designed for meteorological ap-plications rather than climate monitoring and changes in
re-porting practices or sensor types can cause abrupt changes in the observational record (Ross and Elliott, 2001). Satellites can provide remotely sensed estimates of water vapour for a large part of the globe but as monitoring tools, they suf-fer from the fact that individual instruments have a relatively short lifetime and that instrument changeovers can cause steps in the data series (e.g. Picon et al., 2003). Satellite-borne microwave radiometers can generally only measure water vapour over the sea surface as the land background emission is too high and too variable.
In recent years, ground-based remote sensing networks have been developed which are capable of making water vapour observations. AERONET is a worldwide network of 100 sun photometer stations which was set up for aerosol monitoring (Holben et al., 1998) but which can also be used to measure integrated water vapour (IWV) (Halthore et al., 1997; Bokoye et al., 2003). The Global Positioning System (GPS) has recently emerged as a robust, all-weather method for measuring water vapour. Water vapour has been moni-tored by the Swedish GPS network since 1993 (Gradinarsky et al., 2002), making it one of the longest running GPS net-works.
In order to detect instrument problems or improve mea-surement methods, it is very useful to be able to compare var-ious water vapour measurement techniques. Many case stud-ies compare IWV observations using different techniques (e.g. Basili et al., 2001; Bokoye et al., 2003) but there are few locations where IWV is routinely monitored using
several types of instrument. One such site is the Southern Great Plains site in Oklahoma, run by the U.S. Department of Energy’s Atmospheric Radiation Monitoring (ARM) pro-gram, where routine measurements are made by microwave radiometer, GPS, radiosonde and lidar (Revercomb et al., 2003).
Remote sensing of water vapour and liquid water has been a research topic at the Institute of Applied Physics (IAP) in Bern for many years. Instruments have been developed for operation from the ground, from aircraft and from space. The earliest water vapour measurements in the middle at-mosphere were made from aircraft in the mid 1980s (Peter et al., 1988) and have since then been continued with the AMSOS (Airborne Microwave Stratospheric Observing Sys-tem) instrument (Peter, 1998; Feist et al., 2003; Vasic, 2005). Global coverage of the middle atmospheric water vapour dis-tribution was obtained in the mid 1990s with the space shut-tle instrument MAS (Millimeter wave Atmospheric Sounder) (Croskey et al., 1992; Aellig et al., 1996). Early measure-ments of integrated water vapour at the IAP were made be-tween 1989 and 1995 by the PAMIR (Passive Microwave and Infrared Radiometer) instrument (M¨atzler, 1992). A sun photometer was acquired in 1992 (Ingold et al., 2000) and regular measurements by the passive microwave radiome-ter TROWARA (TROpospheric WAradiome-ter vapour Radiomeradiome-ter) began in 1994 (Peter and K¨ampfer, 1992). The interest in water vapour continued with the acquisition of a Global Po-sitioning System (GPS) receiver in 1998 (Rohrbach, 1999). In recent years two state of the art microwave radiometers were designed and built at the IAP for atmospheric research. These are the ASMUWARA (All Sky MUlti WAvelength RAdiometer) instrument (Martin, 2003; Martin et al., 2003; Martin et al., 2006a), which scans over the entire hemisphere to make measurements of Integrated Water Vapour (IWV) and Integrated Liquid Water (ILW), and the MIAWARA (MIddle Atmosphere WAter vapour RAdiometer) instrument which produces water vapour profiles in the middle atmo-sphere between 25 and 80 km (Deuber et al., 2004).
In this paper a database is described which brings together water vapour measurements from a GPS and sun photome-ter network in Switzerland as well as observations made by the Payerne radiosonde, the water vapour radiometers at Bern and the AMSOS airborne radiometer. The database was developed as part of the STARTWAVE (studies in At-mospheric Radiative Transfer and Water Vapour Effects) contribution to the Swiss National Centre for Competence in Research (NCCR) Climate project and is available on-line through a user-friendly interface at http://www.iapmw. unibe.ch/research/projects/STARTWAVE/. Internal Institute of Applied Physics reports and theses cited in this paper are available at http://www.iap.unibe.ch/publications/. The ob-servational area (excluding the yearly flight campaigns) is il-lustrated in Fig. 1 and extends from 45.8◦to 47.8◦north and 6.1◦ to 10.3◦ east. A particularly interesting feature of the observations is that they are made over an altitude range of
over 3000 m.
There were a number of motivations behind the creation of the database. These include: (1) the establishment of an archive for the long-term monitoring of water vapour, (2) the provision of a reference for the validation of model and satellite data and (3) the improvement of the quality of water vapour observations through the inter-comparison of differ-ent techniques. Sections 2 to 8 give a brief description of each observation technique. A validation of the IWV mea-surements at five different sites is presented in Sect. 10 and Sect. 11 uses an example of a frontal system to demonstrate how the ground-based measurements can provide informa-tion on horizontal as well as vertical water vapour variainforma-tions.
2 GPS measurements
The Automated GPS Network of Switzerland (AGNES) is a network of thirty fixed GPS receivers which was set up by the Swiss Federal Office of Topography for geodetical appli-cations. There is an additional receiver at the Institute of Ap-plied Physics in Bern, making a total of thirty-one receivers. Their geographic positions are shown in Fig. 1. They are dis-tributed throughout Switzerland at altitudes between 330 m (Muttenz in the Swiss plains, north of the Alps) and 3584 m (Jungfraujoch, a mountain pass in the Alps).
The fixed GPS receivers measure timed microwave signals sent by a constellation of orbiting satellites. These signals are delayed as they pass through the troposphere. The Zenith Total Delay (ZTD) due to the atmosphere is calculated on an hourly basis and is given as the apparent extra path through the atmosphere. It is on the order of 2 m at sea level and is composed of the Zenith Hydrostatic Delay (ZHD), due to dry gases, mainly N2and O2, and the Zenith Wet Delay (ZWD),
due to water vapour.
ZWD=ZTD−ZHD(p) (1)
The ZWD can be determined as shown in Eq. (1) by cal-culating ZHD from surface pressure measurements, p, and subtracting it from the ZTD. The integrated water vapour (IWV) can then be calculated from the ZWD using a re-lationship which is dependent on surface temperature (Be-vis et al., 1992; Emardson et al., 1998). For the START-WAVE database calculations, pressure and temperature are obtained from the closest stations in the Swiss meteorolog-ical network (ANETZ). Where there is a height difference between the meteorological station and the GPS station, the ANETZ station pressure is interpolated to the GPS station height using the hydrostatic relationship. Further details on the calculation of IWV from the AGNES ZTD data are given in Guerova et al. (2003). It should be noted that the data at Jungfraujoch require a correction of approximately +1.3 mm due to the radome which protects the antenna from ice and snow. The correction was calculated from the relationship between coincident GPS and sun photometer data (Morland
10 40 70 100 130 160 190 220
10−2
100 oxygenwater vapour
cloud liquid frequency [GHz] absorption coefficient [1/km] A PAA T AM AT P P A A A A A
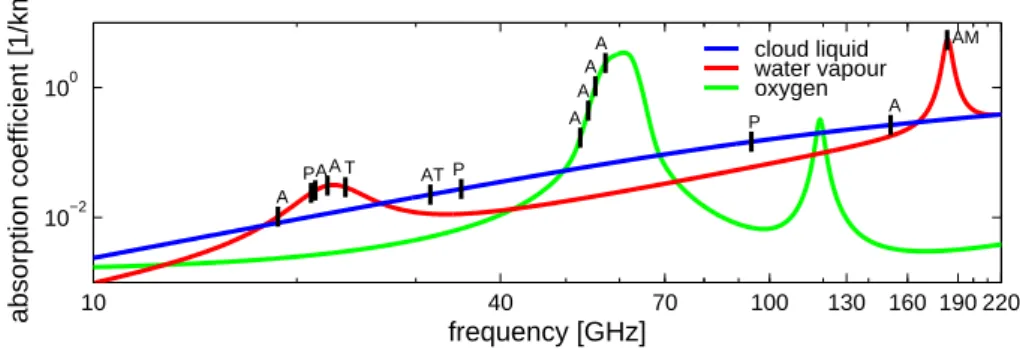
Fig. 2. The frequencies of the microwave radiometer channels in relation to water vapour, cloud liquid water and oxygen absorption. The
symbols A, AM, P, and T refer to ASMUWARA, AMSOS, PAMIR and TROWARA channels, respectively.
et al., 2006a). Please note that the units of IWV are kg/m2, which are equivalent to mm of total column height of liquid water.
3 Sun photometer/precision filter radiometer measure-ments
Sun photometers have been operated at five locations in Switzerland over the last decade (see Fig. 1). These instru-ments track the sun in order to measure direct solar irradi-ance and are equipped with sixteen or eighteen narrow-band channels in the 300 to 1024 nm range, including channels centred on the water vapour absorption bands at 719, 817 and 946 nm. Water vapour transmittance can be calculated from the observations in the water vapour bands after first estab-lishing the aerosol amount from measurements in the other bands. The water vapour transmittance is converted to inte-grated water vapour (IWV) using a method based on radiative transfer modelling (see Ingold et al., 2000). For the START-WAVE project, only IWV calculated from the 946 nm line is saved in the database as this line is considerably stronger than the others and has been shown to yield more accurate measurements (Ingold, 2000; M¨atzler et al., 2002).
An 18-channel sun photometer has been operated by the Institute of Applied Physics at Bern (575 m) since 1992, while a further four instruments, each equipped with 16 channels, are operated by the Swiss Atmospheric Radiation Monitoring program (CHARM) of MeteoSwiss. Initiated in 1992, the CHARM network includes two stations at low alti-tudes, Payerne (491 m, north of the Alps) and Locarno-Monti (366 m, south of the Alps), as well as two stations in the Alps, Davos (1590 m) and Jungfraujoch (3584 m), which moni-tor UV, visible and infrared radiation (Heimo et al., 2001). These stations are equipped with a more recent version of the Bern sun photometer (SPM2000) called the Precision Filter Radiometer (PFR), which is specifically designed to improve instrument stability. Measurements are made in sunny con-ditions at time intervals of between 30 s and 2 min (depend-ing on the station), and are averaged over hourly periods
be-fore being stored in the database. Continuous sun photometer measurements began at Davos in 1995 (Nyeki et al., 2005), at Jungfraujoch in 1999, at Locarno in 2001 and at Payerne in 2002. Since the CHARM network also measures global solar irradiance and infrared (long-wave) irradiance from the atmosphere, it provides the opportunity for linking IWV ob-servations to changes in atmospheric radiation.
4 PAMIR measurements
The Passive and Active Microwave and Infrared Radiometer (PAMIR) was originally designed for measuring the spectral signatures of snow and ice (M¨atzler, 1987). It consisted of five microwave radiometers with frequencies at 4.9, 10.4, 21, 35 and 94 GHz as well as a scatterometer (10.4 GHz) and an infrared radiometer. In 1987 it was transferred to the Tannacker agricultural research station at Mooseedorf near Bern (570 m above sea level, 7.48◦E and 47.00◦N) where it was used to characterise land surface emissivity (M¨atzler, 1993; 1994). From 1979 onwards, atmospheric measure-ments were made at a number of locations and these obser-vations were used to characterise zenith opacity at PAMIR frequencies (M¨atzler, 1992). The PAMIR channels used to calculate integrated water vapour (IWV) and integrated liq-uid water (ILW), together with those of other microwave ra-diometers contributing to the database, are shown in Fig. 2 in relation to the water vapour and liquid water absorption coefficients. The Rosenkranz (1998) and Liebe et al. (1993) microwave absorption models were used to model the rela-tionship between brightness temperature and IWV and ILW. The observations made at the Moosedorf research site between 1989 and 1995 are included in the STARTWAVE database. PAMIR was not automated and measurements were made when personnel were available. During this pe-riod 127 separate sky observations were made in conditions which ranged from clear sky to completely overcast. They represent the earliest archived integrated water vapour (IWV) measurements at Bern.
Jan950 Jul97 Jan00 Jul02 Jan05 5 10 15 20 25 30 35 40 45
TROWARA hourly data from 1994 to end 2004
Date
IWV measurement
Observations Yearly cycle Trend
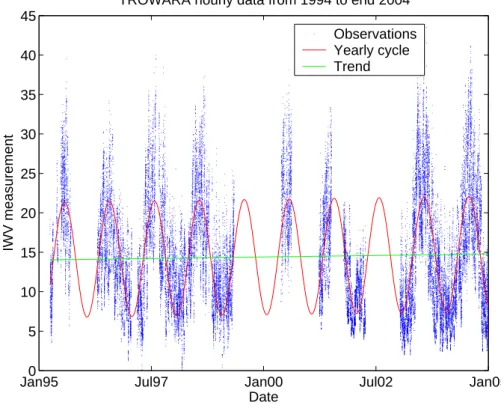
Fig. 3. Time series of TROWARA hourly integrated water vapour (IWV) measurements (blue points) with a model of the annual cycle (red)
and trend (green). Units are kg/m2.
5 TROWARA measurements
The TROpospheric WAter vapour Radiometer (TROWARA) was designed to measure Integrated Water Vapour (IWV) and Integrated Liquid Water (ILW). It began operating at Bern in 1994 and it observes the atmosphere at a fixed elevation an-gle of 40◦ in a south-easterly direction. It has one channel at 21.3 GHz which is sensitive to the water vapour absorp-tion line and another at 31.5 GHz which is more strongly influenced by liquid water (see Fig. 2). Brightness temper-ature measurements made by both channels yield estimates of IWV and ILW as described in Peter and K¨ampfer (1992). This reference also contains a description of the radiome-ter in its original setup (1994 to April 2002). The millime-ter wave propagation model of Liebe (1989) and Liebe et al. (1993) is used to derive IWV and ILW from the microwave observations. Further information is available in Ingold et al. (1998).
In 2002, the radiometer was reviewed in order to improve its stability and reliability for climate observations. A more accurate radiometer model was developed in order to im-prove the instrument calibration (Morland, 2002) and the ra-diometer was moved into an indoor laboratory from where it observes the atmosphere through a microwave transpar-ent window. This had the double advantage of increasing temperature stability and also sheltering the instrument from rain so that measurements can be made during or soon after
rain events. Another consequence was that the observation frequency increased from three to thirty measurements per minute. Between January 1994 and April 2002, the instru-ment operated during 49% of the possible observation days. While some of the downtime was due to rain, much of it was due to essential repairs being carried out on the vacuum de-vice which cooled the calibration load. This was replaced by low temperature noise diodes in spring 2004 and since then the instrument has been operational during 96% of the possi-ble observation days.
Over the 1995 to 1998 period, a bias of 2.1 mm in TROWARA relative to radiosonde data was reported (Ingold and M¨atzler, 2000). After instrument improvements carried out between 2001 and 2002, a much smaller positive bias of 0.4 mm was observed for the years 2003 and 2004. The main instrument changes were the replacement of the 21 GHz am-plifier and the improvement of the radiometer model. It is common for instruments used in climate monitoring to dis-play a bias which is due to instrumental rather than climatic factors. Statistical techniques have been developed to de-tect and correct these biases by comparing an instrument time series to one or more reference time series. Using as reference series IWV from the Payerne radiosonde as well as IWV differences between nearby meteorological stations, TROWARA IWV data were homogenised using the Multi-ple Linear Regression (MLR) technique described by Vin-cent (1998). The homogenised TROWARA IWV data are
−1 −0.5 0 0.5 1 −1 −0.5 0 0.5 1 E W N S 25 50 75
Integrated Water Vapour in kg/m2 2004−12−02, 08:18:41 UT
8 9 10 −8 −6 −4 −2 0 2 4 6 8 11.4 12.1 12.8 13.4 14.1 (a) −1 −0.5 0 0.5 1 −1 −0.5 0 0.5 1 E W N S 25 50 75
Integrated Cloud Liquid Water in kg/m2 2004−12−02, 08:18:41 UT
8 9 10 −8 −6 −4 −2 0 2 4 6 8 0.000 0.031 0.061 0.092 0.123 (b) Fig. 4. ASMUWARA sky scans on 2 December 2004 at 08:18 UT (a)integrated water vapour (IWV) scan and (b) integrated liquid
wa-ter (ILW) scan.
now available in the STARTWAVE database (Morland and M¨atzler, 20051). Figure 3 shows the resultant IWV time series. The annual cycle and trend were modelled accord-ing to Vinnikov et al. (2002). The trend estimated from the monthly anomalies is +0.06 mm per year with a standard er-ror (including the effects of autocorrelation) of 0.15 mm. We carried out the same analysis for Payerne radiosonde mea-surements made over the same period and the estimated trend was +0.06 mm per year with a smaller standard error of 0.05 mm. The standard error in the radiosonde measurements is smaller because there are no gaps in the dataset. However, the fact that a trend of the same magnitude is calculated from
1Morland, J. and M¨atzler, C.: Ten years of experience with a water vapour radiometer in the context of climate monitoring, IEEE Trans. Geosci. Rem. Sens., to be submitted, 2006.
two independent datasets supports the validity of both sets of measurements. Clearly there are not yet enough observa-tions to distinguish any long terms trends from the natural variability in the data. For this reason, we plan to continue making automatic IWV measurements with the TROWARA instrument for the foreseeable future.
6 ASMUWARA measurements
The All Sky MUlti WAvelength Radiometer (ASMUWARA) (Martin et al., 2006a) is designed to give information on the distribution of integrated water vapour (IWV) and integrated liquid water (ILW) across the sky as well as to produce pro-files of temperature and IWV. ASMUWARA is based at Bern and has ten channels: nine microwave channels with frequen-cies between 18 and 150 GHz (see Fig. 2) and one channel in the thermal infrared.
The three channels around the 21 GHz water vapour ab-sorption line and the 31 GHz channel, which is more sen-sitive to liquid water, are used to determine IWV and ILW using the method described in Westwater (1993). The microwave absorption models for atmospheric gases and clouds, respectively, are those described in Rosenkranz (1998) and Liebe et al. (1993). These channels are also used to obtain water vapour profiles from the ground up to five km altitude (Martin et al., 2006b).
Temperature profiles in the first 5 km above the instru-ment (Martin et al., 2006b) are obtained from observations made by the four channels lying on the lower frequency side of the pressure broadened oxygen absorption complex near 60 GHz. The vertical resolution of the profiles decreases with height and is approximately equal to the height above the ground (L¨udi et al., 2003). An infrared radiometer (9.6– 11.5 µm) operates alongside the microwave radiometer and is used, along with the temperature profiles, to deduce cloud base height.
In order to build up an image of the sky, ASMUWARA completes a hemispherical sky scan every twenty minutes. Observations are made at azimuth angles between 0 and 360◦ in 30◦ steps. At every azimuth angle, the instrument scans through zenith angles between 0 and 85◦. Figure 4 shows examples of the hemispherical IWV and ILW amounts mea-sured on the 2 December 2004 at 08:18 UT. The IWV scan in Fig. 4a shows that values in the north and west are about 2.5 mm higher than those in the south-east. At the same time the ILW values in the north are also high while ILW values close to zero in the south indicate clear sky.
For a short period in September 2003, two radiome-ters were operated at Bern in addition to ASMUWARA and TROWARA as part of the MATRAG (Measurement of Alpine Tropospheric delay by Radiometers and GPS) project (Haefele et al., 2004). Over a three day period, IWV cal-culated by all four radiometers agreed to within 1 mm. AS-MUWARA tropospheric opacities have also been favourably
3 3.5 4 4.5 5 5.5 6
May04 Jun04 Jul04 Aug04 Sep04 Oct04 Nov04Dec04 Jan05 Feb05Mar0520
25 30 35 40 45 50 55 60 Altitude [km] MIAWARA H
2O Volume Mixing Ratio @ Bern
Fig. 5. A one year series of MIAWARA profiles from May 2004 to March 2005. The water vapour mixing ratio is measured in parts per
million volume.
H2O volume mixing ratio [ppm]
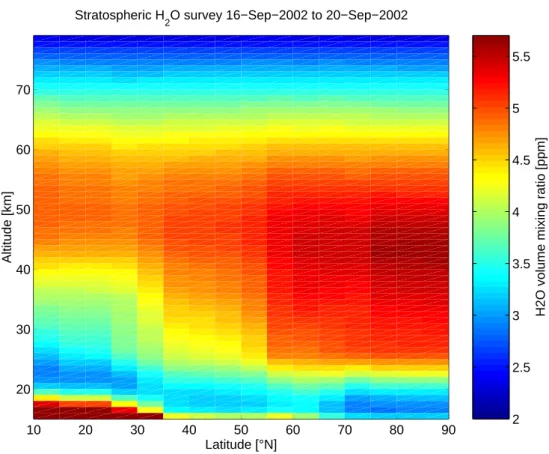
2 2.5 3 3.5 4 4.5 5 5.5 10 20 30 40 50 60 70 80 90 20 30 40 50 60 70 Latitude [°N] Altitude [km] Stratospheric H
2O survey 16−Sep−2002 to 20−Sep−2002
Fig. 6. Example of AMSOS measurements from the flight campaign in September 2002. Measurements were made between 22◦W and 20◦E. The individual water vapour profiles were binned into 5-degree latitude bands and then averaged.
compared to MIAWARA tropospheric opacities (Deuber et al., 2005).
7 MIAWARA measurements
The MIddle Atmosphere WAter vapour RAdiometer (MI-AWARA) is a ground-based radiometer which retrieves stratospheric water vapour profiles using spectral observa-tions at 22 GHz. Radiation is measured over a 1 GHz band centred on the 22.235 GHz water vapour line shown in Fig. 2. Because this line is pressure broadened, high resolution spec-tral measurements yield water vapour profiles. At Bern (47◦N), profiles can be retrieved between 25 and 65 km. This approximately corresponds to pressures between 50 and 3 hPa. A detailed description of the instrument and its cali-bration technique is given in Deuber et al. (2004).
A one year series of MIAWARA measurements made be-tween May 2004 and March 2005 is shown in Fig. 5. The water vapour profiles peak between 30 and 50 km where the oxidation of methane is most efficient. Because photo disso-ciation by Lyman-alpha radiation is more efficient at higher altitudes, the water vapour content decreases with altitude in the upper stratosphere and mesosphere. A recent study (Deu-ber, 2004) demonstrated the application of MIAWARA data to the study of the dynamics of stratospheric water vapour.
From January to April 2004, MIAWARA was located at Sodankyl¨a, Finland (67◦N) where it took part in the LAUT-LOS/WAVAP campaign. Deuber et al. (2005) presented an extensive validation of MIAWARA measurements made both at Bern and Sodankyl¨a. MIAWARA profiles obtained at Bern and Sodankyl¨a agreed with satellite profiles to within 10 and 8%, respectively. Due to the dry polar atmosphere at Sodankyl¨a, MIAWARA was able to make measurements starting from an altitude as low as 20 km. This allowed the comparison of MIAWARA measurements in the 20 to 30 km altitude range with two balloon-borne instruments – the NOAA frost point hygrometer and the FLASH advanced stratospheric hygrometer. The differences between the ra-diometer and the in situ sensors were less than 2%.
8 AMSOS measurements
The Airborne Microwave Stratospheric Observing System (AMSOS) is designed to measure stratospheric water vapour profiles from an aircraft platform. Unlike the ground-based microwave instruments, AMSOS observes the centre of a strong water vapour spectral line near 183 GHz (see Fig. 2). This line can only be observed from high altitudes because the largest part of the troposphere is opaque at this frequency range. However, from a flight altitude of 10 km or above, this strong line can be observed with an excellent signal-to-noise ratio, which means that a spectrum can be obtained every few minutes. From the measured spectra, profiles of stratospheric water vapour can be retrieved along the flight
track for the 15–65 km altitude range. Details of the instru-ment are reported by Vasic et al. (2005). AMSOS has been flown on yearly flight campaigns since 1994. A typical cam-paign extends from Switzerland over northern Europe into the Arctic as well as southwards along the west coast of Africa into the tropics and includes most latitudes from the Equator to the North Pole. Figure 6 shows an example of the water vapour distribution measured during the campaign in September 2002. The water vapour distributions mea-sured during summer campaigns were dominated by large-scale transport and showed the effects of the Brewer-Dobson circulation. In wintertime, additional small-scale structures appeared which resulted mostly from vertical transport in the polar vortex.
9 Radiosoundings
The radiosoundings at Payerne consist of temperature and humidity vertical profiles measured by MeteoSwiss with the Swiss RadioSonde (SRS400) twice a day since 1990. Al-though the radiosonde cannot be regarded as a reference sys-tem, it constitutes a valuable long-term dataset for the evalu-ation of other water vapour measurement techniques.
During the calculation of water vapour density, temper-ature measurements are used to obtain the saturation water vapour pressure. The measurement accuracy of the tem-perature sensor (Cu-Co thermocouple) in the troposphere is approximatively ±0.2 K. Radiation effects on the sensor are corrected according to the method of Ruffieux and Joss (2003). The humidity sensor is a resistive carbon hygristor manufactured first by VIZ, then by Sippican since 1999. It is still widely used in the US National Weather Service upper-air network. References in Larsen et al. (1993) report that this sensor has an accuracy ranging from ± 5% (for relative humidities in the 20% to 90% range) to 7% (for relative hu-midities in the ranges 0% to 20% and 90% to 100%), while the precision is stated to be ±3% (root mean square).
The quality, accuracy and reproducibility of the VIZ/Sippican carbon hygristors are limited by their de-creasing response at low temperatures in the middle to upper troposphere (see Eliott et al., 2002; Wang et al., 2003, and articles cited therein). Furthermore, the radiosonde carbon hygristor tends to slightly under-estimate water vapour in the lower troposphere near humidity saturation. As the main contribution to the IWV comes from the lower troposphere, the average effect on the IWV should be a small negative bias. Nevertheless, for winter cases with a very dry free troposphere above low stratus (low IWV values), the bias is positive. Comparisons with a chilled mirror hygrometer allowed a statistical correction of the hygristor humidity profiles. Resultant IWV are on average a few percent higher than the original values that submitted to the STARTWAVE data base (Jeannet, 2004). The STARTWAVE database contains integrated water vapour (IWV) calculated from the
04 09 14 19 24 29 0 5 10 15 20 25 IWV, mm
IWV for the month of January 2003 at Bern
GPS SPM Sonde IWV 575 m TROWARA ASMUWARA 04 09 14 19 24 29 0 5 10 15 IWV, mm
IWV for the month of January 2003 at Davos
Day in January 2003
GPS PFR
Sonde IWV 1598 m
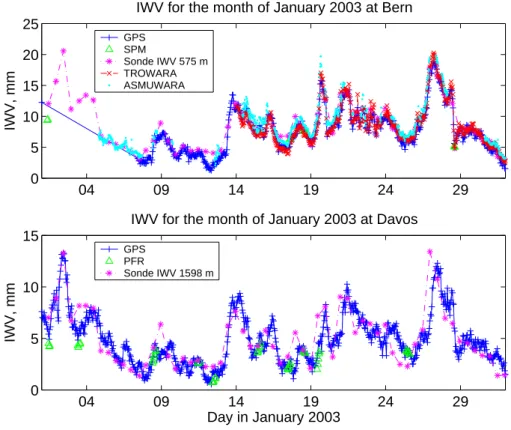
Fig. 7. A comparison between all available IWV observations for Bern (575 m) and Davos (1598 m) during January 2003. PFR refers to the
Precision Filter Radiometer at Davos and SPM to the sun photometer at Bern.
03 08 13 18 23 28 10 20 30 40 50 IWV, mm
IWV for the month of July 2003 at Bern
GPS SPM Sonde IWV 575 m TROWARA ASMUWARA 03 08 13 18 23 28 0 10 20 30 IWV, mm
IWV for the month of July 2003 at Davos
Day in July 2003
GPS PFR
Sonde IWV 1598 m
Fig. 8. A comparison between all available IWV observations for Bern (575 m) and Davos (1598 m) during July 2003. PFR refers to the
radiosonde data for the period from 1994 onwards. In order to obtain IWV, water vapour density, ρ, is calculated from temperature and relative humidity and this is integrated over height, h: IWV = hlimit Z 0 ρdh (2)
The integration is performed up to a height equivalent to 200 mbar (nearly 12 km), where humidity measurements are stopped. In order to ease comparison between radiosonde and GPS, the integration is also carried out from the heights equivalent to five different GPS stations: 575 m (Bern), 907 m (Zimmerwald), 1598 m (Davos), 2318 m (Andermatt) and 3580 m (Jungfraujoch). ZTD is also calculated from the IWV for these heights as well as from ground level at erne (498 m a.s.l.). The distance of these stations to Pay-erne ranges from 40 km (Bern and Zimmerwald) to 220 km (Davos, within the Alps) as can be seen in Fig. 1.
10 Validation of Integrated Water Vapour measure-ments
As an example of the capability of the database, Figs. 7 and 8 show all the measurements made at Bern and Davos in both January and July 2003. The radiosonde IWV was calcu-lated by integrating Payerne radiosonde measurements from a starting altitude of 575 m for Bern and 1598 m for Davos.
The data at Bern generally show very good correspon-dence between the ASMUWARA, TROWARA and GPS data. The sun photometer measures less frequently than the other instruments due to the requirements of sunny condi-tions. In July 2003, the Payerne radiosonde occasionally, mostly at 12:00 UTC, has a large negative bias relative to the instruments at Bern. The mean bias in the radiosonde relative to TROWARA in July was just −0.5 mm during the 00:00 UT sounding, but −2.2 mm during the 12:00 UT sounding. The mean IWV measured by TROWARA in July was 22.7 mm and these represent biases of −2.2 and −9.7%, respectively. This is probably due to the effect of solar heating on the ra-diosonde sensors. This has been shown to produce a negative bias in the radiosonde data relative to the GPS data at Pay-erne during the 12 UT sounding (Guerova et al, 2005) and during the summer months (Morland and M¨atzler, 2006).
The GPS and the PFR measurements at Davos shown in Figs. 7 and 8 agree very well. The Payerne radiosonde, inte-grated from the altitude of Davos, gives similar IWV values to GPS in January but has a considerable negative bias during most of the days in the very hot month of July 2003, probably due to differing local atmospheric conditions over the Swiss plains and the Alps on convective days. The Davos compar-isons for January allow us to see the time lag between events in Payerne 6.95◦E and Davos 9.85◦E. For instance, there
is a large increase in the IWV measured by the Payerne ra-diosonde which peaks at 23:00 UT on the 26 January 2003 (marked with an arrow on Fig. 7), whereas the corresponding increase in the IWV measured by the GPS at Davos occurs twelve hours later at 11:00 UT on 27 January 2003.
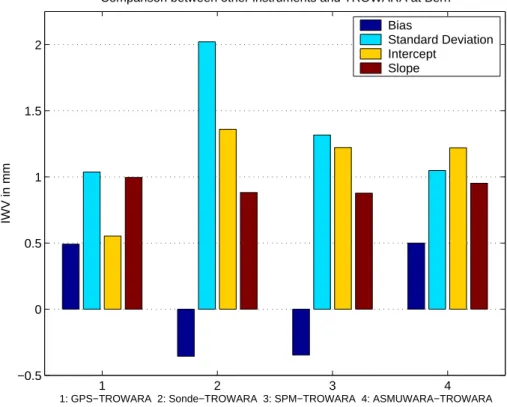
Figure 9 summarises the statistics for the comparison of all other instruments at Bern and the Payerne radiosonde with TROWARA over the years 2003 and 2004. TROWARA was chosen as a reference because it has the highest measurement frequency (approximately 1900 observations are averaged to give an hourly mean value). The radiosonde measurements were compared with the average of the TROWARA data obtained during the two hours after the radiosonde launch time. The bias in other instruments relative to TROWARA is within ±0.5 mm. The standard deviation is between 1 and 2 mm. Not surprisingly, the standard deviation is highest for the radiosonde which is launched 40 km west southwest of Bern. The intercept of the best linear fit between TROWARA and other datasets lies between +0.6 mm (GPS) and +1.4 mm (radiosonde) and the slope between 0.88 (sun photometer and radiosonde) and 1.0 (GPS).
The statistics of the comparisons between GPS and PFR, PFR and radiosonde and GPS and radiosonde are shown in the first, second and third set of bars in Fig. 10. The Pay-erne radiosonde was used in the comparisons with the data from Payerne, Davos and Jungfraujoch. The measurements were integrated from the heights of Davos and Jungfraujoch, respectively, for comparison with the ground based measure-ments at these stations. Data from the Milano radiosonde (45.43◦N, 9.28◦E, 103 m altitude) were integrated from the height of Locarno (366 m) for comparison with the GPS and PFR measurements at this site.
The slopes of the comparisons shown in Fig. 10 lie between 0.75 (PFR:radiosonde at Locarno) and 1.12 (GPS:radiosonde at Jungfraujoch). The intercepts lie between −1.0 mm (GPS:PFR at Payerne) and +1.7 mm (GPS:radiosonde at Davos).
The GPS and PFR are positively biased relative to the ra-diosonde measurements, apart from the case of the PFR at Locarno. This implies an overall negative bias in the ra-diosonde IWV. However, the negative bias could also be caused by climatological differences between the Alpine sites and Payerne, in the Swiss plains. The PFR at Payerne has a large positive bias of 3.1 mm in comparison to the ra-diosonde, whereas the bias in the GPS is only +0.8 mm. The large bias in the PFR may be partly due to the fact that it only observes during the daytime and could only be compared with 12:00 UT soundings. Over the same period, biases of −0.1 mm and +1.2 mm were observed between the GPS and the radiosonde measurements at 00:00 and 12:00 UT, respec-tively.
The bias in the GPS relative to the PFR is −0.8 mm at Pay-erne and +0.6 mm at Davos. It should be noted that the GPS and PFR measurements at Jungfraujoch are not independent as the PFR was used to correct a constant bias in the GPS
1 2 3 4 −0.5 0 0.5 1 1.5 2
1: GPS−TROWARA 2: Sonde−TROWARA 3: SPM−TROWARA 4: ASMUWARA−TROWARA
IWV in mm
Comparison between other instruments and TROWARA at Bern Bias
Standard Deviation Intercept
Slope
Fig. 9. The bias (light blue) and standard deviation (dark blue) of the comparison between GPS (Bern), radiosonde (Payerne), SPM (Sun
Photometer, Bern), ASMUWARA (Bern) with TROWARA (Bern). Also shown are the intercept (yellow) and slope (brown) of the best fit linear relationship between each instrument and TROWARA.
caused by the radome at this site (Morland et al., 2006a). At Locarno the GPS has a considerably larger bias of +1.8 mm relative to the PFR. The PFR at Locarno has a negative bias of −2.2 mm relative to the Milano radiosonde, whereas the GPS has a positive bias of 1.0 mm. This suggests that the cal-ibration of the Locarno PFR dataset is not yet optimal, due to the difficulties in obtaining the required periods of atmo-spheric stability at this site. Biases of up to 2 mm between PFR and either GPS or radiosonde are not unusual (Bokoye et al., 2003). However, the biases between PFR and GPS at the other STARTWAVE stations are less than 1 mm which in-dicates that the Locarno results could be improved. The PFR instruments are now being rotated between high altitude and low altitude stations so that improved calibrations at Locarno can be expected in the future.
11 Case study
The STARTWAVE water vapour measurements can yield de-tailed information on water vapour variability. We demon-strate this with the example of a frontal system which crossed Switzerland between 18 November 2004 and 19 Novem-ber 2004. Figure 11 shows a time series of IWV mea-sured by GPS and microwave radiometer. Hourly averages are shown for the TROWARA data and 20 min averages
are plotted for ASMUWARA. During this period, the AS-MUWARA microwave radiometer was located at Payerne for a field campaign, although it is normally based in Bern. Be-tween 18 November 2004 19:00:00 and 19 November 2004 02:00:00, the GPS at Bern (575 m), ASMUWARA (Payerne) and TROWARA (Bern) measured an IWV increase of 7 to 9 mm. An increase of 8 mm is observed by the GPS at Saa-nen (1369 m) over the same time period. The IWV values at this higher altitude station are about 4 mm lower than those at Bern before the passage of the front and about 1.3 mm lower afterwards. At Andermatt and Jungfraujoch, smaller IWV increases of 5.5 and 3.5 mm, respectively, are recorded. It should be noted that because of the noise in the GPS signal, it cannot reliably resolve IWV values less than 0.5 mm, which is a problem at the Jungfraujoch station where low IWV val-ues are frequently recorded. The STARTWAVE data can pro-vide information on temporal changes in water vapour with a resolution of one hour or less, as well as providing infor-mation on the changes in water vapour with height. Since there is a network of GPS receivers distributed throughout Switzerland, we might ask whether we can also obtain in-formation on the horizontal distribution of water vapour. If we were to plot the IWV values measured by the GPS sta-tions, we would see little more than the fact that there is less IWV over the Alps. In order to study the spatial distribution
−2 0 2 4 Locarno, 388 m −2 0 2 4 Payerne, 491 m −2 0 2 4 Davos, 1598 m 1 2 3 −2 0 2 4 Jungfraujoch, 3584 m 1: GPS−PFR 2: PFR−Sonde, 3: GPS−Sonde
Fig. 10. The bias (light blue), standard deviation (dark blue), intercept (yellow) and slope (brown) of the relationships between IWV
measurements made at Locarno, Payerne, Davos and Jungfraujoch. Units are kg/m2. The comparisons between GPS (dependent) and PFR (independent), PFR (dependent) and radiosonde (independent) and GPS (dependent) and radiosonde (independent) are shown in the first, second and third sets of bars, respectively. The radiosonde measurements are integrated from the height of the station used in the comparison.
of water vapour, we must first remove the effects of altitude. We do this by using an empirical relationship to correct the IWV measured at a given height z, IWV(z), to that which would be expected at 0.5 km, IWV(0.5):
IWV(0.5) = a ∗ IWV(z) ∗ exp(z −0.5)
H (3)
All heights are in kilometres. H is the scale height of the re-lationship and a is a parameter which is related to the scatter in the observed relationship between IWV and altitude. We averaged the GPS data acquired during 2004 over 6 hourly intervals (to reduce the effect of spatial variations) and fitted Eq. (2) to the IWV observed at different heights. An estimate of H and a was obtained for each 6 h period. The mean val-ues for 2004 were 2.11 km (standard deviation, 0.49 km) and 1.02 (standard deviation, 0.08) for H and a, respectively. We then found best fit relationships between the calculated val-ues of a and H and the observed IWV. The scale height, H , was found to be related to the IWV at Jungfraujoch (3584 m), and to the difference between the IWV at Payerne (491 m) and that at Jungfraujoch. The coefficient a on the other hand, was related to both the north-south IWV gradient between Payerne (46.81◦N, 6.94◦E) and Stabio (45.86◦N, 8.94◦E,
366 m) as well as the east-west IWV gradient between Pay-erne and St. Gallen (47.44◦N, 9.34◦E, 707 m). The altitude correction is described in more detail in Morland and M¨atzler (2006).
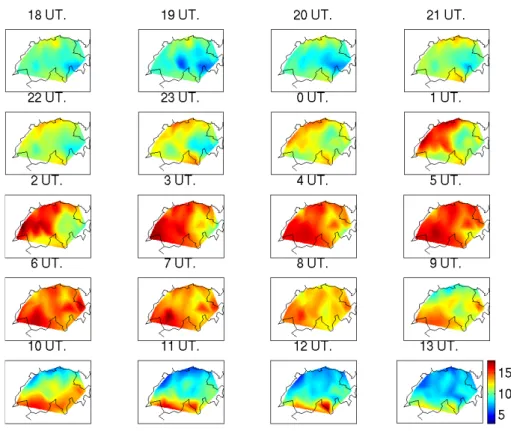
Using values of a and H calculated from the observed IWV differences, we corrected the hourly IWV at all stations to a height of 500 m. This is plotted in Fig. 12 at hourly inter-vals from 18 November 2004 18:00:00 to 19 November 2004 13:00:00. The altitude corrected IWV increased throughout the evening of the 18 November 2004 from a mean value of 10.0 mm at 18:00:00 to a mean value of 12.3 mm at 19 November 2004 00:00:00. The mean IWV is 14.6 mm at 19 November 2004 03:00:00 and 06:00:00, with minimum val-ues of 8 and 12 mm, respectively. At 19 November 2004 09:00:00, several stations in the north recorded IWV values of less than 11 mm and at 12:00:00, only the area south of the Alps showed IWV values of 13.6 mm or more. At 15:00:00, after the passage of the front, the average IWV was 6.1 mm, with a maximum value of 9.8 mm.
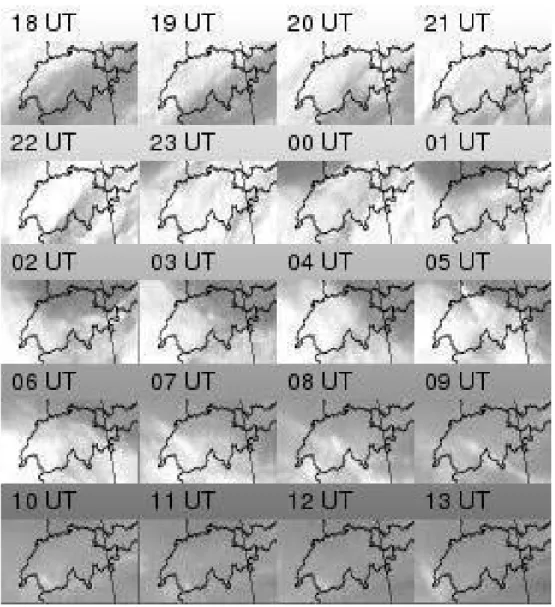
As a comparison, we show the Meteosat Second Genera-tion (MSG) channel 5 (6.2 µm) images obtained at hourly in-tervals between 18 November 2004 18:00 UT to 19 Novem-ber 2004 13:00 UT. Whiter areas indicate higher water
18/110 19/11 20/11 2 4 6 8 10 12 14 16 18 IWV, mm
IWV observed by GPS and MW between 18/11/04 and 19/11/04 MR PAYE 491 m MR BERN 575 m GPS BERN 575 m GPS SAAN 1369 m GPS ANDE 2318 m GPS JUJO 3584 m
Fig. 11. A time series of GPS, ASMUWARA (Payerne) and TROWARA (Bern) IWV measurements during the passage of a frontal system
from the 18 November 2004 to 19 November 2004. GPS measurements are shown for Bern, Payerne, Saanen, Andermatt and Jungfraujoch.
Fig. 12. The IWV measured by the GPS network during the passage of a frontal system from 18:00 UT on 18 November 2004 to 13:00 UT on
the 19 November 2004. Units are kg/m2. The IWV for all stations is corrected to a height of 500 m. The plots represent GPS measurements from the previous hour and are shown at hourly intervals.
Fig. 13. A series of hourly water vapour (channel 5, 6.2 µm) images obtained by the Meteosat Second Generation (MSG) satellite system
from 18 November 2004 to 19 November 2004.
vapour values. When making comparisons between MSG images and IWV data, it should be borne in mind that the satellite water vapour channel has a peak sensitivity at 320 hPa. We estimate, from radiosoundings made during this period, that the water vapour at 320 hPa and above makes a contribution of 0.3 to 1.1% to the total integrated water vapour. This is probably the reason why the MSG images show increased water vapour at 18 November 2004 20:00 UT when the GPS and MW measurements had not yet recorded a water vapour increase. However, the MSG images con-firm the general pattern shown by the GPS, i.e. that moister air was brought in from the north west on the evening of 18 November 2004 and that it moved away towards the south west on the morning of 19 November 2004.
This example serves to show the potential of the GPS mea-surements to study the spatial variability of water vapour.
However, it also demonstrates that the frontal system is much larger than the study area. For this reason, we would like to extend the database to include GPS stations outside Switzer-land.
12 Summary and conclusions
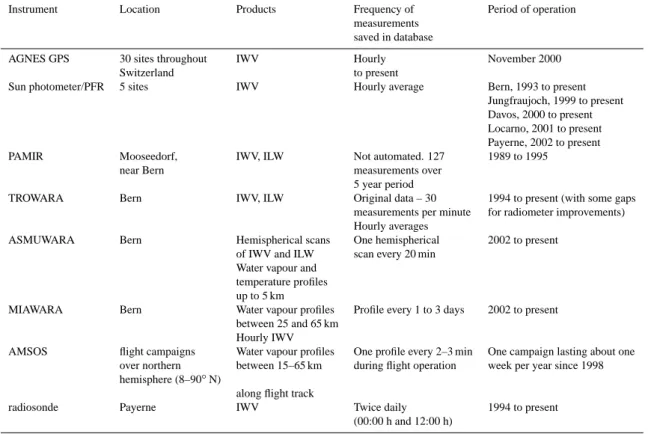
Table 1 summarises the products available in the START-WAVE database, the frequency of the measurements and the period of operation. The GPS, TROWARA and radiosonde data are automatically updated. Data processing for the other instruments is not yet fully automated and processed data are delivered to the database with a time lag of several months.
The STARTWAVE database was created with the follow-ing aims:
Table 1. Summary of the products available in the STARTWAVE database.
Instrument Location Products Frequency of Period of operation
measurements saved in database
AGNES GPS 30 sites throughout IWV Hourly November 2000
Switzerland to present
Sun photometer/PFR 5 sites IWV Hourly average Bern, 1993 to present
Jungfraujoch, 1999 to present Davos, 2000 to present Locarno, 2001 to present Payerne, 2002 to present
PAMIR Mooseedorf, IWV, ILW Not automated. 127 1989 to 1995
near Bern measurements over
5 year period
TROWARA Bern IWV, ILW Original data – 30 1994 to present (with some gaps
measurements per minute for radiometer improvements) Hourly averages
ASMUWARA Bern Hemispherical scans One hemispherical 2002 to present
of IWV and ILW scan every 20 min Water vapour and
temperature profiles up to 5 km
MIAWARA Bern Water vapour profiles Profile every 1 to 3 days 2002 to present
between 25 and 65 km Hourly IWV
AMSOS flight campaigns Water vapour profiles One profile every 2–3 min One campaign lasting about one over northern between 15–65 km during flight operation week per year since 1998 hemisphere (8–90◦N)
along flight track
radiosonde Payerne IWV Twice daily 1994 to present
(00:00 h and 12:00 h)
1. The intercomparison and validation of different water vapour measurement techniques
2. The validation of model data
3. The validation of satellite observations
4. The study of water vapour characteristics in the Alpine region
5. The study of atmospheric processes
6. The detection of long term trends in water vapour In this paper, we have presented the results of an instrument inter-comparison. Most measurements at the same location agreed to within ±0.5 mm. Poorer results were obtained for the GPS-PFR comparison at Locarno but it should be possi-ble to obtain better results once the expected improvements in the instrument calibration have been obtained.
Several studies have already been carried out in which model data are compared with ground-based observations. GPS are independent of numerical weather prediction (NWP) models since they are not assimilated into the me-teorological observing system. Guerova et al. (2003) used GPS observations to validate two MeteoSwiss NWP mod-els: the Local Model and the Swiss Model. In another study,
GPS observations were compared with the 40 year reanal-ysis dataset (ERA40) produced by the European Centre for Medium Range Weather Forecasting (ECMWF) (Morland et al., 2006a). It was found that the reanalysis data capture wa-ter vapour variations on timescales of several days very well. A similar study between AMSOS stratospheric water vapour measurements and ERA40 and ECMWF operational data is currently in progress. The Swiss GPS data were also used to evaluate the ECHAM5 climate model. A three year GPS water vapour climatology was compared with that produced by the ECHAM5 climate model run with the current climate conditions. There was good agreement between the altitude dependence of both annually and seasonally averaged GPS IWV and that calculated by the model (M. Wild, personal communication).
The MIAWARA profiles have already been favourably compared with satellite measurements (Deuber et al., 2005). Comparisons between STARTWAVE IWV observations and satellite data will form part of the next phase of the project.
We demonstrated, using a case study of a frontal system, that the Alpine GPS data contain information on integrated water vapour at different heights. In order to obtain informa-tion on horizontal variability, it is necessary to make an alti-tude correction. In the future, we hope to expand the number of GPS receivers contributing to the project so that we can
improve the altitude-based correction and investigate water vapour on a regional basis.
There is not yet a sufficiently long time series of measure-ments to detect water vapour trends. The time series anal-ysis carried out on the first ten years of observations made by TROWARA at Bern suggests that IWV is increasing. Us-ing the method described in Weatherhead et al. (1998), we estimate that 25 years of TROWARA observations are re-quired before a trend can be detected at the 90% confidence level. The database project is therefore very important for long term water vapour monitoring, as it provides a frame-work for archiving data on an ongoing basis.
Acknowledgements. This work was funded by the Swiss
Na-tional Centre for Competence in Research Climate project (NCCR-Climate). MeteoSwiss provided surface meteorological measurements and radiosonde data and GPS ZTD data were supplied by the Swiss Federal Office of Topography. We thank E. Brockmann for his help with the GPS dataset. The MSG images were provided by EUMETSAT and we are grateful for the help of E. Koffi from the University of Fribourg in preparing the images. Edited by: P. Haynes
References
Aellig, C., Bacmeister, J., Bevilacqua, R., Daehler, M., Kriebel, D., Pauls, T., Siskind, D., K¨ampfer, N., Langen, J., Hartmann, G., Berg, A., Park, J., and Russell III, J.: Space borne H2O measure-ments in the Arctic stratosphere and mesosphere in the spring 1992, Geophys. Res. Lett., 23(17), 2325–2328, 1996.
Basili, P., Bonafoni, S., Ferrara, R., and Ciotti, P.: Atmospheric Water Vapor Retrieval by Means of Both a GPS Network and a Microwave Radiometer During an Experimental Campaign in Cagliari, Italy, in 1999, IEEE Trans. Geosci. Remote Sens., 39, 11, 2436–2443, 2001.
Bevis, M., Businger, S., Herring, T. A., Rocken C., Anthes, R. A., and Ware, R. H.: GPS Meteorology: Remote sensing of atmo-spheric water vapor using the Global Positioning System, J. Geo-phys. Res., 97, 15 787–15 801, 1992.
Bokoye, A. I., Royer, A., O’Neill, N. T., Cliche, P., McArthur, L. J. B., Teillet, P. M., Fedosejevs, G., and Theriault, J.-M.: Multisensor analysis of integrated atmospheric water vapour over Canada and Alaska, J. Geophys. Res., 108(D15), 4480, doi:10.1029/2002JD002721, 2003.
Croskey C., K¨ampfer, N., Bevilacqua, R., Hartmann G., Kunzi, K., Schwartz, Ph., Olivero, J., Puliafito, E., Aellig, Ch., Umlauft, G., Waltman, W., and Degenhardt, W.: The Millimeter wave Atmo-spheric Sounder (MAS): A Shuttle Based Remote Sensing Ex-periment, IEEE Trans. Microwave Theory Tech., 40, 6, 1090– 1100, 1992.
Deuber, B.: October 2003 Enhanced Stratospheric Water Vapour over Bern: A Dynamical Case Study, IAP Research Report No. 2004-09 MW, Institute of Applied Physics, University of Bern, 2004.
Deuber, B., K¨ampfer, N., and Feist, D. G.: A new 22-GHz radiome-ter for middle atmospheric waradiome-ter vapor profile measurements, IEEE Trans. Geosci. Remote Sens., 42, 5, 974–984, 2004. Deuber, B., Haefele, A., Feist, D. G., Martin, L., K¨ampfer,
N., Nedoluha, G. E., Yushkov, V., Khaykin, S., Kivi, R., and V¨omel, H.: Middle Atmospheric Water Vapour Radiome-ter – MIAWARA: Validation and first results of the LAUT-LOS/WAVVAP campaign, J. Geophys. Res., 110(D13), D13306, doi:10.1029/2004JD005543, 2005.
Elliott, W. P., Ross, R. J., and Blackmore, W. H.: Recent Changes in NWS Upper-Air Observations with Emphasis on Changes from VIZ to Vaisala Radiosondes, Bull. Am. Meteorol. Soc., 83, 7, 1003–1017, doi:10.1175/1520-0477(2002)083, 2002.
Emardson, T. R., Elgered, G., and Johanson, J.: Three months of continuous monitoring of atmospheric water vapor with a net-work of Global Positioning System receivers, J. Geophys. Res., 103(D2), 1807–1820, doi:10.1029/97JD03015, 1998.
Feist, D. G., Vasic, V., and K¨ampfer, N.: Changes in the distribution of stratospheric water vapor observed by an airborne microwave radiometer, in: Proceedings of the 16th ESA Symposium on Eu-ropean Rocket and Balloon Programmes and Related Research, edited by: Warmbein, B., SP-530, 401–404, 2003.
Gradinarsky, L. P., Johansson, J. M., Bouma, H. R., Scherneck, H. G., and Elgered, G.: Climate monitoring using GPS, Phys. Chem. Earth, 27, 335–340, 2002.
Guerova, G., Brockmann, E., Quiby, J., Schubiger, F., and M¨atzler, C.: Validation of NWP mesoscale models with Swiss GPS Net-work AGNES, J. Appl. Meteorol., 42, 1, 141–150, 2003. Guerova, G., Brockmann, E., Schubiger, F., Morland, J., and
M¨atzler, C.: An Integrated Assessment of Measured and Modeled Integrated Water Vapor in Switzerland for the Pe-riod 2001–2003, J. Appl. Meteorol., 44, 7, 1033–1044, doi:10.1175/JAM2255.1, 2005.
Haefele, P., Martin, L., Becker, M., Brockmann, E., Morland, J., Nyeki, N., M¨atzler, C., and Kirchner, M.: Impact of Radiomet-ric Water Vapor Measurements on Troposphere and Height Esti-mates by GPS, in: Proceedings of ION GNSS 2004, 21st to 24th September 2004, Long Beach, Session F5: GPS Meteorology, 2004.
Hagemann, S. and Bengtsson, L.: On the determination of atmo-spheric water vapor from GPS measurements, J. Geophys. Res., 108(D21), 4678, doi:10.1029/2002JD003235, 2003.
Halthore, N. R., Thomas, F. E., Holben, B. N., and Markham, B. L.: Sun photometric measurements of atmospheric water vapor col-umn abundance in the 940-nm band, J. Geophys. Res., 102(D4), 4343–4352, doi:10.1029/96JD03247, 1997.
Heimo, A., Vernez, A., Lehmann, A., Goeldi, B., Philipona, R., Marty, Ch., Wehrli, Ch., and Ingold, T.: The Swiss Atmospheric Radiation Monitoring CHARM: Implementation and first results, in: IRS-2000: Current Problems in Atmospheric Radiation, 528-531, edited by: Smith, W. L. and Timofeyev, Y. M., A. Deepak Publishing, Hampton, Va., USA, 2001.
Holben, B. N., Eck, T. F., Slutsker, I., Tanr´e, D., Buis, J. P., Set-zer, A., Vermote, E., Reagan, J. A., Kaufman, Y. J., Nakajima, T., Lavenu, F., Jankowiak, I., and Smirnov, A..:, AERONET: A federated instrument network and data archive for aerosol char-acterization, Rem. Sens. Environ., 66, 1–16, 1998.
Ingold, T., Peter, R., and K¨ampfer, N.: Weighted mean tropospheric temperature and transmittance determination at millimeter-wave
frequencies for ground-based applications, Radio Sci., 33, 905– 918, 1998.
Ingold, T., Schmid, B., M¨atzler, C., Demoulin, P., and K¨ampfer, N.: Modeled and empirical approaches for retrieving columnar water vapor from solar transmittance measurements in the 0.72, 0.82 and 0.94 µm absorption bands, J. Geophys. Res., 105(D19), 24 327–24 344, doi:10.1029/2000JD900392, 2000.
Ingold, T. and M¨atzler, C.: Four Years of Columnar Water Vapor Measurements above the Swiss Central Plain using Radiosondes and a Microwave Radiometer, IAP Research Report No. 2000-02, Institute of Applied Physics, University of Bern, 2000. Intergovernmental Panel on Climate Change (IPCC): Climate
Change 2001: The Scientific Basis, edited by: Houghton, J. T., Ding, Y., Griggs, D. J., Noguer, M., van der Linden, P. J., Dai, X., Maskell, K., and Johnson, C. A., Cambridge University Press, Cambridge, 2001.
Jeannet, P.: TUC Experiment: Soundings data set V1.0, Internal MeteoSwiss report, 19 November 2004, 18 p., 2004.
Larsen, J. C., Chiou, E. W., Chu, W. P., McCormick, M. P., Mc-Master, L. R., Oltmans, S., and Rind, D.: A comparison of the stratospheric aerosol and gas experiment II tropospheric water vapor to radiosonde measurements, J. Geophys. Res., 98(D3), 4897–4918, doi:10.1029/92JD01630, 1993.
Liebe, H. J.: MPM - an atmospheric millimeter-wave propagation model, Interntl. J. Infrared & Millimeter Waves, 10, 631–650, 1989.
Liebe, H. J., Hufford, G. A., and Cotton, M. G.: Propagation model-ing of moist air and suspended water/ice particles at frequencies below 100 GHz, paper presented at the AGARD 52nd Special-ists’ Meeting of the Electromagnetic Wave Propagation Panel, Palma De Mallorca, Spain, May 17–21, 1993.
L¨udi, A., Martin, L., and M¨atzler, C.: The retrieval of temperature profiles with the ground based radiometer system ASMUWARA, IAP Research Report, No. 2003-13, Institute of Applied Physics, University of Bern, 2003.
Martin, L.: Microwave Transmission and Emission Measurements for Tropospheric Monitoring, Thesis of the Philosophisch-Naturwissenschaftliche Fakult¨at, Universit¨at Bern, Bern, Switzerland, 2003.
Martin, L., L¨udi, A., and M¨atzler, C.: Tropospheric monitoring with ASMUWARA, in: Sixth International Symposium on Tro-pospheric Profiling, edited by: Wandinger, U., Engelmann, R., and Schmieder, K., 38–40, 2003.
Martin, L., Schneebeli, M. and M¨atzler, C.: Tropospheric water and temperature retrieval for ASMUWARA, Meteorologische Zeitschrift, 15(1), 11–17, doi:10.1127/0941-2948/2006/0093, 2006b.
Martin, L., Schneebeli, M., and M¨atzler, C.: ASMUWARA, a ground-based radiometer system for tropospheric monotoring, Meteorologische Zeitschrift, 15(1), 11–17, doi:10.1127/0941-2948/2006/0093, 2006b.
M¨atzler, C.: Microwave sensors for measuring avalanche-critical snow parameters, in: Internat. Symp. on Avalanche Formation, Movement and Effects, Davos, Switzerland, 14–19 September 1986, edited by: Salm, B. and Gubler, H., IAHS Publ. No. 162, 149–160, 1987.
M¨atzler, C.: Ground-based observations of atmospheric radiation at 5, 10, 21, 35 and 94 Ghz, Radio Sci., 27, 403–415, 1992. M¨atzler, C.: Passive Microwave Signature Catalog (Volumes 1–3),
Reports of the Institute of Applied Physics, Bern, 1993, 1994. M¨atzler, C., Martin, L., Guerova, G., and Ingold, T.: Assessment
of integrated water vapour data at Bern from GPS, sun photome-try, microwave radiometry and radiosonde, in: 2nd Workshop of COST Action 716, Exploitation of ground-based GPS for Mete-orology, GFZ Potsdam, Germany, 28th–29th January, 2002. Morland, J.: TROWARA – Tropospheric Water Vapour Radiometer.
Radiometer review and new calibration model, Inst. Appl. Phys., University of Bern, Res. Report No. 2002-15, 2002.
Morland, J., Liniger, M., Kunz, H., Balin, I., Nyeki, S., M¨atzler, C., and K¨ampfer, N.: Comparison of GPS and ERA40 IWV in the Alpine region, including validation of GPS observa-tions at Jungfraujoch (3584 m), J. Geophys. Res., 111, D04102, doi:10.1029/2005JD006043, 2006.
Morland, J., M¨atzler, C.: Spatial interpolation of GPS integrated water vapour measurements made in a mountainous terrain, ac-cepted for publication, Meteorol. App., 2006.
Nyeki, S., Vuilleumier, L., Morland, J., Bokoye, A., Viatte, P., M¨atzler, C., and K¨ampfer, N.: A 10-year integrated atmospheric water vapor (IWV) record using precision filter radiometers (PFR) at two high-alpine sites, Geophys. Res. Lett., 32, L23803, doi:10.1029/2005GL024079, 2005.
Oltmans, S. J., V¨omel, H., Hofmann, D. J., Rosenlof, K. H., and Kley, D.: The increase in stratospheric water vapor from balloon-borne frostpoint hygrometer measurements at Washington D.C. and Boulder, Colorado, Geophys. Res. Lett., 27(21), 3453–3456, 2000.
Peter, R. and K¨ampfer, N.: Radiometric determination of water vapour and liquid water and its validation with other techniques, J. Geophys. Res., 97(D16), 18 173–18 183, doi:10.1029/92JD01717, 1992.
Peter, R., K¨unzi, K., and Hartmann, G.: Latitudinal survey of wa-ter vapor in the middle atmosphere using an airborne millimewa-ter wave sensor, Geophys. Res. Lett., 15, 1173–1176, 1988. Peter, R.: Stratospheric and mesospheric latitudinal water
va-por distributions obtained by an airborne millimeter-wave spectrometer, J. Geophys., Res., 103(D13), 16 275–16 290, doi:10.1029/98JD00968, 1998.
Picon, L., Roca, R., Serrar, S., Monge, J. L., and Desbois, M.: A new METEOSAT “water vapor” archive for climate studies, J. Geophys. Res., 108(D10), 4301, doi:10.1029/2002JD002640, 2003.
Rohrbach, A.: Wasserdampfmessungen mit GPS, Master’s the-sis, Philosophisch-Naturwissenschaftliche Fakult¨at, Universit¨at Bern, Bern, Switzerland, 1999.
Rosenkranz, P. W.: Water vapor microwave continuum absorption: A comparison of measurements and models. Radio Sci., 33, 4, 919–928, 1998, correction in Vol. 34, No. 4, p. 1025, 1999. Revercomb, H. E., Turner, D. D., Tobin, D. C., et al.: The ARM
program’s water vapor intensive observation periods: Overview, Initial Accomplishments, and Future Challenges, Bull. Am. Me-teorol. Soc., 84, 2, 217–236, 2003.
Ross, R. J. and Elliott, W. P.: Radiosonde-Based Northern Hemi-sphere Tropospheric Water Vapor Trends, J. Clim., 14, 1602– 1612, 2001.
Ruffieux, D. and Joss, J.: Influence of radiation on the temperature sensor mounted on the Swiss radiosonde, J. Atmos. Ocean. Tech., 20, 11, 1576–1582, 2003.
Min, Q.: Importance of Accurate Liquid Water Path for Estima-tion of Solar RadiaEstima-tion in Warm Boundary Layer Clouds: An Observational Study, J. Clim., 16, 2997–3009, 2003.
van Meijgaard, E. and Crewell, S.: Comparison of model pre-dicted liquid water path with ground-based measurements during CLIWA-NET, Atmos. Res., 75, 3, 201–226, 2005.
Vasic, V., Feist, D. G., M¨uller, S., and K¨ampfer, N.: An air-borne radiometer for stratospheric water vapor measurements at 183 GHz, IEEE Trans. Geosci. Remote Sens., 43, 7, 1563–1570, doi:10.1109/TGRS.2005.846860, 2005.
Vincent, L. A.: A Technique for the Identification of Inhomo-geneities in Canadian Temperature Series, J. Clim., 11, 1094– 1104, 1998.
Vinnikov, K. Y., Robock, A., Cavalieri, D. J., and Parkinson, C. L.: Analysis of seasonal cycles in climatic trends with application to satellite observations of sea ice extent, Geophys. Res. Lett., 29(9), 1310–1314, 2002.
Wang, J. H., Carlson, D. J., Parsons, D. B., Hock, T. F., Laurit-sen, D., Cole, H. L., Beierle, K., and Chamberlain, E.: Per-formance of operational radiosonde humidity sensors in di-rect comparison with a chilled mirror dew-point hygrometer and its climate implication, Geophys. Res. Lett., 30(16), 1860, doi:10.1029/2003GL016985, 2003.
Weatherhead, E. C., Reinsel, G. C., Tiao, G. C., Meng, X.-L., Choi, D., Cheang, W.-K., Keller, T., DeLuisi, J., Wuebbles, D. J., Kerr, J. B., Miller, A. J., Oltmans, S. J., and Frederick, J. E.: Factors affecting the detection of trends: Statistical considerations and applications to environmental data, J. Geophys. Res., 103(D14), 17 149–17 162, doi:10.1029/98JD00995, 1998.
Westwater, E. R.: Ground-based microwave remote sensing of me-teorological variables, in: Atmospheric Remote Sensing by Mi-crowave Radiometry, edited by: Janssen, M. A., John Wiley & Sons, Inc., 1993.