Publisher’s version / Version de l'éditeur:
Journal of the Acoustical Society of America, 34, 4, pp. 493-501, 1962-06-01
READ THESE TERMS AND CONDITIONS CAREFULLY BEFORE USING THIS WEBSITE. https://nrc-publications.canada.ca/eng/copyright
Vous avez des questions? Nous pouvons vous aider. Pour communiquer directement avec un auteur, consultez la
première page de la revue dans laquelle son article a été publié afin de trouver ses coordonnées. Si vous n’arrivez pas à les repérer, communiquez avec nous à [email protected].
Questions? Contact the NRC Publications Archive team at
[email protected]. If you wish to email the authors directly, please see the first page of the publication for their contact information.
NRC Publications Archive
Archives des publications du CNRC
This publication could be one of several versions: author’s original, accepted manuscript or the publisher’s version. / La version de cette publication peut être l’une des suivantes : la version prépublication de l’auteur, la version acceptée du manuscrit ou la version de l’éditeur.
Access and use of this website and the material on it are subject to the Terms and Conditions set forth at
Sound-insulation ratings and the new ASTM sound- transmission class
Northwood, T. D.
https://publications-cnrc.canada.ca/fra/droits
L’accès à ce site Web et l’utilisation de son contenu sont assujettis aux conditions présentées dans le site
LISEZ CES CONDITIONS ATTENTIVEMENT AVANT D’UTILISER CE SITE WEB.
NRC Publications Record / Notice d'Archives des publications de CNRC:
https://nrc-publications.canada.ca/eng/view/object/?id=8127f3bd-af5b-4594-a35e-6a67c7aae0df https://publications-cnrc.canada.ca/fra/voir/objet/?id=8127f3bd-af5b-4594-a35e-6a67c7aae0dfSer
TH1
N21r2
no.
160
c.2
BLDG
NATIONAL
RESEARCH
COUNCIL
C A N A D A
DIVISION O F BUILDING RESEARCH
SOUND
-
INSULATION RATINGS AND THE NEW ASTM
SOUND
-
TRANSMISSION CLASS
BY
T. D. NORTHWOOD
R E P R I N T E D F R O M
THE J O U R N A L O F THE ACOUSTICAL SOCIETY O F AMERICA
VOL, 34, N O . 4, APRIL 1962, P . 493
-
501.R E S E A R C H P A P E R NO. 160
O F THE
DIVISION O F BUILDING RESEARCH
OTTAWA
JUNE 1962
P R I C E 25 C E N T S
3 - - ' % A
-
-
This publication is being distributed by the Division of Building Resei~rch ~f the National Research Council as a contribution towaards better building in Canada. It should not be reproduced in w:hole or in part, without permissioi~ of the original publisher. The Division would be glad to be of assistance in obtaining such permission.
Publications of the Division of Building Research may be obtained by mailing the appropriate remitt>~unce, (a Bank, Express, or Post Office Money Order or a cheque made payable i ~ t par in Ottawa, to the Receiver General of Canada, credit Natiollal Research Council) to the National Research Council. Ottawa. Stamps are not acceptable.
A coupon system has been introduced to make payments for publications relatively simple. Coilpolls are available in denominations of 5, 25, and 50 cents, and may be obtained by making a remittance as indicated above. These coupons may be used for the pi~rchnse of all Nutionnl Hesearch Council pill>- licntions inclricling specifications of the C u ~ ~ d i i ~ n Government Specifications Board.
Reprinted frotn T r r e J o ~ . ~ r , \ r . 01: T ~ I E ACOUSTICAI. SOCIETY 01: AXIEIIICA, \'oI. 34, No, 4, 493-501, April, 1962
Copyright, 1962 by the Acouticnl Society of :\~nerica.
Printed in U. S. A.
A N A L ~ z ~ ~
Sound-Insulation Ratings and the New ASTM Sound-Transmission Class
T . D . NORTHWOOD
DiDision of Building Resea~cl~, Nalio?zal Research Co~cncil, Olla?oa, Ontario, Cnnclda
(Received Decen~ber 18, 1961)
A survey is niade of past and present systems for rating the sound-insulation value of building walls and floors. I t is observed that in most countries ratings based on "average" transnlission losses have bee11 replaced by systems that compare transnlission-loss characteristics with a standard contour. An esaliiple of this approach is the new sound-transmission class contained in ASTl'I E90-61T. This is discussed from various theoretical and practical viewpoints, and it is concluded that the sound-transmission class is a useful rating system for common architectural problems.
T
H E sound-insulation requirement for a partition depends on the occupancies i t separates; more explicitly, it depends on the magnitude and frecluellcy distribution of the noise produced on one side of the partition and the amount of intruding noise that will be tolerated on the other. I n rare instances, the char- acter of the noise may be predictable and constant, and the tolerance level of transmitted noise may be accu- rately specified. Then it may be possible to specify in a straightforward way the detailed transmission-loss requirements as a function of frequency. B u t more typical is the problem of designing a n apartment or office building, where the required sound insulation varies widely with the individual occupants and their activities of the moment. Here the architect and his client need a simple figure of merit that will help them provide enough sound insulation to satisfy most of the building occupants most of the time.I t is the purpose of this paper to examine the problem of providing such a figure of merit, and in particular to describe the recently developed Svztnd Tra~zsmissio~z Class, which appears in the revised standard ASTM E90-61T.l
T h e sound transmission class was designed prilllarily for assessing the sound-insulation value of ~valls and floors for use bet~ireen dwelling units in apartment buildings and similar structures. 1 t also has application in hotels, hospitals, scl~ools, and other situations where the requirements are similar in character, though not necessarily in degree, to those encouiltered between dwellings. For partitions between offices i t is usual to require only that transmitted speech be unintelligible. This suggests a n approach slightly different from the dwelling problem, b u t the sound transmission class is again found to be a useful rating system.
T h e new classification system is an intermediate stage between the physical measuremellt of sound- transmission loss and the specification of miilimum requirements for separating various occupancies. I t might be noted that similar criteria are used in Britain and several European countries for specifying miniinulll requirements for dnelling separations. I n Britain they
constitute a reco~nl?ze~zded standard b u t in most other cases they are mandatory provisions of building codes. Actual minimum requirements are beyond the scope of the present paper and of ASTM E90-61T. Nevertheless, it is hoped t h a t this discussion of the theoretical and practical bases of sound-insulation requirements will lead first to the general use of the sound transinissioil class as a rating system and ultimately to its use as the basis of minimum standards.
EMPIRICAL APPROACHES
For many years, both here and i n Europe, the commonly used rating was the arithmetic average of the transmissioll losses in decibels measured a t a specified series of test frequencies. On this continent the standard method of test, described i n ASTM E90-55 and its counterpart American Standard 224.19-1957, used the arithmetic average of the transmission losses measured a t the nine frequencies 125, 175, 250, 350, 500, 700, 1000, 2000, and 4000 cps. Two objections have becn raisecl to the use of such a n average as a figure of merit :
(1) i t gives equal weight to all test frequencies regr~rclless of their importance in sound-insulation problems
(although b y including the half-octaves belo~v 1000 cps the
U.
S. nine-frequency average gives extra weight tothe low-frequency range) ; (2) it gives equal ~veight to both high ant1 low transmission losses, a s if super- latively high values a t some frecluencies could com- pensa te for deficiencies a t other frequencies.
Attempts to meet the first objection have led to the iiltroductioll of several other "averages," obtained by altering the selection of frecluencies incluclecl in the average. There is sometimes good reason for concentrat- ing on a special frequency range but unfortunately it is rarely made clear, especially in trade literature, ~ilhen or why a nonstandard average is being employed. As one step in producing an orderly presentation of infor- mati011 A S T M E90-61T n o i ~ ~ requires that oilly the "average" reported be the nine-frequency average, ant1 that i t be so labeled.
T h e second objection is based on the premise that a partition is no better than its lowest transmissioil loss. I t led on this coiltinent to the development of the
ASTM E90-61T, "Tentative recornmended practice for l l
laboratory measurelilent of sound transnjission loss of energy average,"' obtained by averaging the trans- building ~17alls and floors" (American Society for Testing and
494 T . D . N O R T H W O O D
mission coefficients corresponding to the transmission losses ant1 then taking the decibel equivalent of the average transmission coefficient. Such an average is dominated by the lowest values of transmission loss.
.
Unfortunately, the lowest values are almost always a t the lowest test frequencies, which are usually the least inlportant in the evaluation of partition performance. Moreover, even in the laboratory it is difticult to make precise measurements of sound-transinissiol1 loss a t the lowest test frequencies; thus, the energy average is usually based on the least reliable measurements.Clearly, no simple average, or even a complicated one such as the cnergy average, can properly rate the performance of a partition unless it takes into account the variation of transmission loss with frequency. T h e usefulness of simple averages in the past may be attributed to the fact that the nlassive structures that predomiilated had rather simple transmission-loss curves, all rising in a similar way with frequency. But the present use of lightiveight structures has resulted in both lower and more irregular transmission-loss curves, and necessitates a criterion that is more closely related to actual performance recluirements.
Subjective Reactions and Standard Contours
I n a t least three countries, Holland, Sweden, and Britain, the dwelling separation requirement was in- vestigated directly by canvassing the tenants of apart- ment buildings and row dwelling^.^-^ Each of the surveys was conducted without knowledge of the others, and it is of interest to examine the points of agreement and disagreement among their conclusions.
T h e British and Dutch surveys showcd that noise from thc floor above constituted the greatest disturb- ance, apparently because of the special importance of impact sounds such as footsteps and children playing. T h e Swedish survey also showed thc importance of transmission through floors, but did not indicate that impact noise was as serious a problem as airborne sound. Nevertheless, current British and European standards, including the Swedish one, deal with both impact and airborne sound. 011this continent there is as vet no
standarcl test method for impact (although one is now being considered by ASTM Committee E-6). Hence this paper deals only ~ v i t h the airborne-sound problem, despite the evident importance of impact transmission. T h e Swedish sample included similar structures located on noisy thoroughfares a n d on quiet residential streets. As might be expected these showed an inverse relationship between disturbance from traffic and disturbance from adjacent dwellings; the more tenants
C. Bitter and P. Van Weeren. "Sound nuisance and sound insulation in bloclcs of dwellings I," Rept. No. 24, Research Institute for Public Health Engineering T.N.O. (1955).
0. Brandt and I. DalEn. Byggmiistaren 31, 145 (1952). P. G. Gray, A. Cartxvright, and P. H. Parkin, "Noise in three groups of flats with dilierent floor constructions," National Building Studies Research Paper No. 27, H.M.S.O. (1958).
were disturbed by traffic noise, the less they were disturbed by noise from their neighbors.
Correlation of tenant disturbance and airborne-sound insulation was in general very complex. For example, it is difficult to distinguish between reactions to airborne a n d impact sounds ; tenants dissatisfied with one aspect of their dwellings tend to express dissatisfaction with other aspects; a tenant's past experience with very inferior housing may cause him to comment favorably on a slightly less inadequate environment; and of course there is the complicating efiect of traffic noise, discussed in the foregoing. Nevertheless, both the British and the Swedish surveys showed a definite reduction in complaints for increased airborne-sound insulation. T h e Netherlands study, which involved seven different types of structure, yielded little corre- lation between tenant reactions a n d sound insulation.
T h e British survey included two main types of floor structure for which the transmission-loss characteristics were similar, with averages of 49 and 4 4 db.G I n t h e 49-db structures, 22% of the tenants con~plained about noise problems, and noise was about equivalent to other sources of complaint. I n the 44-db structures, 36% of the tenants complained about noise, and noise was the major complaint. These two transmission-loss character- istics, somewhat idealized, form the bases of the grade I
and grade I1 curves shown in Fig. 1. T h e y constitute recommended minimum values for p a r t y walls a n d floors in certain classes of a ~ a r t m e n t s . ~
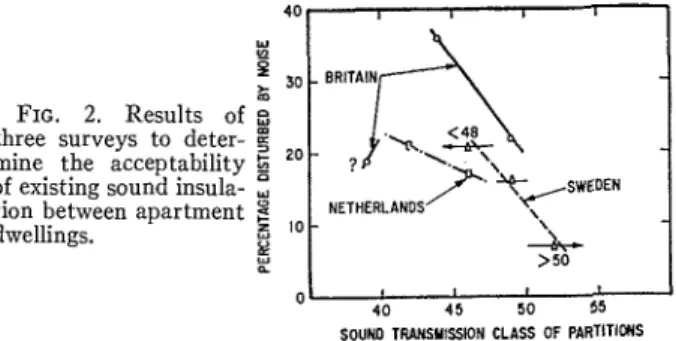
T h e sound-insulation d a t a from the three surveys a r e shown in Fig. 2, in which the abscissa is the ASTM sound-transmission class. which is described later: for the moment, i t can be taken as roughly equivalent to average transmission loss. The results serve mainly t o indicate the order of sound insulation required for acceptable divelling separation. T h e o n e anomalous point in the British results was for a new block of apart- ments whose tenants were mostly refugees from a con- demned-housing area; they are therefore not a repre- sentative sample. Some information was gleaned from the Dutch results by discarding two structural types for which impact insulation was exceptionally low, a n d by separating the rest into two groups with high a n d low insulation. Despite these cautionary remarks, t h e
GRADE I
GRADE II FIG. 1. British recom-
mended minimum require- ments for airborne-sound insulation between apart-
+ 30 ment dwellings. (A sound
transmission class contour is shown for comparison.)
'
20 100 400 1000 4000FREQUENCY, CYCLES/SEC
The standard European average is based on measurements a t third-octave intervals from 100 to 3200 cps.
Britislz Sfalzdard Code of Pracfice, Chap. I11 : "Sound insulation and noise reduction," British Standards Institution (1960).
S O U N D - I N S U L A T I O N R A T I N G S 495
FIG. 2. Results of three surveys to deter- mine the acceptability of existing sound insula- tion between apartment dwellings. NETHERLANDS \ l o -
A-
> 5 0 4 0 4 5 5 0 55 SOUHO T ~ Y I S S I O N CLASS OF PARTITIOHSresults suggest that a sound transmission class 45 is borderline for reasonably satisfactory sound insulation, and that a sound transmission class 55 represents about the maximum value that is worth attempting for ordinary housing.
A similar set of rating curves (Fig. 3) was incor- porated in the German standard D I N 52211.8 The same shape was subsequently adopted also by the Scandinavian countries as the basis of sound-insulation requirements for row-dwelling and apartment building^.^^'^ The D I N curves, also based on the characteristics of actual walls, differ from the British curves in requiring slightly greater transmission loss in the middle frequencies (300 to 1000 cps) and slightly less a t lower frequencies. I t is to be noted that the standard requires a slightly higher value (2 db) for a laboratory test than for a field test. The difference is an allowance mainly for flanking transmission.
The use of a standard curve rather than a simple arithmetic average is based on the hypothesis that the transmission-loss requirement varies in a certain way with frequency and must therefore be specified for each frequency band. The direct evidence concerning the contribution of each band is rather sketchy although there are theoretical reasons for supporting this view. I n a survey of occupants of row dwellings, the British were able to compare a 9-in. solid-brick wall with an 11-in. cavity wall; they found little superiority for the latter despite the fact that its average transmission loss was 5 db better. I t was coilcluded that the lower and middle frequencies, for which there was little difference between the walls, were more critical than the high frequencies for which the superior transmission loss of the 11-in. wall is most evident. The transmission loss is presumably high enough at high frequencies in either case. Both walls just meet the British grade I require- ment.
More extensive information is provided by the experiments of Rademacher,ll who simulated wall-
s "Bauak;stiches Prufungen Schalldammzahl and Normtritt- schallpegel, Deutschen Normenausschusses D I N 52211 (1953).
17. Ingerslev and J. Kristensen, "Lydisolation I Boligbyggeri" (Sound insulation of dwellings) with English summary, Statensbyggeforskningsinstitut, Rapport 39, Kfibenhavn (1960).
lo "Anvisningar till byggnadsstadgan," BABS Stockholm
( i ~ f ; n l
,
- -
- -
,.
l1 H. J. Rademacher, Acustica 5,19 (1955).
transmission characteristics electrically and had 20 subjects determine the subjective reduction i n loudness provided by various transmission characteristics. For noise sources he used samples of music and speech (garbled to eliminate meaning) and several spectra of filtered white noise. His principal noise samples, includ- ing speech, music, and one sample of white noise, each had a broad maximum in the frequency range 200 to 800 cps.
Starting with the German D I N curve, he investigated the effect of decreasing the attenuation by 10 db in one octave band, as compared to a uniform attenuation over five octaves. He found that the 10-db decrease in one octave was equivalent to 1 to 4 db over five octaves, the greatest effect being, as might be expected, in the range of highest source power. I n another series of tests, he compared four attenuation curves of different shapes, each corresponding to an average transmission loss of 48 db. One characteristic corresponded to the D I N curve, the second increased a t 3 db per octave, the third increased a t 6 db per octave, and the fourth had a plateau characteristic extending to 800 cycles and then a sharp increase in attenuation. The first three were rated subjectively a t about 48 db (when tested with speech or music), but the fourth was rated a t only 37 db. This result might be anticipated since only the fourth ~vall differed substantially in the range of maximum source power. Rademacher dismissed this fourth characteristic as physically unreal and concluded that a simple arithmetic average is adequate for rating most structures. Actually it is similar to many lightweight partitions, and it is to protect against transmission curves of this type that the standard curves were introducetl.
Although the British and European standards em- phasize the importance of the shape of the transmission- loss curve, they compromise somewhat in their inter- pretation of actual transmission characteristics. Gener- ally, an average deficiency of 1 db (in some cases 2 db) is allowed relative to the prescribed curve. In both cases, the deficiency might conceivably take the form of a large deviation in a limited frequeilcy band. I t is commenteds that this averaging arrangement is adopted in the absence of sufficient information about the contribution of individual narrow bands. I n any case,
FIELD TESTS-FLOORS
FIG. 3. German minimum requirements for airborne- sound insulation between apartment dwellings. (A 4o
sound-transmission class E
contour is shown for com- parison.)
496 T . D . N O R T H W O O D
FIG. 4. Half-octave-band
vacuum cleaner, Curve C- normal speech (levels ex- ceeded by 1% of speech peaks), Curve D-radio,
television (peak levels, s ~ e e c h and music), Curve
[
,,
,, ,
,,
, ,, ,
I
E-assumed "s'tandard-j0 12s 250 5 0 0 1 0 0 0 2 0 0 0 4 0 0 0 household noise."
MIO-UND FREQUENCY, CICLES/SEC
since excesses above the curve are disregarded, the allowable deficieilcy is actually rather limited.
Summarizing field experience and experimental evi- dence to date,-the coilseilsus is that a simple arithmetic average is not adequate, especially for rating lightweight structures which frequently have serious deficiencies in the most critical frequency range. Several countries are now using standard transmission-loss contours to represent minimum requirements for d\velling separa- tions. Ideally, the transmission loss of a given partition should a t no frequency fall below the standard contour; in practice, a limited amount of trading between fre- quency bands is permitted, although the consequeilces of this procedure are not yet fully understood.
THEORETICAL CONSIDERATIONS
The British and European standards were developed largely by informed interpretation of the comments of occupants of actual buildings. I t is of interest to examine also various theoretical approaches, utilizing informa- tion on typical noises and various subjective criteria relating to loudness, noise, or annoyance. These provide some insight into the importance of various frequency bands and assist in selecting an optimum shape of transmission-loss characteristic.
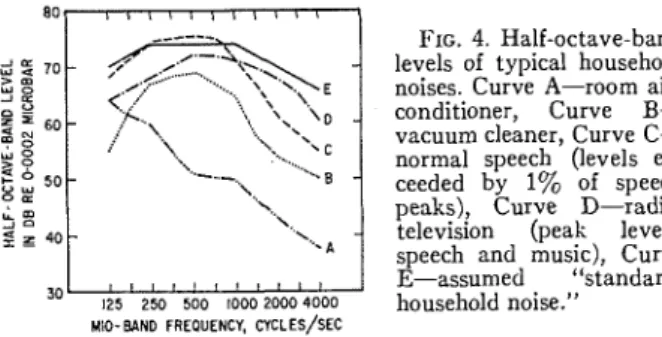
Figure 4 shows half-octave band spectra for a few typical domestic noises. The trend in domestic appli- ances is toward control of the high-frequency compo- nents of noise. so that low- and medium-frequency componeilts predominate in the residual noise. Speech, radio, and television noises are broadly peaked in the middle-frequency range. Speech intelligibility, as dis- tinct from power, involves a slightly higher frequency range extending well beyond 4000 cycles, but this is irrelevant for dwelling separation since the transmission loss should be substant&lly greater than the amount required merely to reduce intelligibility. Musical instru- ments and high-fidelity record players will extend the range, especially toward the lower frequencies. Noting from the surievs the s ~ e c i a l im~ortance of radio, television, and speech noises, it appears that one might consider a "standard household noise" spectrum flat from 250 to 1000 cps and diminishing by 4 to 6 db per octave below and above this frequency (Fig. 4). I t should be noted that the curves of Fig. 4 are derived from several sources and are not strictly comparable;
they are intended to illustrate spectrum shapes, rather than absolute levels. Several important noises, partic- ularly airborne noise resulting from footsteps and doors slamming, have been omitted for lack of information.
I t is assumed that the optimum shape of a rating curve will not vary much with level in the range of application of the rating system, and that a family of parallel curves can be adopted. This is analogous to assuming that equal loudness contours are approxi- mately parallel in the range 20 to 60 phons.
On the listening side, the most obvious procedure is to consider the loudness of the transmitted noise. The work of Stevens,'? Quietzsch,13 and Beranek'" provides a good basis for such a criterion, although their results are more directly applicable to office and industrial problems than to dwelling separation. Stevens devised a method of calculating the loudness of comples sounds that, particularly in its latest form, agrees well with the subjective ratings obtained by Quietzsch for a wide variety of comples noises. Beranek used these data, supplemented by office-noise surveys, to develop the well-known noise criterion (KC) curves, which take into account both loudness and speech-interference levels approximately as they affect the acceptability of office noise. These criteria are used in later sections.
Assuming that the subjective reaction to noise is related to loudness, it is appropriate to determine the transmission-loss characteristic that reduces each band of "standard household noise" (Fig. 4) to a particular equal-loudness contour. For purposes of this paper the 0.5 sone contour, corresponding to a loudness level of 46 phons, is used. (Judging by tenant surveys, this is probably of the right order.) The transmission-loss characteristic that accomplishes this is shown as curve (a) in Fig. 5 (solid circles). This is the most efficient partition for achieving this transmitted loudness since all bands of transmitted sound are reduced to the point where they are equally important in determining . .
over-all loidness.
Kryterlj recently devised a slightly different series of "equal noisiness" curves, leading to "perceived noise levels" instead of loudness levels. The calculation is essentially the same as Stevens' except that Kryter provides greater weighting for high-pitched components of noise. Kryter claims for his curves only that they correlate better than loudness with subjective judg- ments of acceptability for certain high-pitched noises such as are produced by jet aircraft. I t appears that the high-frequency components may be especially im- portant when a noise is intrinsically obnoxious or alarming. Reviewing the most troublesome sources of dwelling noises, it seems likely that some of them fall into the intrinsically obnoxious category, and it might therefore be more plausible to use Kryter's criterion.
l2 S. S. Stevens, J. Acoust. Soc. Am. 33, 1577 (1961).
l3 G. Quietzsch. Acustica 5, 49 (1955).
l4 L. L. Beranek, J. Acoust. Soc. Am. 28, 833 (1956). l6 R . D. Kryter, J. Acoust. Soc. Am. 31, 1415 (1959).
S O U N D - I N S U L A T I O N R A T I N G S 497
FIG. 5. Theoretically derived transmission-loss curves. Trans- mission loss required to reduce standard-household noise to: (a) 0.5 sone equal-loudness contour (solid circles), (b) 0.5 Noy equal- noisiness contour (open circles), (c) NC-25 contour (triangles). The solid line is the contour of sound transmission class 48.
Proceeding as before, one arrives a t the required trans- mission loss defined by curve (b) of Fig. 5 (open circles).
The transmitted loudness or perceived noise level, per se, is not necessarily a good index of satisfactory sound insulation. More important is the degree to which the transmitted sound is masked by ambient noise existing on the listening side of a partition. For com- plete masking, a good approximation for complex noises is to require that the transmitted noise be no greater than this ambient level in any half-octave band.lG Curves (a) and (b) could, on this basis, be regarded as possible spectra of ambient noise. Since Beranek's noise criteria are frequently used for similar purposes, a third transmission-loss characteristic, which reduces standard household noise to NC-25 contour, has also been shown as curve (c) in Fig. 5 (triangles).
Comparing these curves with the D I N curve, it is seen that the latter is reasonably similar in shape. Following these considerations, and with an eye to international standardization, it was decided to adopt the shape of the D I N curves as the basis for the ASTM sound transmission class contours (Fig. 3). Plotted on conventional semilog paper the STC contours consist of a horizontal segment from 1400 to 4000 cps, a t a level corresponding to the sound transmission class ; a middle segment that decreases 6 db from 1400 to 350 cps; and a low-frequency segment that decreases 14 db from 350 to 125 cps.
Equating the over-all loudnesses of transmitted noise and ambient noise would not result in complete masking if the loudness level of the transmitted sound were particularly high in a narrow band. But the distinction between the equal-loudness and masking criteria is not as great as might be anticipated, since- the over-all loudness level of a complex sound depends markedly on the level in the loudest band. For example in Stevens' calculation for half-octave bands the loudest band is l 8 H. Fletcher, M. R. French and J. C. Steinberg, E. Zwicker,
and others have demonsrated that calculations of loudness, mask- ing, articulation index, and similar quantities involving perception of complex sounds are most precise when "critical bands" are used. Nevertheless, i t is common practice to use data in octave, half- octave, or one-third octave bands. The approximation is valid if the spectra are reasonably smooth and continuous.
weighted five times as much as the other bands. On either basis, it appears reasonably precise to require that a given transmission-loss requirement be met in each band, rather than just on the average.
For dwelling separation, however, where noise sources are highly variable, another approach is to consider the probability that noise will occur in a given frequency band. Both noisy and quiet conditions may fluctuate in the manner indicated in Fig. 4. A review of the spectra of the more troublesome noises suggests that high noise levels are more probable in the mid-frequency range than a t high or low frequencies ; hence this region should be given special attention. For this reason, in applying the proposed new rating, the following procedure is used: there shall be no deficiencies below the middle segment of the STC curve, but deficiencies averaging 1 db are allowed below the outer segments of the curve.
OFFICE PARTITIONS AND SPEECH PRIVACY
I n the foregoing section, the sound transmission class was discussed primarily from the viewpoint of dwelling separation. I t is of interest also to consider its applica- bility to the problem of office separation. This is the second large-scale problem confronting the designer, and differs in several ways from the dwelling separation problem.
The primary requirement for sound insulation be- tween offices is to prevent the transmission of intelligible speech. This is so both for the speaker, who may wish to speak privately, and for the listener, since the dis- tracting quality of speech noise is intensified when it begins to be intelligible. The most comprehensive recent study of factors affecting speech intelligibility was that of French and Steinberg," who developed a straight- forward method of calculating speech intelligibility from the properties of each link in a communication system. They first showed that speech intelligibility can be expressed rather precisely in terms of the available dynamic range in each of 20 equally important "critical" frequency bands. A maximum range of about 30 db
(above either threshold of audibility or masking level set by noise) is required in each critical band to get the full contribution of the band. To a good approximation the contributions of the individual bands are inde- pendent of each other, although there are secondary effects due to masking by adjacent bands. T h e contribu- tion of each critical band is expressed in terms of an "articulation index," and the average articulation index for the twenty critical bands provides a quantity that is related in a known way to the other common measures of speech intelligibility.
Beranek, in his earlier approach to the problem of specifying minimum noise requirements within spaces such as offices and conference rooms, concluded that ease of speech communication provided a good criterion. l7 M. R. French and J. C. Steinberg, J. Acoust. Soc. Am. 19,90
498 T . D . N O R T H W O O D
Hence, he used the work of French and Steinberg to develop the criteria known as speech-interference levels,18 obtained by considering speech levels relative to noise in the three octaves most important to intelligi- bility (300 to 2400 cps). Later, however, he found that acceptability of office noise is more closely related to loudness. This led to the NC curves mentioned earlier.14 The speech-privacy problem is the inverse of that considered by French and Steinberg and by Beranek, being concerned with the marginal condition in which speech is not quite intelligible. In this region, the simple linear approximation that works so well when intelligi- bility is high is no longer strictly applicable. Neverthe- less, a linear approximation has been used successfully in office-separation problems by HardylQnd more completely by Cavanaugh et ~ 1The latter is probably . ~ ~ the most useful method available when the problem is well defined : for example, when the room configuration is known and the ambient noise level known or specified. For low-intelligibility conditions, the effect of their linear approximation is to obtain articulation index values that are somewhat larger than those obtained by the French and Steinberg method. Since they deduce from office surveys a maximum acceptable value of this index, calculated by the same method, the discrepancy is perhaps safely canceled out again; but i t should be noted that their results are not comparable with those presented below.
For the usual office-building design problem, a rating that ensures a reasonable probability of general satisfac- tion is again necessary. The uses and limitations of the sound-transmission class for this purpose are considered below, with the help of the French and Steinberg study and their nonlinear treatment for conditions of low intelligibility. Following Beranek's example,18 the critical bands of French and Steinberg are replaced by bands of equal-frequency ratio, in this case by half- octave bands. The conversion is accomplished by weighting each half-octave by a factor proportional to the number of critical bands it contains.16 The weighting factors are derived from composite studies of both male
TABLE I. Band-articulation index for small differences between the level exceeded by 1% of speech peaks and the ambient level. (Adapted from reference 17.)
Level Level
diff 30Wa diff 30W
30W rather than W is tabulated for convenience in calculations.
and female voices. The idealized speech spectrum of French and Steinberg (Fig. 4) is assumed to exist in a source room separated from a listening rooin by a partition having a transmission loss defined by an STC contour. The transmitted-speech level in the listening room will depend on the room absorptions and the partition area; room absorptions of 100 sabins each and a partition area of 100 sq f t will be assumed. I t will further be assumed that the ambient level in the listening room is defined by an NC curve. Then the signal-to-noise ratio in each band is dependent on the sum of the STC and N C values (assuming that the N C curves of interest are all parallel to NC-30). The articu- lation index in each band is determined by the speech level (exceeded by 1% of peaks) relative to noise level ; for level differences less than 12 db, the band-articula- tion index is shown in Table I, and for level differences greater than 12 db, the value is W = (E-6)/30, where E
is the level difference. This procedure applies when the ambient level is moderately above the threshold of audibility, but not so high that nonlinear effects become significant.
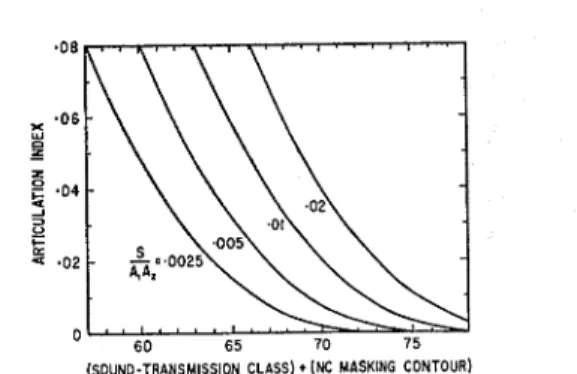
The relationship between articulation index and the sum of STC and NC numbers is shown in Fig. 6. I t is seen that for an articulation index of 0.03 and for S/(AlA2)=0.01, STC plus NC should equal 68. For example, assuming an ambient level corresponding to NC-35, the transmission loss should then be equal to or greater than STC-33.
Now, consider the variables affecting this result. Differences between individual speakers may affect the speech level by up to k 10 db ; differences in voice usage between a small office and a large conference room might introduce a similar change of k 1 0 db, although the two effects are probably not cumulative (i.e., to some extent a loud talker is one who habitually declaims). Differ- ences in room absorption and partition size from the assumed values will affect the transmitted level by changing the factor 10 log[S/(AlA2)], but, in any case, this factor, derived from reverberant-room theory, is a crude approximation in modern offices with absorbent ceilings.
(SOUND-TRANSMISSION CLASS) + INC MASKING CONTOUR)
FIG. 6. Combined effect of idealized partition (conforming to a
l 8 L. L. Beranek, Proc. Inst. Radio Engrs. 35, 881 (1947). given sound transmission class contour) and a given ambient-noise l9 H. C. Hardy and J. E. Ancell, Noise Control 4, 9 (1958). level (conforming to modified NC contour) on articulation index
20 W. J. Cavanaugh, W. R. Farrell, P. W. Hirtle, B. G. Watters, of transmitted speech. (S-Area of partition; A1 and A 2 are
S O U N D - I N S U L A T I O N R A T I N G S TABLE 11. Analysis of four walls.
Equivalent sound transmission class "Averages"
Test 1 Test 2 Test 3
Sound Equal masking Equal
transmission Equal by ar?bient artic. 9-Freq. 11-Freq.
Wall class loudness noise index arithmetic arithmetic Energy
Deviations of the ambient-noise spectrum from the assumed NC-curve will also affect the result. I n the calculation leading to Fig. 6 it was found that the articulation index depends on the bands from 350 to 1000 cycles, with a lesser contributioil from the 250- and 1400-cycle bands; hence the NC-curve should be matched to the noise in this range unless the noise is concentrated in other bands.
Fin.nlly, there is the error introduced by the method of matching a transmission-loss curve to the STC contours. Typically, an actual curve will fall on the STC curve a t one or two frequencies in the middle range and be above at the other 3 or 4 frequencies. Conse- quently, a partition with a sharp mid-frequency dip will provide a lower articulation index than its STC rating would indicate. I n a few cases calculated for actual partitions the standard matching procedure was too conservative by 0 to 6 db. This seems small enough for a general rating of this type in view of the other vari- ables in the calculation. Moreover, i t is suspected that although speech intelligibility is a primary consideration in office separation, loudness is probably a secondary but significant one. This is illustrated, for example, by experiments of Cavanaugh et al.," who used narrotv- band transmission in a study similar to those of Rademacher, but with speech privacy as a criterion. I t was found that a narrow-transmission band in the region of maximum speech power had an annoying effect out of proportion to the intelligibility it carried.
The average error due to matching curves can be minimized by relaxing the requirement slightly; it is therefore suggested that STC plus N C values should total 66 for room conditions corresponding to S/(AlAz)
FIG. 7. Transmission losses of four typical walls. Curve A-3 in. concrete wall, Curve B-2x4 in. stud wall (Reference 20, Fig. 16), Curves C and D-
Office partitions.
lo
FREQUENCY. CYCLES/SEC
=0.01. More-precise values can be determined for other values of S/(AlA2) by referring to the appropriate curves of Fig. 6.
RATINGS O F ACTUAL WALLS
To illustrate the use of the ratings, a detailed analysis is made of the performance of the partitions whose transmission characteristics are shown in Fig.
7.
Wall A is a solid concrete wall 3 in. thick. The coincidence frequency for this wall is below the test range and it therefore has a smooth, steeply rising characteristic. Wall B is a 2- by 4-in. stud and plaster wall. Such walls have a characteristic high-frequency dip and a low- frequency dip that varies in detail from sample to sample; this particular curve was taken from reference 20, Fig. 16. Walls C and D are two office partitions that have pronounced deficiencies in the middle range.The sound-transmission class, determined as pre- scribed in ASTM E90-61T, is given in the second column of Table 11. The reliability of the class rating was tested in three ways described in the following. Since the standard test frequencies form a half-octave series, the analysis was made on a half-octave basis throughout. A sample set of calculations is given in Appendix A.
Test
1Loudness levels were calculated using the method (Mark VI) given by Stevens12 for the fraction of standard-household noise (Fig. 3) transmitted by each wall. Similar calculations were made for a range of sound-transmission class contours in order to obtain the curve of Fig. 8. From this i t was possible to determine
FIG. 8. Loudness levels of standard- household noise trans- mitted by partitions conforming to STC contours.
I I I I I
20 30 40 50 60 7 0
500 T . D . N O R T H W O O D
the STC contour that would transmit the same loudness as each wall. This "equivalent sound-transmission class" is given in the third column of Table 11. This is a test of the system on the assumption that the absolute loudness of transmitted sound is an index of wall performance. (A similar calculation, using perceived- noise levels instead of loudness levels, produced almost identical results.)
T e s t 2
A better criterion is to require that transmitted noise be low enough to be masked by ambient noise. This condition would be approximately attained if peak levels of transmitted noise were not greater than the ambient level in any half-octave band.16 Assuming an NC contour of ambient noise (modified for half-octaves) the NC curve that just-masked transmitted noise was determined for each wall. Then the STC contour just masked by the same NC curve was also determined. This is given in the fourth column of Table 11.
Test 3
Articulation indices were calculated for each wall, on the assumption that ambient noise corresponding to an appropriate NC curve was present. (The NC curve was chosen so that the STC rating of the wall plus the NC value totalled 66, corresponding to the speech-privacy requirement discussed earlier, but the exact criterion used is not important in the calculation.) The actual articulation index obtained was used to deduce from Fig. 6 the equivalent sound-transmission class for speech, i.e., an actual STC contour that would combine with the assumed NC curve to give the observed articulation index.
The three equivalent sound-transmission classes, based on the three criteria described above, are shown in Table 11. Since the masking criterion (test 2) de- pends on the highest band of noise, relative to the NC curves, it agrees closely with the actual sound-trans- mission class, which is determined in a similar way. This is the safest criterion, since it is a measure of the proba- bility that the transmitted noise will be masked by ambient noise and thus unnoticed. As might be ex- pected the other two, since they tend to average out peaks, fall slightly above the sound-transmission classes found bv the standard procedure. But, apart from a slight shift in scale, the sound-transm-ission class accurately rates partitions in comparison mith any of the three tests considered here.
For comparison, three "averages," the 9-frequency average, an 11-frequency average (including data for 1400 and 2800 cps), and the energy average are shown in the last three columns. These serve to illustrate the inconsistencies that can arise with simple averages. All three show considerable scatter relative to the sound- transmission class or to any of the three tests; none of the three gives the proper ranking for walls B and C ;
the energy average, unduly influenced by low-frequency transmission losses, grossly under-rates walls A and B.
SUMMARY
Evidence has been presented showing that a simple average is an unreliable index of the sound-insulation value of a partition. I t is noted that in many other countries the simple average has been replaced by a standard contour that defines transmission loss as a function of frequency. The significance of such contours has been examined theoretically from the viewpoint of dwelling and office separation, and it is shown that the sound-transmission class now incorporated in ASTM E90-61T provides a simple and accurate rating system.
ACKNOWLEDGMENTS
The author is grateful for considerable help from the other members of the Writing Group responsible for ASTM E90-61T, and especially for comments and criticisms received from Ralph Huntley, William Jack, Thomas Mariner, T . J. Schultz, R. W. Young, and Bill Watters. This paper is a contribution from the Division of Building Research of the National Research Council, Canada, and is published mith the approval of the Director of the Division.
APPENDIX A. SAMPLE CALCULATIONS OF WALL PERFORMANCE
The calculations made in preparing Table I1 mere quite straightforward, but i t might stimulate additional studies if the details are set down here. Actual calcula- tions are given in Table 111.
Transmitted-Noise Levels
The standard household noise (Fig. 4) is taken to be the level in a source room containing 100 sabins of absorption. The receiving-room correction is zero for receiving-room absorption of 100 sabins and a trans- mitting-wall area of 100 sq ft. Hence the receiving-room level is obtained simply by subtracting the wall trans- mission losses from the band levels of the standard noise. This is the first step in tests 1 and 2. A similar procedure is used in test 3, after first adapting French and Steinberg's idealized-speech curve (level exceeded by 1% of speech peaks) for half-octave band levels in the source room.
Loudness Calculations
Stevens' procedure was followed exactly, using the formula S1=S,,+0.2(ZSi-S,,), where S is total loud- ness in sones, S, is the loudness in the loudest half- octave band and (ZSi-S,,) is the sum of the loudnesses in the other bands.
Masking by Ambient Noise
An NC curve was found that just equaled or exceeded the transmitted standard noise in each half-octave
S O U N D - I N S U L A T I O N R A T I N G S 501
TABLE 111. Sample calculations for wall A.
Half-octave band (center frequency)
125 175 250 350 500 700 1000 1400 2000 2800 4000
1. Standard household noise
(Ll=Ln+TL) 70 72 74 74 74 74 74 72 70 68 66
2. TL, wall A 33 35 39 41 44 48 52 55 58 61 64
3. Transmitted-noise level 37 37 35 33 30 26 22 17 12 7 2
Test 1-Loudness
4. Loudness index 0.23 0.40 0.45 0.50 0.50 0.37 0.26 0.12 0.05 0.02 0.00 5. Total loudness, St=0.50+ 0.2(2.40)=0.98. Loudness level=@ phons.
Equivalent sound-transmission class=51 (from Fig. 8). Test 2-Masking
6. Modified NC-28"
Test 3-Speech intelligibility 7. Speech noise: LI=Lz+TL
8. Receiving-room level (subtract line 2) 9. Subtract ambient level
NC-19' (=66-STC 47) 10. 30W (per critical band) 11. Band-weighting factor (10
times no. of critical bands per half-octave)
12. 6000 A=165. A=0.028
44 40 37 33 31 28 27 25 24 23 22
(This just exceeds transmitted noise in all bands.) Equivalent sound-transmission class= 77 - 28 = 49.
68 71 74 75 75 75 71 67 61 58 55
(Level exceeded by
ly0
of peaks)...
35 36 35 34 31 27 19 12 2
...
0 0 4 10 13 16 20
...
26...
32...
33 26.
, ,...
12 44 57 48 4...
From Fig. 6, STC+NC=69; hence, equivalent STC=50. S C curves a r e modified for 4 octaves a n d made parallel t o NC-30.
band. This was taken to be the ambient level in the Then the masking condition is expressed simply by the receiving-room that would just mask the transmitted formula STC+NC=77; for example, in the sample noise. The equivalent sound transmission class is the calculation of Table I11 the standard household noise STC contour that attenuates the standard noise suffi- attenuated by STC-49 is just masked by NC-28. ciently for it to be just masked by the same NC con-
tour. This calculation is facilitated by the fact that both Articulation Index
STC and modified NC contours are families of parallel The method outliiled in an earlier section is illustrated curves (the latter are taken to be parallel to NC-30). in Table 111, lines 7 to 12.