Application of the single cell genomics in deciphering tumor
heterogeneity and its role in tumor progression and drug
resistance
by
Nemanja Marjanovic
M.S. Molecular biology and genetics
Belgrade University, 2015
SUBMITTED TO THE GRADUATE PROGRAM IN COMPUTATIONAL AND SYSTEMS BIOLOGY PROGRAM
IN PARTIAL FULFILLMENT OF THE REQUIREMENTS FOR THE DEGREE OF DOCTOR OF PHILOSOPHY
AT THE
MASSACHUSETTS INSTITUTE OF TECHNOLOGY FEBRUARY 2021
© Nemanja Despot Marjanovic . All rights reserved
Signature of the author………. Nemanja Marjanovic Graduate Program in Computational and Systems Biology Certified by………... Aviv Regev, Professor of Biology, Chair of faculty, Broad Institute Certified by………... Tyler Jacks, Professor of Biology, Koch Institute Accepted by……….. Christopher Burge Director, Computational and Systems Biology Graduate Program
Application of the single cell genomics in deciphering tumor heterogeneity and its role in tumor progression and drug resistance
by
Nemanja Marjanovic
SUBMITTED TO THE GRADUATE PROGRAM IN COMPUTATIONAL AND SYSTEMS BIOLOGY PROGRAM
IN PARTIAL FULFILLMENT OF THE REQUIREMENTS FOR THE DEGREE OF DOCTOR OF PHILOSOPHY
Abstract
Tumor progression, from the single mutated cell to the advanced stages of cancer, represents an evolutionary process. During tumor progression, cancer cells acquire new genetic mutations, becoming more heterogeneous, leading to tumor progression and resistance to therapy. However, clear genetic drivers of progression, metastasis, and therapeutic resistance are identified in only a subset of tumors, pointing to non-genetic contributors to cancer progression. Also, somatic evolution in cancer is occurring at the level of the single cell. Therefore, the application of the single cell genomic method is crucial for deciphering phenotypic heterogeneity. Here, we profiled single cell transcriptomes from genetically engineered mouse lung tumors at seven stages spanning tumor progression from atypical adenomatous hyperplasia to lung adenocarcinoma. The diversity of transcriptional states spanned by tumor cells increased over time and was reproducible across tumors and mice, but was not explained by genomic copy number variation. Cancer cells progressively
adopted alternate lineage identities, computationally predicted to be mediated through a common transitional, high-plasticity cell state (HPCS). HPCS cells prospectively isolated from mouse tumors had robust potential for phenotypic switching and tumor formation and were more chemoresistant in mice. Our study reveals transitions that connect cell states across tumor evolution and motivates therapeutic targeting of the HPCS.
Acknowledgments
I would like to use this opportunity to thank many people that have helped me tremendously on this journey:
• My parents, Radmila and Zoran Marjanovic, who have always been extremely supportive and encouraging
• My mentors, Aviv Regev and Tyler Jacks, who gave me direction, support, and freedom to explore scientific areas of interest
• My collaborator, mentor, great friend and “big brother” Tuomas Tammela
• My collaborators Matan Hofree and Jason Chan who helped me tremendously in chasing the cancer plasticity
• My graduate program administrator Jacqueline Blair-Carota who has been the support system throughout my PhD
• My committee members Mike Hemann and Rick Young
• Regev and Jacks lab members, who were helpful on an everyday basis, and great support system
Table of Content
Tittle 1
Abstract 2 Acknowledgments 4 Table of Content 5
Scientific journey and thesis preview 6 Thesis Outline 9 Chapter 1- Introduction 11
Lung Cancer 11
Mouse models for studying cancer 18
Genetic heterogeneity and clonal progression 20
Tumor microenvironment (TME) role in tumor heterogeneity 22
Cancer Stem Cell (CSC) hypothesis 23
Phenotypic plasticity 26
Consequences of tumor heterogeneity 27
RNA sequencing 29
Single Cell Genomics – Overview 30
Single Cell Genomics – Development 31
Single cell RNA-seq computational methods 32
References 40
Chapter 2 - Emergence of a high-plasticity cell state during lung cancer evolution 44 Summary 44 Introduction 45 Results 48 Discussion 65 Methods 74 References 102 Figures 110 Chapter 3 146 Summary 146
Discussion and Future directions 147
Scientific journey and thesis preview
I have completed my undergrad studies at Belgrade University in the Department of Biology. In. my undergrad, I have study molecular biology and experimental physiology. For my master's degree, I have been enrolled in the Experimental biomedical master program. During my undergrad studies, I got interested in cancer research. I have spent three summers doing internships abroad and getting acquainted with cancer research. My scientific journey started in the Cathrin Brisken lab at EPFL in Lausanne. In Brisken's lab, I have studied breast cancer and the role of WNT signaling in cancer progression and metastasis. Summer after that, I have spent in Cambridge, UK, where I have been working with Rebecca Fitzgerald. My project was involved in finding biomarkers for the early detection of the Barretss' Esophagus. After that summer, I have spent the summer at UNIL in Lausanne in Paulo Dotto lab working on skin cancer. My primary goal was to identify early benign lesions and what does fuels them in skin cancer.
One of the main reasons I got interested in cancer research was that cancer was such a deadly disease. When I start more reading about it, I came across the information that 90% of cancer patients die because of cancer metastasis. I got interested in further understanding of cancer metastasis. Robert Weinberg's lab was at the front of the cancer metastasis research. For my master thesis, I have contacted professor Weinberg to join his lab and do a research project. Even though I came only for four months to do some metastasis research in the Weinberg lab, I end up spending a year and a half focusing on how cancer heterogeneity, primarily cancer stem cells, are connected with cancer metastasis. Working with Christine Chaffer, we have established that more aggressive breast cancer has a more
abundant cancer stem cell population. We have also observed that in more aggressive breast cancer, there is switching from non-cancer stem cell to cancer stem cell. This was for the first time observed. Further, we have named this cancer cell plasticity or adaptability. We have shown that this was under the control of the Zeb1 transcription factor in breast cancer and that TGF-b signaling was able to increases these transitions.
Further, we established that cancer non-stem cells had this property and had bivalent chromatin at Zeb1 locus, which enabled them to respond to environmental cues, such as TGF-b. In contrast, cancer non-stem cells had silenced chromatin and DNA methylation at Zebn1 locus. It is worth mentioning that cancer cells that had been in the "locked" state were also breast cancer types that had been less aggressive and more luminal (more differentiated). Our work has been published in the Cell journal, and this was just the begging of my quest to understand cancer cell heterogeneity.
After my experience in the Weinberg lab, I have spent some time at the Cancer program at the Broad Institute, in professor Todd Golub's lab. In Golub lab, I have been focused on trying to connect cancer heterogeneity with some functional consequences such as cancer cachexia. In my previous work, we have also observed that CSC and helping with cancer metastasis can also have some other systemic effects, such as increasing the inflammation, and that there is crosstalk between cancer cells from the primary tumor and metastasis. To better understand this phenomenon, I have asked the question: Do the cancer that can induce cancer cachexia have higher numbers of the CSC? We have shown that pancreatic and some stomach cancers, which were prominent in inducing cachexia, were also dominated by CSC populations. We have also demonstrated that these cellular
subpopulations also secrete S100 protein, which we further show can induce cachexia by binding to their receptor’s ion muscle and adipose tissue.
After the Golub lab experience and coming to the understanding that there were a lot of issues with how we are defining CSC and which markers we are using to isolate them, I got interested in the more" unbiased" approaches in defining CSC and cancer heterogeneity. At the same time, I have noted the start of the single cell genomics and scRNA-seq. In my mind, this was the perfect tool to investigate cancer heterogeneity. I have decided to pursue a Ph.D. in the Computational and Systems Biology (CSBi) Program at MIT School of Engineering.
The basic idea behind CSBi program is to train multidisciplinary scientist that will ask essential questions in biology and biomedicine, using system-level and computational approaches. The central premise is that biology, as a science, has come to an age where technology and computational approaches are driving novel discoveries. Along those lines, educating multidisciplinary trained scientists capable of addressing crucial biological questions using novel methods and computational techniques becomes paramount. In my Ph.D. work, I have addressed precisely the critical biological questions with high unmet need, such as lung cancer. Using novel approaches, such as scRNA-seq, I wanted to question how tumor heterogeneity changes during tumor progression and evolution and elucidate how drug treatments affect it.
Thesis Outline
My Ph.D. thesis is divided into three chapters: Introduction, Results and Discussion. In the first chapter, or the Introduction chapter, I will provide a scholarly review of my thesis's critical aspects, such as lung cancer, tumor heterogeneity and scRNA-seq. In the first subchapter of the Introduction, I will present an overview of lung cancer and its unmet need, focusing on non-small cell lung cancer (NSCLC) and mouse models important for studying lung cancer. In the 2nd subchapter, I will provide an overview of what is known in the cancer
heterogeneity field, examining some of the critical components of tumor heterogeneity, and some of the hypotheses that explain the importance of tumor heterogeneity for tumor progression and drug resistance. In the last subchapter of the Introduction, I will give an overview of the essential methods and computational approaches used for answering the questions in my thesis. I focused on the development of the scRNA-seq techniques and appropriate computational approaches for the data analysis.
In the second chapter, or the Results chapter, of my Ph.D. thesis, I will present my work published in Cancer Cell journal. In this work, we have used genetically engineered mouse models (GEMMs) coupled with scRNA-seq to study tumor progression and drug resistance at the single-cell level. Using GEMMs allowed us to induce specific mutations in the cell of interest in the lungs. Further, this GEMM allowed us to selectively label cancer cells with the fluorescent dye, which helped us sort out cancer cells and use them for the downstream analysis. This model also allowed us to take samples at different time points and with different genetic modifications, further enabling us to provide, for the first time, the transcriptional map of the tumor progression at the single-cell level.
In the last chapter of the thesis, or the Discussion chapter, I will discuss the potential short- and long-term direction this work has opened up. Further, I will also underline the aspects of my Ph.D. work that present novel insights that could lead to novel discoveries.
Chapter 1
Introduction
1. Lung Cancer
1.1 Overview of the epidemiology and etiology of lung cancer
Lung cancer is one of the leading causes of death for both men and women in the USA and worldwide. In the USA, lung cancer is the deadliest cancer type. With around 142,670 deaths in 2019, it results in almost three times as many deaths as colon cancer, which is the 2nd most fatal cancer in the USA, with 51,200 deaths in 2019 (1). Globally, lung
cancer is the most diagnosed cancer type, and also it has the highest number of deaths. Owing to the absence of clinical symptoms and effective screening programs, most lung cancers are diagnosed at an advanced stage. Lung cancer five-year survival in the USA is around 15%. Even though there have been advances in lung cancer treatment in the last few decades, it is still lagging behind some other cancer types (breast cancer, prostate cancer, colon cancer) (2).
One of the most common carcinogens that cause lung cancer is tobacco. It is estimated that for more than 80% of lung cancer, the primary etiologic agent is smoking. Further, it has been experimentally validated that polyaromatic hydrocarbons (such as benzo[a]pyrene (BaP), 4-(methylnitrosamino)-1-(3-pyridyl)-1-butanone (NNK), 1,3-butadiene, ethyl carbamate), can induce lung cancer as well. Furthermore, it has been shown that second-hand smoking in the workplace can increase the risk of lung cancer. In addition
such as NO2 and benzopyrene, has also been established as a significant risk factor for
developing lung cancer. Exposure to radon, asbestos, arsenic, nickel, and chromium can even increase lung cancer risk (2).
Interestingly, recent statistics show that there has been a relatively large increase in the number of lung cancer cases in developing countries compared to developed countries. One explanation of this could be that leading causes of lung cancer are tobacco smoking and other air and chemical pollutants such as asbestos, arsenic, chromium, nickel, and NO2. The
use of these pollutants in developing countries is less restricted than in developed countries (2).
1.2 Molecular basis of the Lung Cancer
Lung cancer is a heterogeneous disease with multiple genetic and epigenetic alternations. Understanding these alternations and their functional significance can impact lung cancer prevention, diagnosis, and treatment. Lung cancer develops through a multi-step process, where novel genetic and/or epigenetic mutations are acquired. These mutations' primary function is to activate the growth signaling pathways (KRAS, EGFR, BRAF, HER2, ALK) and to inhibit the tumor suppressor pathways (P53, PTEN, LKB-1). Activation of the oncogenes usually happens by gene amplification, point mutations, and structural rearrangements (3). Tumor suppressor genes are typically deleted. New generation sequencing (NGS) has highlighted great genetic diversity in lung cancer. Lung cancer is one of the most genetically diverse cancers by the number of different mutations identified. Some of the most common mutations in lung cancer are identified in BRAF, EGFR, and KRAS pathway. These findings were confirmed by NGS. In addition to these, NGS analyses have also identified low-frequency, but recurrent mutations in DDR2, ERB4, FGFR1, JAK2, RET (4). While NGS has been tremendously useful in identifying and cataloging all the different genetic mutations in lung cancer, one of the main challenges is understanding which of these mutations have functional consequences, and are therefore considered to be the driver mutations. On the other hand, it is also essential to identify which of these mutations don't have functional consequences but are more mere bystanders and are passenger mutations.
KRAS gene encodes a G-protein, and it is one of the three oncogenes in the RAS family, together with NRAS and HRAS. Kras' primary function is the downstream signal transduction upon binding various growth factors and activation of the MAPK pathway. Through MAPK pathway activation, KRAS regulates cell proliferation, differentiation, and survival (5). In the quiescent form, KRAS binds GDP; upon growth factor binding, GDP is exchanged to GTP, and KRAS is activated. After completing its function of activating the MAPK pathway, GTP is hydrolyzed to GDP. Activation mutations of KRAS are the most commonly observed mutations in lung cancer (with being observed in 25-40% of cases) (6). These mutations disable activated KRAS-GTP's inactivation to KRAS-GDP, making KRAS constitutively activated, which results in the constitutive activation of the the MAPK pathway. KRAS mutations are common for lung adenocarcinoma; however, they are rare in small cell lung cancer. KRAS mutations are also more common in the western populations than in Asian populations and they are more often seen in smokers and males. Interestingly, KRAS mutations are rarely seen together with EGFR mutations in the same patients (7). This could be because these two mutations would have the same result of activating the MAPK pathway. Even though KRAS mutations are common in lung cancer and might seem to be a lucrative therapeutic target, the clinical trials for KRAS-targeted therapies have been disappointing.
1.2.2 EGFR
EGFR gene codes for the transmembrane tyrosine kinase receptor. Upon binding the epidermal growth factor, it leads to receptor dimerization and activation of the tyrosine
kinase domain and downstream signal transduction. Signaling pathways activated via EGFR are Pi3k/AKT/mTOR, RAS/RAF/MAPK, and Jak/STAT. EGFR signaling controls cellular proliferation, survival, differentiation, neovascularization, invasion, and metastasis (8). Activating mutations in EGFR lead to constitutive tyrosine kinase activation. EGFR mutations are found in 15% of the Western population and in about 40% of patients in Asian populations (8).
1.2.3 Tumor Suppressors
The tumor suppressor's primary function is the control of the cellular growth and proliferation in normal cells. For successful tumorigenesis, tumor suppressor genes and their expression and function are like breaks that can halt the cell cycle and induce apoptosis. To overcome this hurdle, tumors need to lose both copies of the tumor suppressor genes. Usually, one allele is inactivated via mutation or epigenetic silencing, while the other copy is lost through loss of heterozygosity (LOH). In lung cancer, the most commonly deleted tumor suppressors are TP53, retinoblastoma 1 (RB1), and serine-threonine kinase 11 (STK11), CDKN2a, FHIT, PTEN. Deletion of the genomic region 17p13, where Tp53 is located, is one of the most common lung cancer events, with a 90% incidence in small cell lung cancer and about 65% NSCLC (9). Tp53 encodes for the gene that responds to stress induced by damaged DNA. Upon activation, p53 functions as the transcription factor, which controls the expression of many different genes. The primary function of those genes is stalling the cell cycle and activation of the DNA repair or apoptosis upon identification of the cellular stress and DNA damage (10).
1.3 Non-small cell lung cancer (NSCLC)
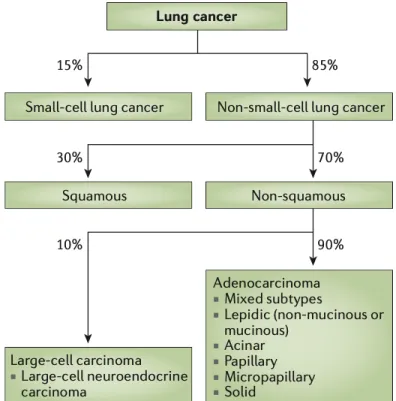
Lung cancer is a heterogeneous disease, which can be divided broadly into two different classes: small cell lung carcinoma (SCLC) and non-small cell lung carcinoma (NSCLC). Lung cancer can be divided into these two subcategories based on the cell of origin, which in NSCLC is the lung cell, whereas in SCLC it is the neuroendocrine cell. NSCLC is the most common lung cancer subtype, with more than 80% of all lung cancer cases. NSCLC can be subdivided into lung adenocarcinoma, squamous cell carcinoma, and large cell carcinoma (11).
Figure 2. Lung cancer classification (11).
The primary function for the lungs is the gas exchange, where oxygen is captured, and CO2 is released. Because lungs have direct interaction with the environment through the
air we breathe, lung cells can accumulate different mutations due to exposure to various mutagens. In addition to this, inflammation in the lungs due to different irritants coming in contact with alveoli can increase the risk of developing cancer. Due to environmental exposure, lung cells can start to change (genetically and epigenetically); these changes are usually observed in the localized area called field defect. The first histologically observed step in lungs carcinogenesis is the atypical adenomatous hyperplasia (AAH), which is a benign and preneoplastic change. After AAH, further progression to metaplasia, dysplasia, carcinoma in situ, and advanced carcinoma in lung cancer can be observed (12). Some of the most common oncogene mutations detected in NSCLC are mutations in EGFR and ALK. The most typical mutations for the adenocarcinomas NSCLS subtype are the KRAS oncogene activation. In addition to these oncogenes, Sox, PIK3 CA, Keap1 are among the most common oncogenes being mutated in the NSCLC adenocarcinoma subtype. When it comes to tumor suppressor mutations in NSCLC, we can observe that Tp53 and Rb1 are the most common tumor suppressors to be deleted. Even though these oncogenes and tumor suppressors are the most common genetic alternation seen in NSCLC adenocarcinomas, it is worth emphasizing that NSCLC is a highly heterogeneous disease at the genetic and epigenetic level.
Furthermore, we can observe this heterogeneity at different levels; we can observe it at the intra-tumoral level (e.g., different mutations observed between primary tumor and metastatic lesion) and inter-tumoral level (different mutation observed among different patients). We can also observe that even in the primary tumor, we can have different genetic clones. These different genetic clones can be observed at different time points (temporal
heterogeneity), or in different areas of the tumor (spatial heterogeneity). In addition to genetic and epigenetic heterogeneity, we can also observe that tumor microenvironment can be heterogeneous, and this can be observed at both intra-tumoral and inter-tumoral level. This heterogeneity also has functional consequences, as we know that one of the features of the NSCLC is the extensive interaction with stromal components, where tumor cells need VEGF, HGF, and SHH for their growth, and which are being provided by the stromal components. (13)
NSCLC treatment is divided into three categories, which depend on the tumor stage at the time of diagnosis, its histological cell type, and molecular profile. Based on these categories, NSCLC tumor management is classified as resectable, locally advanced, or advanced NSCLC (11). The standard treatment for the resectable NSCLC is lobectomy. For the locally advanced NSCLC, multimodal therapy is the primary option, where sequential chemotherapy is combined with radiotherapy. For the advanced stage, NSCLC therapy is usually personalized based on the genomic mutation profile and the histology of the tumor. The most common treatments are targeted therapies against EGFR and ALK.(14)
1.4 Mouse cancer models
Before developing mouse cancer models to study cancer, cancer researchers were using cancer cell lines, of both human and mouse origins. While the use of cancer cell lines helped define oncogenes and their function and had a role in understanding the process of cancer transformation, the use of cancer cell lines had a few important limitations. Primarily, these were ex vivo systems, and therefore the physiological aspects of the tumorigenesis
processes were missing. In addition, studying tumor development, as well as studying tumor interactions with stromal cells in these systems was not possible. Some of these concerns were addressed with the xenograft models, where cancer researchers could transplant human tumor cells into the immunocompromised mice. Even though this enabled in vivo studying of the tumor development, one of the main issues was that the immune component was missing. We know now that the immune system plays one of the crucial roles in tumor development .(15)
Genetically engineered mouse models (GEMMs) helped overcome these hurdles. There are multiple different ways to induce cancer in genetically manipulated mice. First unofficial GEMMS were transgenic mouse models such as MMTV-Myc, which confirmed that oncogenes could promote tumorigenesis in vivo. (16) After that, the discovery of homologous recombination in mammalian cells and the development of the methods for manipulating the mouse embryonic stem cells spurred further development of the first GEMMS. In these first GEMMs, it was possible to delete the genetic sequence of interest, creating knockout mice, or insert an exogenous genetic sequence of interest, creating knock-in mouse models (17). These models enabled understandknock-ing of the ways deletions of tumor suppressor genes, such as tp53 and Rb, affect tumor development. These studies showed that deletion of the tp53 increases chances of developing tumors. The next development in GEMMs was the use of conditional and inducible mouse models. One of the most famous models is the Cre-loxP recombination system. In this model, Cre recombinase performs site-directed DNA recombination between two 34-bp loxP sites. (18) The significant advantage of this model is to study gene function in a cell-specific manner. In addition, inducible
models as the Tet-inducible system allowed examining gene function in the temporal fashion.
2. Cancer heterogeneity
2.1 Genetic heterogeneity and clonal progression
Genetic heterogeneity in tumors is one of the first observed axes of tumor heterogeneity. Some of the early work goes back to Nowell in 1976, where he strongly advocated for the stepwise acquisition of mutation during tumor progression. Further, he proposed that two main forces, acquired genetic instability and selection process, act together and result in advanced cancer. He also noted that advanced tumors are karyotypically and biologically highly individual and that perhaps each patient tumor would require unique treatment (19). His work also hints at the idea of the intertumoral heterogeneity - tumors of the same type having different genetic mutations. Our current understanding of tumor growth and progression is based on Nowell's initial theories, which were later supported by experimental proof from Vogelstein and others. In their seminal work, they have shown that colon cancer progression is a stepwise process, where tumor cells acquire novel mutations to advance to the next stage of progression (20).
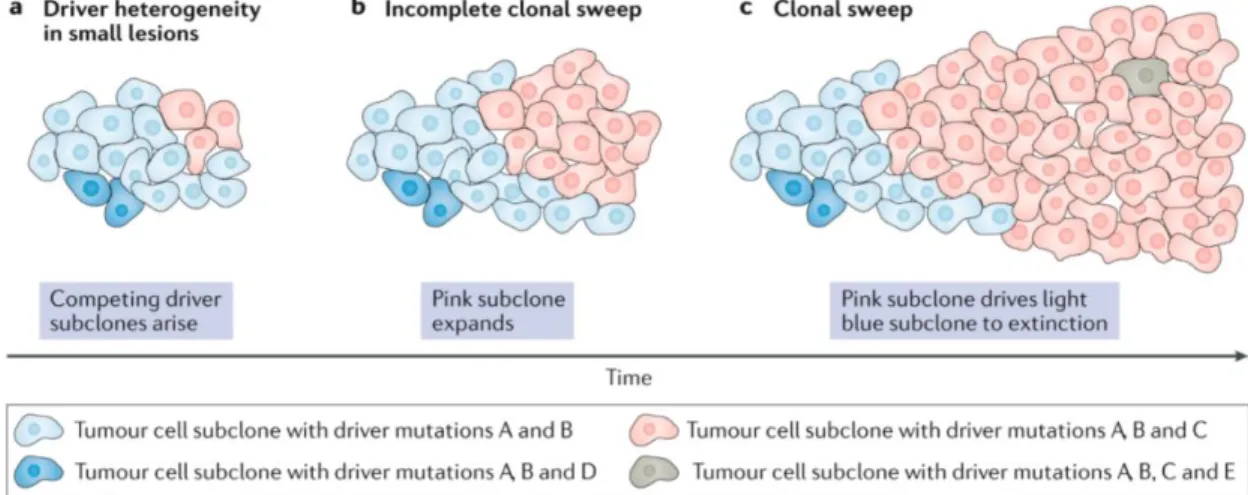
In cancer, we observe a spectrum of different mutations, from single nucleotide mutations to whole genome multiplications (21). These mutations provide the substrate on which selection can act upon it in Darwinian fashion. During tumor evolution, with selective pressure, the fittest clones are selected, which grow and dominate other clones through so-called selective sweeps. Selective sweeps can be repeated numerous times during tumor
progression, indicating that most tumors will have multiple genetic clones during their lifetime and that clonal evolution is one of the shaping forces during tumor progression (22).
Figure 3. Depiction of the genetic evolution in cancer (23)
With the development of NGS and its application to oncology in the last decade, we now have a much better understanding of tumor genetic heterogeneity and the prevalence of clonal evolution. Human tumors can harbor very few mutations (24), to hundreds of mutations, as we observe in human lung adenocarcinoma (25, 26). Further, it has also been shown that not all mutations observed in cancers have the same importance for tumor progression. Based on their role in tumor growth, mutations have been divided into two distinct classes: driver and passenger mutations. Driver mutations are defined as mutations that contribute to tumor growth and progression. In contrast, passenger mutations are bystander mutations, which don't play an active role in tumor growth and progression (21). Driver and bystander mutations show patterns of intratumoral and intertumoral heterogeneity. It is also worth noting that most of the sequencing efforts have been made at
the "bulk" level by sampling populations of cells. Therefore, we still don't have a full understanding of the extent of the actual genetic heterogeneity.
2.2 Tumor microenvironment (TME) role in tumor heterogeneity
The tumor microenvironment (TME) is the environment around tumor cells consisting of the cellular (blood vessels, immune, stromal, and parenchymal cells) and non-cellular (extranon-cellular matrix, signaling molecules) components. Spatial heterogeneity is one of the main features of the TME. First observations about spatial heterogeneity came from pathology reports that observed differences in the type, number, and position of tumor-infiltrating lymphocytes (TILs) in cutaneous melanoma. Further, they have shown that tumor-infiltrating lymphocytes can have a predictive survival value as well. Similar findings have been observed in many other cancer types (27).
TME has been recognized as one of the critical players essential for tumor growth and progression, tumor metastases, therapy efficacy, and resistance. For example, it has also been shown that chronic inflammation can result in oxidative stress, which in itself can induce DNA mutations, and therefore provide additional substrate for the tumor evolution, and aid tumor progression. In glioblastomas, the spatial heterogeneity of the TME was shown to be aligned with the tumor's genetic heterogeneity. Cancer cells with EGFR amplifications tend to be near hypoxic or poorly vascularized areas, whereas cancer cells that have amplified PDGFRA are near blood vessels (28). For cancer cells to metastasize, the first step is to leave the primary tumor. Along those lines, it has been shown that TME is different at the invasive and non-invasive edge of the primary tumors. Additionally, it has
been demonstrated that TME can be an essential factor in inducing EMT, as well as influencing differentiation in tumor cells (29).
The contribution of the TME to the tumor heterogeneity can be seen as analogous to the environment's role in natural ecosystems. In the previous example, we could be thinking about the ecosystem where there is a river (blood vessel) vs. the ecosystem where there is a desert, for example.
2.3 Cancer Stem Cell (CSC) hypothesis
The basic premise of CSC theory is that there are phenotypic differences among tumor cells that are essential for tumor growth and progression. Cells with CSC features are thought to fuel tumor growth because they can self-renew and maintain the CSC pool, or they can differentiate and add to the tumor non-CSC. Non-CSCs are thought to have the ability to increase, and for most cancer types, they would make up the bulk of the tumor. The CSC hypothesis proposes a hierarchy among cancer cells, similar to the hierarchy in normal tissue. If the CSC were analogous to a normal stem cell, non-CSC would be analogous to transit-amplifying and/or differentiated cells in normal tissue.
The first experimental evidence for the existence of the cancer stem cell (CSC) was found in acute myeloid leukemia (AML). In AML, a cell population with hematopoietic stem cell (HSC) surface markers (CD34+CD38-) can reconstitute the original tumor when
transplanted to the immunodeficient mice in a limiting dilution assay. By contrast, other cancer cell populations, which didn't have these markers, show limited tumor-initiating capability (29). This initial work highlighted that CSCs have two different traits:
• tumor initiation properties when transplanted into mice, indicating that only a few of these cells are enough to initiate a tumor
• capacity to generate other cellular subpopulations as well as CSC population (they can both differentiate and self-renew)
In addition to observing CSC in liquid cancers, CSCs have also been observed, isolated, and studied in solid cancer, with breast cancer being one of the most thoroughly researched solid cancers. In breast cancer, the CD44+CD24- population showed increased
self-renewal, increased tumorigenicity, the ability to differentiate into other subpopulations, increased metastatic potential, reduced proliferation, and reduced sensitivity to chemotherapy (31). Not all CSCs have reduced proliferation, but those with similar features, albeit different markers, have been identified across multiple solid and liquid cancer types (32).
Despite being able to detect CSC in most tumor types, the CSC theory still faces vigorous debate in the scientific community. One of the significant problems with the CSC hypothesis is that CSC has been defined based on particular experimental conditions. The most common experimental set up used to study and test CSC are:
- Tumorosphere assay, which tests the ability of cells to proliferate in 3D conditions - Transplantation assay where tumor initiation is tested in immunodeficient mice Transplantation assays were thought to be the gold standard for testing CSC. However, it is essential to note that the transplantation assay only tests the tumor-initiating capability of the cancer cells and can only be tested in a permissive environment. Most CSC models to date have been xenograft models, where human cells are transplanted to
immunocompromised mice (33). Studies done on AML, melanoma, lung, and breast cancer CSC have unequivocally shown that the more the mice are immunocompromised, the higher the number of CSCs detected (34). An additional layer of complexity arose with the CSC surface markers and their variability from patient to patient or cell line to cell line, making CSC theory somewhat problematic and disputed (35).
Figure 4. Depiction of differences between cancer stem cell hypothesis and clonal evolution/stochastic model (36).
In the previous chapter, we outlined the CSC hypothesis and potential problems with it, including that CSC identity is defined by the experimental set up we have used. Also, another problem is that we have applied our understanding of the normal stem cell differentiation directly to the CSC hypothesis. In this particular case, we have kept our uncompromising vision of the differentiation of the normal stem cell to differentiated cells, where the differentiation happens through a serious of strictly defined stages and in a more controlled microenvironment. However, it is crucial to outline the outstanding questions about the CSC hypothesis:
1. How confident are we that differentiation in normal tissue occurs through rigid and defined stages, versus being a more continuous process?
2. How do we know that cancer cells would follow this particular rigid trajectory even if they were correct in the first place?
3. Are the transitions between CSC and non-CSC always unidirectional from CSC to non-CSC? Or are transitions bidirectional?
Roesch et al. have shown in melanoma that CSCs don't follow the hierarchal model, and they have observed transitions from non-CSC to CSC. Using H3K4 demethylase JARID1B as a marker of CSC, they observed that JARID1B- cells could give rise to JARID1B+ cells. Further, they have also shown that the expression of JARID1B can be switched on and off in a reversible fashion and that oxygen levels can control the switch (37). Their dynamic stemness model was one of the first demonstrations of the phenotypic plasticity of cancer cells, where the correct environmental stimulus cells can switch from one state to the other.
Using breast cancer as a model, Chaffer et al. showed that some subtypes of the breast cancers don't follow the classical hierarchical CSC model, where transitions from CSC to non-CSC are unidirectional. In this work, they have shown that in some types of breast cancer, non-CSC could give rise to CSC. These transitions were instigated with TGFb. However, it is essential to underline that non-CSC to CSC switching was not observed in all types of breast cancer. Breast cancers that showed bidirectional transitions also had bivalent chromatin on the promoter of Zeb1. Breast cancer cells that were in a locked state, and which were not able to switch back and forth, had repressed chromatin marks and DNA hypermethylation on Zeb1 promotor (38). These two seminal papers support the plasticity theory, which states that cancer cells can adapt to new environmental signals and switch their phenotypes without changing their phenotype.
Phenotypic plasticity was also observed in drug-resistant cancer cells. Using cancer cell lines, Sharma et al. detected a small subpopulation of the reversible drug-tolerant cancer cells. The drug-tolerant cancer cell phenotype was transitional, and it was chromatin-mediated (39).
Cancer cell plasticity seems to occur in cells that have a permissible epigenetic landscape and correct external cues. However, it is essential to ask why some cancer cells have the right epigenetic landscape, and others don't. One of the factors could be the cell of origin for the particular cancer. Chaffer et al. showed in their work that only basal breast cancers, not luminal ones, show phenotypic plasticity (40).
2.5 Consequences of tumor heterogeneity
Tumor heterogeneity is omnipresent, and it fosters tumor evolution by:
1. Providing genetic and epigenetic substrates upon which selection and Darwinian evolution can act, thus giving the advantage or disadvantage to tumor growth 2. The interaction of multiple genetic or phenotypic clones with each other to enable
tumor growth and progression. For example, in lung adenocarcinoma, niche cells provide WNT ligands to CSCs (41).
In addition to fueling tumor growth and progression, tumor heterogeneity is one of the biggest challenges in medicine, playing a key role in diagnosis, treatment, and clinical outcomes. For example, in metastatic colorectal cancer, anti-EGFR treatments show efficacy in patients with KRAS wild-type subtype tumors. However, in patients with mutated KRAS, these treatments have subpar effectiveness (42). In another example, cancers with oncogene addiction are addicted to particular mutations that could be used as their vulnerability. Melanoma patients with a BRAF mutation are sensitive to treatment with BRAF inhibitor, while patients that have melanoma with wild type BRAF are resistant to this treatment (43). Therapy response and resistance can be profoundly affected by intratumor heterogeneity. If we think about therapy as a selective pressure, when applied, it can select for the fittest tumor cells, enabling the growth of the selected clones and relapse of the disease. In our previous example with CRC, which has KRAS wild type, anti-EGFR therapy can lead to the relapse of the disease, where we observe mutated KRAS. In addition to genetic heterogeneity, it has been shown as well that CSC, in general, are more resistant to therapy (44). In breast cancer, it has been shown that breast CSC can have low levels of
reactive oxygen species, which in turn protect them against radiation (45). CSC in CML has shown to be more quiescent and less proliferative compared to non-CSC, which protects them against imatinib, a drug that mostly targets proliferating cells (46).
3. RNA sequencing and single cell genomics
3.1 Overview of RNA sequencing
RNA sequencing (RNA-seq) methods were developed in 2007 (46). RNA-seq was primarily applied for measuring the mRNA levels at the cell population level, also known as bulk RNA-seq. Bulk RNA-seq enabled measuring and comparing gene expression programs. In recent years single cell RNA-seq was developed, which enabled reading gene expression at the single cell level. This greater resolution allows researchers to move from the gene expression on the level of population of cells to a single cell gene expression level. It allows agreater understanding of the fundamental unit of life: a cell. In addition to methods measuring the mRNA levels, some methods are able to measure mRNA that is being transcribed or translated. Also, some methods can sequence the structure of the RNA. The most recent development in the fields is the invention of the spatial transcriptomics, which enables spatial sequencing and identifying gene expression in the tissues. (47)
RNA sequencing starts with the preparation of the sequencing library. Library preparation will depend on the sequencing platform. There are three different methods for RNA sequencing: direct RNA sequencing (Oxford nanopore), long read sequencing (PacificBio), and short read sequencing (Illumina). The most commonly used sequencing platform is the short-read sequing. Library preparation usually starts with the RNA
fragmentation, followed by reverse transcription and cDNA synthesis with, or followed by adaptor ligation and PCR amplification. The last step is the size selection of the library. The main advantage of the short-read sequencing is the high throughput of the methods. In addition, short read has been shown to be extremely robust at both inter and intra platform level. This is essential characteristic because RNA is a highly unstable molecule and degrades easily outside of the cell.
3.2 Single Cell Genomics - Overview
The cell is the fundamental unit of life. Since the discovery of the cell in the 18th
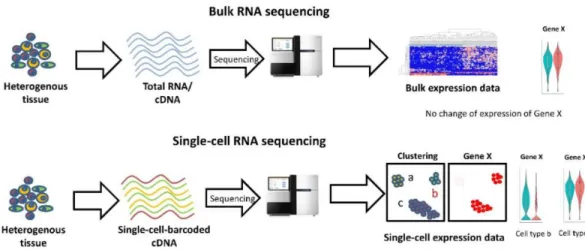
century, and with the discovery of the microscope, scientists have extensively studied single cells. In the last 20/30 years, we have seen a significant expansion of the methods for studying single-cell measurements, such as flow cytometry and FISH. However, the problem with most of these approaches is that they provide limited information: usually, we can measure a few features (RNA, protein) at once in each cell. The rapid development of sequencing, especially NGS, has enabled scientists to collect thousands of features from the cell, also known as genome-scale approaches. However, most of genome-scale approaches were done at the population level, which means that we were sampling thousands of cells at once and recording population genome-scale features. Trying to bridge genome-scale approaches with single cell resolution has fueled the development of single cell genomics. In the last few years, available cell genomics methods have tremendously developed and enabled us to study cells at both single cell resolution and genome scale, where we can collect thousands of features simultaneously for each cell.
Figure 5. Comparison between bulk RNA-seq and scRNA-seq (48) 3.3 Single Cell Genomics - Development
A typical cell contains around 10-50pg of total RNA, with mRNA being approximately 1-5% of the total RNA in the cell. Thus, the amplification of the input material is a crucial step to obtain sequencing input requirements. For the generation of whole transcriptome amplification (WTA) in scRNAseq, the initial method used oligo-dT primers, followed by ligation adapter PCR (49). However, this approach had 3' bias due to insufficient first strand synthesis. To overcome this issue, the Smart-seq2 method was developed, which enabled us to profile full-length mRNA. For the first strand synthesis, Smart-seq2 uses a template-switching mechanism to anchor the primer binding site on the 3'cDNA and MMLV reverse transcriptase. After that, cDNA is amplified with PCR, and the sequencing library is prepared using the NEXTERA kit (50).
Additionally, the method was also automatized by using the Bravo robot, which significantly increased the efficiency and consistency of the protocol. The advantages of the
Smart-seq2 approach are that we can detect multiple transcript isoforms, as well as SNPs. However, due to PCR amplification, some PCR biases are introduced. This particular issue can be overcome by using UMI (universal molecular identifier or barcode), which corrects for the PCR amplification biases. Another problem is that template switching is a highly inefficient process, and therefore lowly expressed transcripts can be difficult to detect. A parallel method to Smart-seq2, called CEL-seq, was developed to overcome PCR biases by using in vitro transcription (IVT) to amplify mRNA (51). An additional problem with the Smart-seq2 method is that the high throughput was low (around a few hundred cells per experiment), due to not being able to pool samples before the final step of the library preparation. With the development of the application of microfluidics, this problem was solved. Microfluidic approaches use droplets to separate samples (cells), and each droplet has a unique barcode, which is incorporated in the first-strand synthesis during the reverse transcription step. Early barcoding of the cells enables the pooling of all of the samples together and increases the throughput of the method. Initial droplet methods were Drop-seq and InDrop, and today 10x is the commercial version most widely used (52).
3.4 Single cell RNA sequencing analysis
The first step in the scRNA-seq analysis is the mapping of the reads or the read alignment. This first step is the crucial step for the downstream analysis. Read alignment is also a useful QC metric of the overall quality of the scRNA-seq data. Since this process is the same for the bulk RNAseq, there are no differences between alignment approaches when
mapping the reads of the scRNA-seq data. We can divide read mapping algorithms into two subgroups:
• Spaced-seed indexing based algorithms such as TopHat2
• Burrows-Wheeler transform based algorithms such as Bowtie, HISAT.
The mapping algorithms' primary function is to accurately map the sequence to the reference genome and do it promptly (to be fast enough). According to a comparison done by Engstrom et al., which evaluated 26 different mapping algorithms, there is no perfect algorithm; some of them will be more accurate, while others will be able to perform mapping faster, but with more errors. (53)
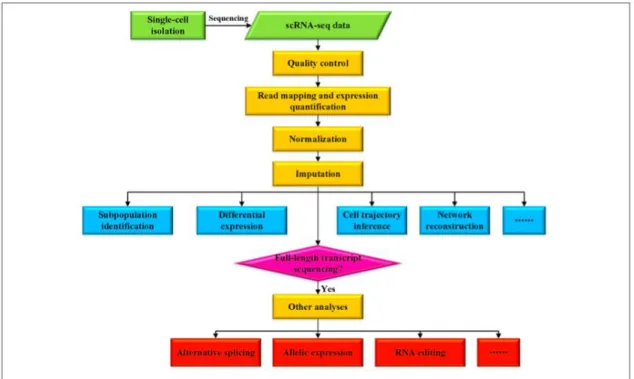
Figure 6. Overview of the analysis of the scRNA-seq data. (54)
After mapping the reads to the reference genome, transcript expression quantification is the next step. Depending on whether the used scRNA-seq method is the whole transcript
or the 3’ or 5’, different methods should be used. Expression, or the transcripts' abundance, is usually calculated in reads, or the fragments per kilobase per million mapped reads, and/or transcripts per million mapped reads. Some of the most common tools used for this are the Cufflinks or RSEM. If the method is 3’ or 5’, UMI is used to quantify the expression. One of the popular tools for quantification of the 3’ UMI based methods is SAVER (55).
One of the scRNA-seq methods' main limitations is that starting material (mRNA captured) is in low quantities (approximately every mammalian cell has a total of 360,000 mRNA molecules, which is up to 3% of total RNA in a cell). This will increase technical variation in comparison with the bulk RNA-seq methods due to low capture efficiency, the bias of transcript coverage, and sequencing coverage. In addition to these effects, biological variation is also much higher when using scRNA-seq than bulk RNA-seq methods. Biological variation is different because we look at single cells compared to averaged transcriptomes of thousands of cells. And, additionally, the process of isolation of the single cell can be damaging to many cells, leading to cell death and stress, among other effects. It is also crucial to note that our sorting methods (or the microfluidics methods) sometimes capture multiple cells instead of a single cell, which results in inaccurate data.
With these limitations in mind, quality control of the scRNA-seq data sets is of paramount importance to avoid misinterpretation of the data. A few metrics should be implemented in removing scRNA-seq data:
• Cells with very few reads per cell should be removed as we don’t know the reason why only a few reads were detected (it could be due to capture or sequencing bias, or cells could be dead or stressed)
• Cells with very low mapping ration should be removed (these reads might be unmappable due to RNA degradation, and therefore this cell as the sample could be confounding the data)
• Cells with low numbers of mapped mitochondrial reads (we know that RNA in the cytoplasm can easily degrade, however, RNA in mitochondria is more stable; therefore a low number of mitochondrial reads could suggest that this cell is damaged or dead)
• Cells with a low gene/transcript ratio (low number of unique genes detected in a cell could suggest cell death or damage)
In addition to the aforementioned technical biases, one additional technical bias is the batch bias, which is common for high throughput experiments. The batch bias of the high throughput experiments, coupled with the limiting amounts of the highly unstable RNA (as the starting material) in the generation of the scRNA-seq libraries, leads to one of the major challenges in the scRNA-seq analysis. The batch effect poses challenges in analyzing data indifferent experiments and different labs and platforms. Removing the batch effect enables easier data integration and interpretation. There are few methods developed for batch correction; however, it is important to note that many of these methods can overcorrect the batch effect. Therefore, it is possible to lose some of the biological variation. Some of the most commonly used methods for batch correction are the CCA (canonical correlation analysis), kBET (k-nearest neighbor batch effect), and MNN (mutual nearest neighbor). (54)
All of these QC and batch effect removal methods are helping with the normalization of the data. Normalization of the data can be done within the sample or between samples. For the normalization within the sample, the goal is to remove gene-specific biases, such as gene length. This can be achieved by using metrics such as RPKM/FPKM or TPM. The goal of the normalization between samples is to equalize the differences in the sequencing depth and coverage.
After the normalization of the scRNA-seq data, the next step in the analysis is the dimensionality reduction. scRNA-seq data set usually has thousands of cells, with each cell having hundreds to thousands of genes detected, resulting in a phenomenon called high dimensional data. Seeing all of this data at once is incredibly hard; therefore, the purpose of dimensionality reduction is to project this data into lower dimensional space by preserving some key properties of the original data. There are two different ways to reduce data dimensionality: using linear on nonlinear approaches. PCA (Principal Component Analyses) is one of the most commonly used linear approaches to reduce dimensionality. tSNE and UMAP are methods for nonlinear dimensionality reduction (56).
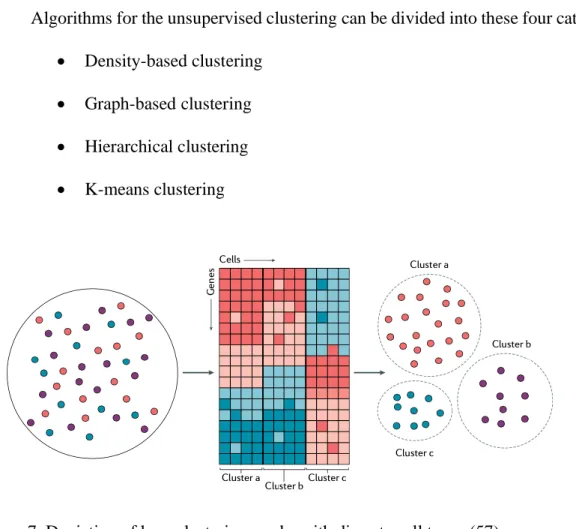
After this step, the next important step is the identification of different cellular subpopulations. One way to do this is to cluster scRNA-seq in a way that enables cells that are alike to cluster together. There are two approaches to clustering:
• We have the prior information on the cellular markers and by using them, and we can cluster the cells based on their cellular markers, for example
• Unsupervised clustering where we can use the computational approaches for the identification of the novel cell subpopulations.
Algorithms for the unsupervised clustering can be divided into these four categories: • Density-based clustering
• Graph-based clustering • Hierarchical clustering • K-means clustering
Figure 7. Depiction of how clustering works with discrete cell types (57)
After the identification of different cellular subpopulations, the next step is to understand the differences among different cellular subpopulations. In scRNA-seq, we measure the mRNA levels; therefore, comparison in gene expression is an important analytical metric to look at. The difference in gene expression is an important metric for understanding the function of the cellular subpopulation and identifying markers that can help us isolate a subpopulation of interest to further
study in the reductionism approach, for example. It is important to note that scRNA-seq has high technical noise, emphasizing high dropouts, which can significantly disable the use of the DEGs method developed for the bulk RNA-seq analysis. Therefore, there have been developed additional scRNA-seq DEG analysis methods such as Census, DEsingle, MAST, and SCDE. (54) As with most of the methods, each of the approaches has advantages and disadvantages, shown in a comparison done by Soneson and Robinson. In their comparison, they have compared 36 different approaches and found measurable differences. (58)
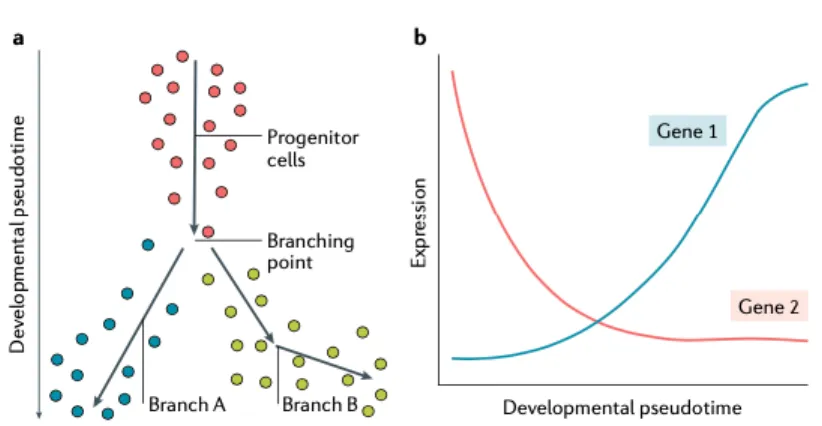
In addition to the aforementioned technical noise, there is also considerable biological noise. Bulk RNA-seq analyses measure gene expression programs across many cells, giving us gene expression programs of the different cellular subpopulations and states, and probably to certain degree measures the most common gene program in cell subpopulation. However, we know that gene expression programs for particular cell states are not rigid; rather, the cell state is somewhat dynamic. We should talk about cellular states and not cellular state (singular). To analyze the cellular states' dynamics, transition methods for inferring and modeling cellular trajectory and pseudotime have been developed. Using these methods, we can put cells ordered on the trajectory from the beginning to the end of the trajectory. By doing so, we can identify stem, progenitor, and differential cellular states. We can also infer the key molecular underpinnings for the transition between states by comparing and analyzing DEGs during the trajectory. Observed trajectories can be linear, bifurcated, multifurcated, cyclic, or tree structure. The most commonly used
methods are Monocle, Optimal transport, Waterfall, Wishbone, TSCAN, and RNA velocity. (59)
Figure 8. Modeling continuous cellular states. Using pseudotime or trajectory analysis helps with modeling of the continuous cell states. (57)
References
1. https://www.cancer.org/cancer/lung-cancer/about/key-statistics.html 2. Cruz, C. S. D., Tanoue, L. T., & Matthay, R. A. (2011). Lung cancer:
epidemiology, etiology, and prevention. Clinics in chest medicine, 32(4), 605-644. 3. Larsen, J. E., & Minna, J. D. (2011). Molecular biology of lung cancer: clinical
implications. Clinics in chest medicine, 32(4), 703-740.
4. Liu, P., Morrison, C., Wang, L., Xiong, D., Vedell, P., Cui, P., ... & Ebben, J. D. (2012). Identification of somatic mutations in non-small cell lung carcinomas using whole-exome sequencing. Carcinogenesis, 33(7), 1270-1276.
5. Downward, J. (2003). Targeting RAS signalling pathways in cancer therapy. Nature Reviews Cancer, 3(1), 11-22.
6. Riely, G. J., Kris, M. G., Rosenbaum, D., Marks, J., Li, A., Chitale, D. A., ... & Miller, V. A. (2008). Frequency and distinctive spectrum of KRAS mutations in never smokers with lung adenocarcinoma. Clinical cancer research, 14(18), 5731-5734.
7. Rodenhuis, S., & Slebos, R. J. (1992). Clinical significance of ras oncogene
activation in human lung cancer. Cancer research, 52(9 Supplement), 2665s-2669s. 8. Kosaka, T., Yatabe, Y., Endoh, H., Kuwano, H., Takahashi, T., & Mitsudomi, T.
(2004). Mutations of the epidermal growth factor receptor gene in lung cancer: biological and clinical implications. Cancer research, 64(24), 8919-8923. 9. Mogi, A., & Kuwano, H. (2011). TP53 mutations in nonsmall cell lung
cancer. BioMed Research International, 2011.
10. Husgafvel-Pursiainen, K., Boffetta, P., Kannio, A., Nyberg, F., Pershagen, G., Mukeria, A., ... & Benhamou, S. (2000). p53 mutations and exposure to environmental tobacco smoke in a multicenter study on lung cancer. Cancer Research, 60(11), 2906-2911.
11. Gridelli, C., Rossi, A., Carbone, D. P., Guarize, J., Karachaliou, N., Mok, T., ... & Rosell, R. (2015). Non-small-cell lung cancer. Nature reviews Disease
primers, 1(1), 1-16.
12. Wood, S. L., Pernemalm, M., Crosbie, P. A., & Whetton, A. D. (2015). Molecular histology of lung
cancer: from targets to treatments. Cancer treatment reviews, 41(4), 361-375. 13. Dagogo-Jack, I., & Shaw, A. T. (2018). Tumour heterogeneity and resistance to
cancer therapies. Nature reviews Clinical oncology, 15(2), 81.
14. Herbst, R. S., Morgensztern, D., & Boshoff, C. (2018). The biology and management of non-small cell lung cancer. Nature, 553(7689), 446-454. 15. Cheon, D. J., & Orsulic, S. (2011). Mouse models of cancer. Annual Review of
Pathology: Mechanisms of Disease, 6, 95-119.
16. Lampreht Tratar, U., Horvat, S., & Cemazar, M. (2018). Transgenic mouse models in cancer research. Frontiers in oncology, 8, 268.
17. Walrath, J. C., Hawes, J. J., Van Dyke, T., & Reilly, K. M. (2010). Genetically engineered mouse models in cancer research. In Advances in cancer research (Vol. 106, pp. 113-164). Academic Press.
18. Kwon, M. C., & Berns, A. (2013). Mouse models for lung cancer. Molecular oncology, 7(2), 165-177.
19. Nowell, P. C. (1976). The clonal evolution of tumor cell populations. Science, 194(4260), 23-28.
20. Fearon, E. R., & Vogelstein, B. (1990). A genetic model for colorectal tumorigenesis. cell, 61(5), 759-767.
21. McGranahan, N., & Swanton, C. (2015). Biological and therapeutic impact of intratumor heterogeneity in cancer evolution. Cancer cell, 27(1), 15-26.
22. Greaves, M., & Maley, C. C. (2012). Clonal evolution in cancer. Nature, 481(7381), 306-313.
23. Reiter, J. G., Baretti, M., Gerold, J. M., Makohon-Moore, A. P., Daud, A., Iacobuzio-Donahue, C. A., ... & Vogelstein, B. (2019). An analysis of genetic heterogeneity in untreated cancers. Nature Reviews Cancer, 19(11), 639-650. 24. Parsons, D. W., Li, M., Zhang, X., Jones, S., Leary, R. J., Lin, J. C. H., ... & Gallia,
G. L. (2011). The genetic landscape of the childhood cancer medulloblastoma. science, 331(6016), 435-439.
25. Ding, L., Getz, G., Wheeler, D. A., Mardis, E. R., McLellan, M. D., Cibulskis, K., ... & Fulton, L. (2008). Somatic mutations affect key pathways in lung adenocarcinoma. Nature, 455(7216), 1069-1075.
26. Maley, C. C., Galipeau, P. C., Finley, J. C., Wongsurawat, V. J., Li, X., Sanchez, C. A., ... & Reid, B. J. (2006). Genetic clonal diversity predicts progression to esophageal adenocarcinoma. Nature genetics, 38(4), 468-473.
27. Runa, F., Hamalian, S., Meade, K., Shisgal, P., Gray, P. C., & Kelber, J. A. (2017). Tumor microenvironment heterogeneity: challenges and opportunities. Current molecular biology reports, 3(4), 218-229
28. Hambardzumyan, D., & Bergers, G. (2015). Glioblastoma: defining tumor niches. Trends in cancer, 1(4), 252-265.
29. Quail, D. F., & Joyce, J. A. (2013). Microenvironmental regulation of tumor progression and metastasis. Nature medicine, 19(11), 1423-1437.
30. Bonnet, D., & Dick, J. E. (1997). Human acute myeloid leukemia is organized as a hierarchy that originates from a primitive hematopoietic cell. Nature medicine, 3(7), 730-737.
31. Zhou, J., Chen, Q., Zou, Y., Chen, H., Qi, L., & Chen, Y. (2019). Stem cells and cellular origins of breast cancer: updates in rationale, controversies, and therapeutic implications. Frontiers in oncology, 9, 820.
32. Batlle, E., & Clevers, H. (2017). Cancer stem cells revisited. Nature medicine, 23(10), 1124.
33. Magee, J. A., Piskounova, E., & Morrison, S. J. (2012). Cancer stem cells: impact, heterogeneity, and uncertainty. Cancer cell, 21(3), 283-296.
34. Kreso, A., & Dick, J. E. (2014). Evolution of the cancer stem cell model. Cell stem cell, 14(3), 275-291.
35. Annett, S., & Robson, T. (2018). Targeting cancer stem cells in the clinic: current status and perspectives. Pharmacology & therapeutics, 187, 13-30.
36. Butti, R., Gunasekaran, V. P., Kumar, T. V., Banerjee, P., & Kundu, G. C. (2019). Breast cancer stem cells: Biology and therapeutic implications. The international journal of biochemistry & cell biology, 107, 38-52.
37. Roesch, A., Fukunaga-Kalabis, M., Schmidt, E. C., Zabierowski, S. E., Brafford, P. A., Vultur, A., ... & Herlyn, M. (2010). A temporarily distinct subpopulation of slow-cycling melanoma cells is required for continuous tumor growth. Cell, 141(4), 583-594.
38. Chaffer, C. L., Marjanovic, N. D., Lee, T., Bell, G., Kleer, C. G., Reinhardt, F., ... & Weinberg, R. A. (2013). Poised chromatin at the ZEB1 promoter enables breast cancer cell plasticity and enhances tumorigenicity. Cell, 154(1), 61-74.
39. Sharma, S. V., Lee, D. Y., Li, B., Quinlan, M. P., Takahashi, F., Maheswaran, S., ... & Wong, K. K. (2010). A chromatin-mediated reversible drug-tolerant state in cancer cell subpopulations. Cell, 141(1), 69-80.
40. Tammela, T., Sanchez-Rivera, F. J., Cetinbas, N. M., Wu, K., Joshi, N. S., Helenius, K., ... & Gu, X. (2017). A Wnt-producing niche drives proliferative potential and progression in lung adenocarcinoma. Nature, 545(7654), 355-359.
41. Khambata-Ford, S., Garrett, C. R., Meropol, N. J., Basik, M., Harbison, C. T., Wu, S., ... & Tan, B. R. (2007). Expression of epiregulin and amphiregulin and K-ras mutation status predict disease control in metastatic colorectal cancer patients treated with cetuximab. Journal of clinical oncology, 25(22), 3230-3237.
42. Flaherty, K. T., Puzanov, I., Kim, K. B., Ribas, A., McArthur, G. A., Sosman, J. A., ... & Chapman, P. B. (2010). Inhibition of mutated, activated BRAF in metastatic melanoma. New England Journal of Medicine, 363(9), 809-819.
43. Vermeulen, L., e Melo, F. D. S., Richel, D. J., & Medema, J. P. (2012). The developing cancer stem-cell model: clinical challenges and opportunities. The lancet oncology, 13(2), e83-e89.
44. Diehn, M., Cho, R. W., Lobo, N. A., Kalisky, T., Dorie, M. J., Kulp, A. N., ... & Joshua, B. (2009). Association of reactive oxygen species levels and radioresistance in cancer stem cells. nature, 458(7239), 780-783.
45. Takeishi, S., Matsumoto, A., Onoyama, I., Naka, K., Hirao, A., & Nakayama, K. I. (2013). Ablation of Fbxw7 eliminates leukemia-initiating cells by preventing quiescence. Cancer cell, 23(3), 347-361.
46. Emrich, S. J., Barbazuk, W. B., Li, L., & Schnable, P. S. (2007). Gene discovery and annotation using LCM-454 transcriptome sequencing. Genome research, 17(1), 69-73.
47. Stark, R., Grzelak, M., & Hadfield, J. (2019). RNA sequencing: the teenage years. Nature Reviews Genetics, 20(11), 631-656.
48. http://p7cancer.com/2020/01/30/human-genome-project/
49. Tang, F., Barbacioru, C., Wang, Y., Nordman, E., Lee, C., Xu, N., ... & Lao, K. (2009). mRNA-Seq whole-transcriptome analysis of a single cell. Nature methods, 6(5), 377-382.
50. Trombetta, J. J., Gennert, D., Lu, D., Satija, R., Shalek, A. K., & Regev, A. (2014). Preparation of single‐cell RNA‐seq libraries for next generation sequencing. Current protocols in molecular biology, 107(1), 4-22.
51. Chen, G., Ning, B., & Shi, T. (2019). Single-cell RNA-seq technologies and related computational data analysis. Frontiers in genetics, 10, 317.
52. Klein, A. M., & Macosko, E. (2017). InDrops and Drop-seq technologies for single-cell sequencing. Lab on a Chip, 17(15), 2540-2541.
53. Hwang, B., Lee, J. H., & Bang, D. (2018). Single-cell RNA sequencing technologies and bioinformatics pipelines. Experimental & molecular medicine, 50(8), 1-14.
54. Chen, G., Ning, B., & Shi, T. (2019). Single-cell RNA-seq technologies and related computational data analysis. Frontiers in genetics, 10, 317.
55. Huang, M., Wang, J., Torre, E., Dueck, H., Shaffer, S., Bonasio, R., ... & Zhang, N. R. (2018). SAVER: gene expression recovery for single-cell RNA
sequencing. Nature methods, 15(7), 539-542.
56. Becht, E., McInnes, L., Healy, J., Dutertre, C. A., Kwok, I. W., Ng, L. G., ... & Newell, E. W. (2019). Dimensionality reduction for visualizing single-cell data using UMAP. Nature biotechnology, 37(1), 38-44.
57. Wu, Y., & Zhang, K. (2020). Tools for the analysis of high-dimensional single-cell RNA sequencing data. Nature Reviews Nephrology, 1-14.
58. Soneson, C., & Robinson, M. D. (2018). Bias, robustness and scalability in single-cell differential expression analysis. Nature methods, 15(4), 255.
59. Rostom, R., Svensson, V., Teichmann, S. A., & Kar, G. (2017). Computational approaches for interpreting scRNA‐seq data. FEBS letters, 591(15), 2213-2225.
Chapter 2
Results
Emergence of a high-plasticity cell state during lung cancer evolution
This article has been published in
Marjanovic, N. D., Hofree, M., Chan, J. E., Canner, D., Wu, K., Trakala, M., ... & Hudson, A. (2020). Emergence of a high-plasticity cell state during lung cancer evolution. Cancer
Cell.
_________________________________________________________________________
SUMMARY
Tumor evolution from a single cell into a malignant tissue comprised of diverse cell populations remains poorly understood. Here, we profiled single cell transcriptomes from genetically engineered mouse lung tumors at seven stages spanning tumor progression from atypical adenomatous hyperplasia to lung adenocarcinoma. The diversity of transcriptional states spanned by tumor cells increased over time and was reproducible across tumors and mice, but was not explained by genomic copy number variation. Cancer cells progressively adopted alternate lineage identities, computationally predicted to be mediated through a common transitional, high-plasticity cell state (HPCS). HPCS cells prospectively isolated from mouse tumors had robust potential for phenotypic switching and tumor formation, and were more chemoresistant in mice. Putative HPCS cells prospectively isolated from human patient-derived lung cancer xenografts displayed high plasticity and tumor sphere-forming capacity. The HPCS program was associated with poor survival in human lung
adenocarcinoma and across human cancers. Our study reveals transitions that connect cell states across tumor evolution and motivate therapeutic targeting of the HPCS.
INTRODUCTION
Tumors are cellular societies in which the phenotype, or state, of each cancer cell is influenced by multiple cell-intrinsic and cell-extrinsic factors. Defined cellular states observed in cancer, such as cancer stem-like cells (CSCs) and epithelial-to-mesenchymal transition (EMT), can play distinct roles in tumor progression (Batlle and Clevers, 2017; Chaffer et al., 2016; Kreso and Dick, 2014; Marjanovic et al., 2013). Moreover, the diversity of cancer cell states within tumors poses a challenge for effective cancer therapies (Lawson et al., 2018). The nature and sequence of the genetic events that define some common cancers have been characterized in detail over the past three decades (Fearon and Vogelstein, 1990; Hutter and Zenklusen, 2018), as have the expression profiles of bulk human and mouse tumors in late stages of tumor progression (Ambrogio et al., 2016; Campbell et al., 2016; Feldser et al., 2010; Winslow et al., 2011). However, our increasingly fine understanding of genetic events occurring during tumorigenesis is not yet matched by a similar understanding of the progression of cancer cell at the molecular and functional level, especially for early microscopic neoplasias that cannot be readily detected in patients. In particular, we do not know how diverse such states are at different points along tumorigenesis, how reproducibly they would arise in a defined genetic context, how the states of different cells in the same tumor relate to, support, or compete with each other, and what role they may play in driving tumor progression or response to therapy.