HAL Id: insu-02919791
https://hal-insu.archives-ouvertes.fr/insu-02919791
Submitted on 24 Aug 2020
HAL is a multi-disciplinary open access
archive for the deposit and dissemination of
sci-entific research documents, whether they are
pub-lished or not. The documents may come from
teaching and research institutions in France or
abroad, or from public or private research centers.
L’archive ouverte pluridisciplinaire HAL, est
destinée au dépôt et à la diffusion de documents
scientifiques de niveau recherche, publiés ou non,
émanant des établissements d’enseignement et de
recherche français ou étrangers, des laboratoires
publics ou privés.
The Importance of Icelandic Ice Sheet Growth and
Retreat on Mantle CO 2 Flux
John Armitage, David Ferguson, Kenni Petersen, Timothy Creyts
To cite this version:
John Armitage, David Ferguson, Kenni Petersen, Timothy Creyts. The Importance of Icelandic Ice
Sheet Growth and Retreat on Mantle CO 2 Flux. Geophysical Research Letters, American Geophysical
Union, 2019, 46 (12), pp.6451-6458. �10.1029/2019GL081955�. �insu-02919791�
The Importance of Icelandic Ice Sheet Growth
and Retreat on Mantle CO
2
Flux
John J. Armitage1 , David J. Ferguson2, Kenni D. Petersen3 , and Timothy T. Creyts4
1Dynamique des Fluides Géologiques, Institut de Physique du Globe de Paris, Paris, France,2School of Earth and
Environment, University of Leeds, Leeds, UK,3Department of Geoscience, University of Aarhus, Aarhus, Denmark, 4Lamont-Doherty Earth Observatory, Columbia University, New York, NY, USA
Abstract
Climate cycles may significantly affect the eruptive behavior of terrestrial volcanoes due to pressure changes caused by glacial loading, which raises the possibility that climate change may modulate CO2degassing via volcanism. In Iceland, magmatism is likely to have been influenced by glacial activity. To explore if deglaciation therefore impacted CO2flux, we coupled a model of glacial loading over the last ∼120 ka to melt generation and transport. We find that a nuanced relationship exists between magmatism and glacial activity. Enhanced CO2degassing happened prior to the main phase of late-Pleistocenedeglaciation, and it is sensitive to the duration of the growth of the ice sheet entering into the Last Glacial Maximum (LGM), as well as the rate of ice loss. Ice sheet growth depresses melting in the upper mantle, creating a delayed pulse of CO2out-gassing, as the magmatic system recovers from the effects of loading.
1. Introduction
Evidence from several tectonic settings indicates that glaciated volcanic systems respond to changing ice vol-umes (Glazner et al., 1999; Jellinek et al., 2004; Jull & McKenzie, 1996; Maclennan et al., 2002; Rawson et al., 2016; Sigvaldson et al., 1992) and suggests there was a widespread volcanic response to late-Pleistocene ice retreat (Huybers & Langmuir, 2009). The most compelling evidence for climate-coupled volcanism comes from Iceland, where changes in early Holocene lava volumes and magma chemistry are consistent with depressurization during glacial unloading (Jull & McKenzie, 1996; Maclennan et al., 2002; Sinton et al., 2005). Magma generation here occurs due to pressure-release melting, as the mantle upwells beneath rift zones. Although the net change in overburden pressures from variations in ice cover have been relatively small, the high rates of change associated with glacial activity can produce significant short-term fluctua-tions in magmatic output (Jull & McKenzie, 1996; Pagli & Sigmundsson, 2008; Schmidt et al., 2013). Carbon readily partitions into magmas during partial melting (Rosenthal et al., 2015) and is released as a CO2-rich fluid/vapor as the magma ascends through the crust, making volcanism the primary pathway for transport-ing carbon from the Earth's mantle to the atmosphere (Dasgupta & Hirschmann, 2010). However, carbon does not enter the melt uniformly during partial melting and is concentrated in early formed magma. There-fore, the extent to which glacially driven changes in primary magma generation alter the flux of CO2depends
on where in the melting column melt production is enhanced (or suppressed), the rate of melt transport, and the history of ice sheet growth and retreat.
It is thought that CO2and the trace element Nb have a relatively similar behavior during decompression
melting (Saal et al., 2002), and as such Nb compositions can be used to gauge the quantity of CO2erupted. In Iceland there are just over 300 published dated analyses of the Nb composition of Pleistocene lavas (Eason et al., 2015; Gee et al., 1998). This is arguably the most complete geochemical record of Nb compositions within a region that experienced significant Pleistocene deglaciation. In this study we take a new approach and use a high-resolution model of ice sheet history to drive a forward model of melt generation and trans-port and predict CO2degassing. We validate the model predictions against the seismic structure imaged below Iceland, and the observed crustal thickness. We subsequently explore under what conditions climate and magmatism might be related, and the implications for CO2degassing.
2. Methods
2.1. Modeling of Melt Generation and Transport
We develop a model of magma generation and transport coupled to a model of the flexure of a viscoelastic beam for the response to change in load due to the ice sheet history (see the supporting information). The
RESEARCH LETTER
10.1029/2019GL081955Key Points:
• We combine a new history of Icelandic ice cover with a forward model of magma generation • Peak mantle CO2flux is nonlinearly
related to magmatic eruption rates • Icelandic CO2degassing likely
peaked first at 60 ka and second with three pulses between 20 and 10 ka
Supporting Information: • Supporting Information S1 • Table S1 • Figure S1 • Figure S2 • Figure S3 • Figure S4 • Data Set S1 Correspondence to: J. J. Armitage, armitage@ipgp.fr Citation: Armitage, J. J., Ferguson, D., Petersen, K. D., & Creyts, T. T. (2019). The importance of Icelandic ice sheet growth and retreat on mantle CO2 flux. Geophysical Research Letters, 46. https://doi.org/10.1029/2019GL081955
Received 8 JAN 2019 Accepted 20 MAY 2019
Accepted article online 28 MAY 2019
©2019. American Geophysical Union. All Rights Reserved.
Geophysical Research Letters
10.1029/2019GL081955
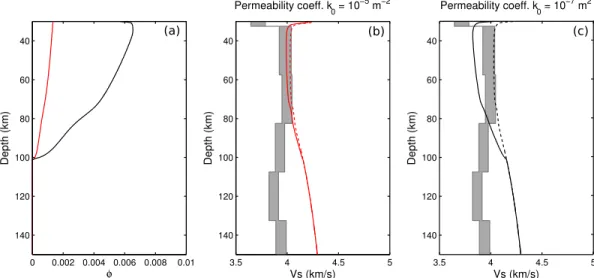
Figure 1. Profiles of porosity and S wave seismic velocity for the two model permeabilities ofk0=10−7m2black line
andk0=10−5m2red line. (a) Porosity plotted against depth at steady state. (b) S wave velocity from the joint inversion
of teleseismic and ambient noise Rayleigh waves (Harmon & Rychert, 2016) and the predicted S wave profile from the high permeability case. The model includes the addition of the adiabatic gradient, the anharmonic effects from the mineralogy, and effects of attenuation (Goes et al., 2012). The dashed line assumes melt has no effect; the solid line includes a 7.9 % reduction in VSper percent melt (Hammond & Humphreys, 2000). (c) S wave velocity predictions for the low-permeability case.
coupled model consists of a flexural model of the surface displacement due to the changing surface load as the ice sheet changes in thickness. This model of surface displacement is then coupled to either a 1-D vertical column or a 2-D corner flow model where the flow of the mantle is prescribed at either an upwelling rate of 10 or 20 mm/year or lateral spreading rate of 10 mm/year. We use these two upwelling rates to cover the uncertainty in the exact rate of vertical ascent the mantle below Iceland due to mantle buoyancy. The upwelling column is perturbed by the displacement due to loading, where the viscoelastic decay time of the load is set to 1,000 years. The upper surface of the melting model is held at 30 km to be consistent with the Moho depth, which is in the range of 20 to 40 km below Iceland (Jenkins et al., 2018). Carbon partitioning into the melt is assumed to be governed by the coefficients derived by Rosenthal et al. (2015). We use a mantle source composition for Nb of 1.627 ppm, which is intermediate between the end-member sources for Icelandic melts identified by Shorttle and Maclennan (2011). To approximate the melting of the multiple source lithologies, we chose a solidus-depletion gradient of 600◦C, which is intermediate between that of melting experiments on depleted mantle, 900◦C (Wasylenki et al., 2003) and fertile mantle 300◦C (Scott, 1992).
To constrain permeability, we examined the effects of varying the permeability coefficient on the seismic properties of the mantle produced by our 1-D model. The thermal structure and porosity was converted to S wave velocities, assuming that melt reduces the velocity by 7.9% per percent porosity (Hammond & Humphreys, 2000) and including the effects of attenuation (Goes et al., 2012). Recent joint inversion of tele-seismic and ambient noise Rayleigh waves in Iceland would suggest that the S wave velocity is between 4 and 3.8 km/s at depths of 50 to 150 km (Harmon & Rychert, 2016; Figure 1). We find that the permeability coefficient, k0, needs to be relatively high (10−5m2) giving a permeability, k𝜙=k0𝜙3(where𝜙 is porosity),
of the order of 10−14m2(𝜙 ≈ 0.001; Figure 1), because otherwise porosity would be too large and the S wave
velocity would decrease below the observed values. This permeability is an order of magnitude higher than the upper range used to explore how sea level change might influence mid-ocean ridge magmatism (Burley & Katz, 2015; Crowley et al., 2015) and suggests rates of magmatic ascent of the order of 10 m/year, in agree-ment with Maclennan et al. (2002). Previously, it has been suggested that delays in signal propagation from the zone of partial melting at mid-ocean ridges to the surface might be of the order of a Milankovitch-scale period, 40 kyr (Huybers & Langmuir, 2017). However, the high permeability required to match the seis-mic observations from Iceland implies a magmatic system that much more rapidly responds to change in melting conditions, consistent with the fast transport rates estimated from U-series isotope studies (Elliot & Spiegelman, 2014).
Geophysical Research Letters
10.1029/2019GL081955
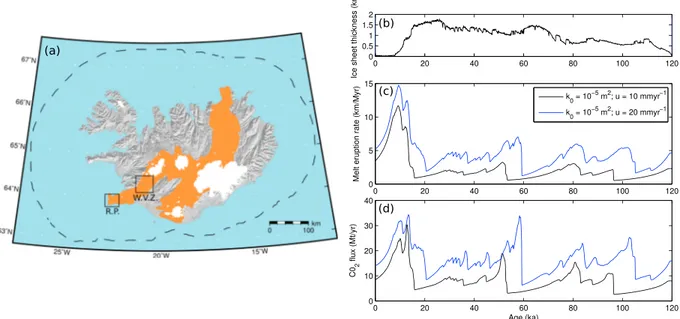
Figure 2. Response of the model to periodic and observed ice sheet thickness changes of the last 120 ka. (a) Map of Iceland showing the locations of the
volcanic rift zones in orange and the maximum extent of the ice sheet at the last glacial maximum (dashed line). The boxes show the location of the Reykjanes Peninsular (R. P.) and the Western Volcanic Zone (W. V. Z.). (b) The ice sheet thickness predicted from the ice sheet model M1 over the last 120 ka. (c) Melt eruption rate and (d) carbon flux response to the step change in ice sheet thickness: black line, an upper mantle permeability coefficient ofk0=10−5m2and
upwelling velocity of 10 mm/year, and blue line, an upwelling velocity of 20 mm/year.
2.2. Glacial Forcing Throughout the Pleistocene
Iceland experienced extensive ice cover during the last glacial period (Patton et al., 2017), with maximum thicknesses in the center of the island of ∼ 2 km attained by ∼23 ka (Figures 2a and 2b). Deglaciation after the LGM occurred at a varying rate and was discontinuous. For example, a stage of readvance occurred dur-ing the colder climate of the Younger Dryas (11.7–12.9 ka; Nordahl & Ingólfsson, 2015). The final phase of deglaciation was particularly rapid, with the main volcanic zones being largely ice free by ∼10 ka (Figure 2a). The most uncertain period of the glacial history is the pre-LGM growth of the ice sheet. To create the ice sheet histories shown in Figures 2b and 3a, we calibrated the ice volume since the LGM against the North Green-land Ice Core Project𝛿18O record, and Quaternary sea level curves assuming a linear correlation between
these three signals (see Text S1). We focus on two scenarios: M1, based on the ICE-5G sea level curves (Peltier, 2004), and M2, based on the sea level curves of (Pico et al., 2017; Figure S2).
3. Results
3.1. Effect of Glacial Loading and Unloading
We force our melt model with the 120-ka glacial history after a 5-Myr model windup to steady state (model M1; Figure 2b) and using a single value for the ice thickness at each time step, therefore neglecting the effects of the distal parts of the ice sheet on melting beneath the rift margins. The impact of deglaciation events is modulated by the upwelling rate of the solid mantle because the upwelling rate controls the back-ground productivity of the melting model. At slower upwelling rates, that is, 10 mm/year, some periods of deglaciation are not recorded in the flux of magma erupted. An example of this is the warming event at 60 ka (Figure 2), where the 10 mm/year upwelling model produces no response in either the eruption rate or CO2flux. If however upwelling is more rapid, 20 mm/year, then there is a clear pulse in melt eruption rate
(Figure 2). For a more productive scenario, there is increased shallow melting. The displacement imposed by the flexural response to unloading dissipates with depth. Therefore, if melting is productive and hence shallow it will feel the effects of the unloading to a greater extent when compared to a less productive melt-ing system. Furthermore, when productivity is low, the porosity is low, and the rate of vertical melt flow is slow such that a pulse in melt production will not reach the surface rapidly.
The magnitude of CO2flux peaks is not linearly related to the magnitude in eruption rates (Figure 2d). For
example, in the 20 mm/year upwelling rate model, the largest CO2peak is estimated to occur at ∼60 ka and
Geophysical Research Letters
10.1029/2019GL081955
Figure 3. Impact of ice sheet grown and decay on melt eruption and composition over the last 40 ka. (a) Ice sheet models M1 and M2 taken from the sea level
models of Peltier (2004) and Pico et al. (2017), respectively. (b) Melt eruption rates (in kilometers of melt per million years): blue solid line, ice sheet history M1 fork0=10−5m2with an upwelling rate of 20 mm/year; blue dashed line, M1 fork
0=10−5m2with an upwelling rate of 10 mm/year; black solid line, ice sheet
history M2 fork0=10−5m2with an upwelling rate of 20 mm/year. The gray region shows estimated eruption rates from geological observations (Maclennan
et al., 2002) (in square kilometer of melt per million years). (c) Observed and predicted Nb concentrations (parts per million), observations are from the Reykjanes Peninsula and the Western Volcanic Zone (Eason et al., 2015; Gee et al., 1998; Sinton et al., 2005), which are binned into three major periods: glacial (>12 ka), early postglacial (between 12 and7ka) and recent (<7 ka). (d) Predicted variation of in the concentration of carbon (parts per million) within the erupted melt. (e) Predicted variation in the flux of CO2, assuming that the flux of CO2that Icelandic volcanism covers an area of 30,000 km2, and CO2(parts per million) = 3.67 C (parts per million; see equation (23) in the supporting information).
is because when the ∼60-ka warming occurred, the melt was enriched in carbon due to the preceding rapid glaciation. Magma supplied from the mantle during the Late-Pleistocene pulse was more depleted in carbon compared to those in the 60-ka event. The implication of this result is that volumetrically small volcanic events might have just as a strong influence on CO2degassing as the more significant periods of volcanic eruptions and the magnitude of CO2degassing is dependent on the history of glacial forcing.
3.2. Glacial Forcing Through the Latest Pleistocene and Holocene
During the last 40 ka, our model suggests that CO2flux is highly dependent on the glacial forcing. There
are two distinct late-Pleistocene magmatic pulses, separated by the Younger Dryas cold period (Figures 3a and 3b). However, for the model M2 ice sheet history there are three pulses in CO2flux at the end of the Pleistocene, due to the faster ice sheet growth entering the LGM from 35 to 25 ka in this model (Figures 3a and 3e). This peak in CO2flux is because the small magnitude but rapid deglaciations after 25-ka tap melts rich in trace elements including Nb and carbon (Figures 3c and 3d).
The observed time series of incompatible trace element concentrations in Icelandic magmas and ice sheet history have been suggested to be strongly associated (Eason et al., 2015; Gee et al., 1998; Jull & McKenzie, 1996; Maclennan et al., 2002; Sinton et al., 2005). Of these studies Gee et al. (1998) and Eason et al. (2015) report on the Nb composition of lavas erupted and give age ranges for the erupted lavas. Dating lava flow in Iceland is complex, given the lack of reliable markers from which ages can be obtained. This means that ages are instead typically taken from the morphology and tephrochronology of erupted flows (Maclennan et al., 2002). Following the work of Maclennan et al. (2002), we bin the reported Nb compositions into three major periods: glacial (>12 ka), early postglacial (between 12 and 7 ka), and recent (<7 ka). The reduction in Nb compositions plotted is in line with the trends observed within the smaller sample size of La and Sm compositions presented in Maclennan et al. (2002) and is therefore likely robust.
We find that the predicted change in Nb from all our models fits within the range of the observations (Figure 3c). The M2 model gives the strongest signature in Nb concentrations of deglaciation during the end of the Pleistocene, while the signature is more subdued in the M1 ice sheet model (Figure 3c). The 1-D forward model used is highly idealized, and yet the agreement between the observations and model is encouraging and suggests the compositional change observed in lavas erupted during the late-Pleistocene to early Holocene is due to rapid deglaciation (Eason et al., 2015; Gee et al., 1998; Maclennan et al., 2002;
Geophysical Research Letters
10.1029/2019GL081955
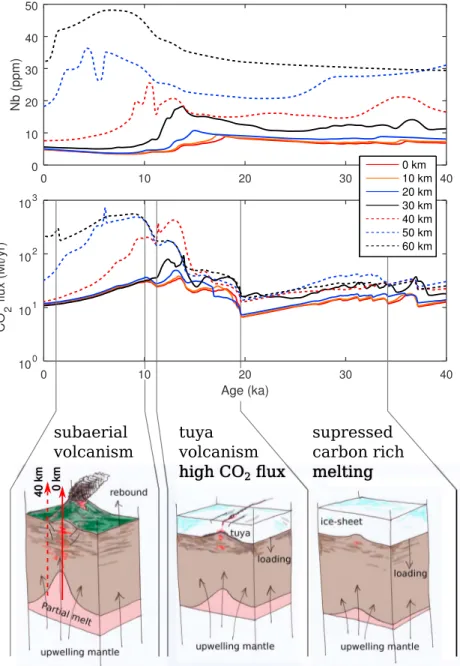
Figure 4. Impact of glacial history on off-axis and on-axis melting. A series of 1-D column melting models forced by
the response to deglaciation (ice sheet history model M1) where the mantle flow is of steady state corner flow. (a) Nb concentrations from the center of extension out to 60 km from the center of extension. The mean concentration weighted by the eruption rate is plotted as the thick black line. (b) Predicted CO2flux from the series of vertical melting models. The late-Pleistocene eruptions are typified by tuya magmatism. This will have been the case up until at least∼14 ka, where either magmatism was suppressed or when eruptions occurred, they will have been beneath at least 1 km of ice cover (Hartley et al., 2016). The suppressed melting regime will have become carbon rich because the shallow low-C melt production is damped due to the ice sheet loading. Upon deglaciation there is increased volcansim, which initially taps the melt rich carbon.
Sinton et al., 2005). This implies that the observed change in melt composition is due to change in ice sheet loading and that the predeglaciation volcanism likely released a significant volume of CO2(Figure 3e).
The 1-D column model will underestimate the impact of change in deep melt productivity, as it cannot capture the deep wings of the zone of partial melting. To explore the impact of this, we force a series of 1-D models with the vertical flow taken from steady state corner flow perturbed by the flexural response of the deglaciation of a 200-km-wide ice sheet. The half spreading rate is assumed to be 10 mm/year, and the mantle potential temperature is 1,450◦C. Melt travels vertically from the zone of partial melting in columns
Geophysical Research Letters
10.1029/2019GL081955
at 0 to 80 km from the rift axis (Figure 4). The steady state thickness of melt erupted at the surface of the simplified 2-D model is 20 km (Figure S4), and glacial forcing causes this thickness to vary around this value by the order of 10 km except for a large spike at the LGM. The crust of Iceland varies in thickness from 20 to 40 km (e.g., Jenkins et al., 2018), and therefore, a model steady state thickness of 20 km is a reasonable lower end-member prediction given that the crust is made of both extrusions and intrusions.After glacial perturbation we find that in the central zone, from the ridge center to 40-km distance, the trend in Nb and CO2flux is relatively similar, with a reduction in Nb at 15 ka. At distances greater that 40 km, a
peak in Nb and CO2flux is predicted to occur with an increasing delay compared to the center of extension
(Figure 4). This delay is due to the greater distance that the melt has to travel along the vertical path from the top of the melt zone to the surface at increasing distance from the center of extension. In full 2-D models the distal melt will pool as it migrates laterally toward the center of extension (Katz, 2008), yet the difference in ascent velocity due to the increase porosity as the melt pools would likely not be sufficient to overcome the increased distance that the signal will have to travel.
The full solution to the coupled equations of magma dynamics would suggest that melts generated at a dis-tance of up to 60 km from the center of extension are advected to the ridge axis (Katz, 2008). If all of the melt generated up to 60 km from the center of extension is erupted, then the CO2flux is significantly increased
during the Holocene due to the addition input of melt from the distal parts of the zone of partial melting (Figure 4b). Therefore, these low productivity and deep regions of the zone of partial melting might be a key exporter of mantle carbon into the atmosphere. However, the range of observed Nb concentrations is relatively similar to the axial concentrations, from within<40 km of the rift center (Figure 4). This would suggest that the widest regions of the zone of partial melting are not sampled by the volcanism in the Reyk-janes Ridge and Western Volcanic Zone, leading to an estimate of CO2fluxes more in line with the simpler
1-D model.
4. Discussion and Conclusions
The models imply that the deglaciation beginning at 18 ka and continuing through the Bölling warming at 14.8 ka released substantial quantities of CO2when compared to the last 120 ka (Figures 3c and 4b), and
this elevated CO2release was because of the preceding growth of the ice sheet. Volcanism during this time
would have taken place in a subglacial environment and unsurprisingly does not feature in the postglacial subaerial record. Evidence from subglacial volcanic units (tuyas) erupted during this time period (Hartley et al., 2016) suggests volumetric and compositional trends consistent with those predicted by our model (Figures 3c and 4).
Forcing our model with the long-term 120-ka ice sheet history produces a periodic fluxing of CO2from
Icelandic volcanoes due to ice loss events over this period, implying a close link between ice dynamics and magmatic out-gassing. The greatest release of CO2, however, occurred during the period of ice loss just before the Younger Dryas (∼14 ka), and therefore before the largest phase of late-Pleistocene deglaciation (Figure 4). The concentration of CO2released in this magmatic pulse was enhanced due to the lack of any
significant loss of ice volume since ∼40 ka. This created a magmatic system capable of fluxing large volumes of carbon during the initial period of post-LGM deglaciation (both models M1 and M2; Figure 3e), possibly contributing to the increased atmospheric CO2levels thought to be recorded between 15 and 14 ka in the EPICA Dome C ice core (Köhler et al., 2011). It is therefore possible that this pulse of magmagenic CO2, from Iceland and elsewhere (e.g., Huybers & Langmuir, 2009), bolstered the climate warming, and final phase of deglaciation that proceeded the Younger Dryas.
The CO2flux due to deglaciation is strongly influenced by the ice sheet history. Mantle CO2flux does not follow a linear relationship with eruption rates: large peaks in CO2are also predicted for periods in time when the volume flux is not very high (Figures 2d and 3e). In effect we cannot conclude that all deglaciation events, or other rapid unloading events due to, for example, erosion (e.g., Sternai et al., 2016), lead to a large flux of volatile gasses into the Earths atmosphere.
Geophysical Research Letters
10.1029/2019GL081955
Supporting Information
A detailed discussion of the methodology can be found in the supporting information.
References
Burley, J. M. A., & Katz, R. F. (2015). Variations in mid-ocean ridge CO2emissions driven by glacial cycles. Earth and Planetary Science Letters, 426, 246–258. https://doi.org/10.1016/j.epsl.2015.06.031
Crowley, J. W., Katz, R. F., Huybers, P., Langmuir, C. H., & Park, S. H. (2015). Glacial cycles drive variations in the production of oceanic crust. Science, 347, 1237–1240. https://doi.org/10.1126/science.1261508
Dasgupta, R., & Hirschmann, M. M. (2010). The deep carbon cycle and melting in Earth's interior. Earth and Planetary Science Letters, 298, 1–13. https://doi.org/10.1016/j.epsl.2010.06.039
Eason, D. E., Sinton, J. M., Gronvöold, K., & Kurz, M. D. (2015). Effects of deglaciation on the petrology and eruptive history of the Western Volcanic Zone, Iceland. Bulletin of Volcanology, 77(47). https://doi.org/10.1007/s00445-015-0916-0
Elliot, T., & Spiegelman, M. (2014). Melt migration in oceanic crustal production: A u-series perspective. In Treatise on Geochemistry (Second Edition) volume 4(2nd ed., pp. 543–581). Amsterdam: Elsevier. https://doi.org/10.1016/B978-0-08-095975-7.00317-X
Gee, M. A. M., Taylor, R. N., Thirwall, M., & Murton, B. J. (1998). Glacioisostacy controls chemical and isotopic characteristics of tholeiites from the Reykjanes Peninsula, SW Iceland. Earth and Planetary Science Letters, 164, 1–5.
Glazner, A. F., Manley, C. R., Marron, J. S., & Rojstaczer, S. (1999). Fire or ice: Anticorrelation of volcanism and glaciation in california over the past 800,000 years. Geophysical Research Letters, 26, 1759–1762. https://doi.org/10.1029/1999GL900333
Goes, S., Armitage, J. J., Harmon, N., Huismans, R., & Smith, H. (2012). Low seis mic velocities below mid-ocean ridges: Attenuation vs. melt retention. Journal of Geophysical Research, 117, B12403. https://doi.org/10.1029/2012JB009637
Hammond, W. C., & Humphreys, E. D. (2000). Upper mantle seismic wave velocity: Effects of realistic partial melt geometries. Journal of Geophysical Research, 105, 10,975–10,986.
Harmon, N., & Rychert, C. A. (2016). Joint inversion of teleseismic and ambient noise Rayleigh waves for phase velocity maps, an application to Iceland. Journal of Geophysical Research: Solid Earth, 121, 5966–5987. https://doi.org/10.1002/2016JB012934
Hartley, M. E., Thordarson, T., & de Joux, A. (2016). Postglacial eruptive history of the Askja region, North Iceland. Bulleting of Volcanology, 78(28). https://doi.org/10.1007/s00445-016-1022-7
Huybers, P., & Langmuir, C. H. (2009). Feedback between deglacation, volcanism, and atmospheric CO2. Earth and Planetary Science Letters, 286, 479–491. https://doi.org/10.1016/j.epsl.2009.07.014
Huybers, P., & Langmuir, C. H. (2017). Delayed CO2emissions from mid-ocean ridge volcanism as a possible cause of late-Pleistocene glacial cycles. Earth and Planetary Science Letters, 457, 238–249. https://doi.org/10.1016/j.epsl.2016.09.021
Jellinek, M. A., Mange, M., & Saar, M. O. (2004). Did melting glaciers cause volcanic eruptions in eastern california? probing the mechanisms of dike formation. Journal of Geophysical Research, 109, B09206. https://doi.org/10.1029/2004JB002978
Jenkins, J., Maclennan, J., Green, R. G., Cottaar, S., Deuss, A. F., & White, R. S. (2018). Crustal formation on a spreading ridge above a mantle plume: Receiver function imaging of the Icelandic crust. Journal of Geophysical Research: Solid Earth, 123, 5190–5208. https:// doi.org/10.1029/2017JB015121
Jull, M., & McKenzie, D. (1996). The effect of deglaciation on mantle melting beneath Iceland. Journal of Geophysical Research, 101(B10), 21,815–21,828.
Katz, R. F. (2008). Magma dynamics with the enthalpy method: Benchmark solutions and magmatic focusing at mid-ocean ridges. Journal of Petrology, 49, 2099–2121. https://doi.org/10.1093/petrology/egn058
Köhler, P., Knorr, G., Buiron, D., Lourantou, A., & Chappellaz, J. (2011). Abrupt rise in atmospheric CO2at the onset of the Bolling/Allerod: In-situ ice core data versus true atmospheric signals. Climate of the Past, 7, 473–486. https://doi.org/10.5194/cp-7-473-2011
Maclennan, J., Jull, M., McKenzie, D., Slater, L., & Gronvöld, K. (2002). The link between volcanism and deglaciation in Iceland. Geochemistry, Geophysics, Geosystems, 3(11), 1062. https://doi.org/10.1029/2001GC000282
Nordahl, H., & Ingólfsson, O. (2015). Collapse of the Icelandic ice sheet controlled by sea level rise? Arktos, 1, 1–13. https://doi.org/10. 1007/s41063-015-0020-x
Pagli, C., & Sigmundsson, F. (2008). Will present day glacier retreat increase volcanic activity? Stress induced by recent glacier retreat and its effect on magmatism at the Vatnajökull ice cap, Iceland. Geophysical Research Letters, 35, L09304. https://doi.org/10.1029/2008GL033510 Patton, H., Hubbard, A., Bradwell, T., & Schomackere, A. (2017). The configuration, sensitivity and rapid retreat of the Late Weichselian
Icelandic ice sheet. Earth-Science Reviews, 166, 223–245. https://doi.org/10.1016/j.earscirev.2017.02.001
Peltier, W. R. (2004). Global glacial isostacy and the surface of the ice-age Earth: The ICE-5G (VM2) model and grace. Annual Reviews of Earth and Planetary Science, 32, 111–149. (2004).
Pico, T., Creveling, J. R., & Mitrovica, J. X. (2017). Sea-level records from the U.S. mid-Atlantic constrain Laurentide Ice Sheet extent during Marine Isotope Stage 3. Nature Communications, 8(15621). https://doi.org/10.1038/ncomms15612
Rawson, H., Pyle, D. M., Mather, T. A., Smith, V. S., Fontjin, K., Lachowcyz, S. M., & Naranjo, J. A. (2016). The magmatic and eruptive response of arc volcanoes to deglaciation: Insights from southern Chile. Geology, 44, 251–254. https://doi.org/10.1130/G37504.1 Rosenthal, A., Hauri, E. H., & Hirschmann, M. M. (2015). Experimental determination of C, F, and H partitioning between mantle minerals
and carbonated basalt, CO2/Ba and CO2/Nb systematics of partial melting, and the CO2contents of basaltic source regions. Earth and Planetary Science Letters, 415, 77–87. https://doi.org/10.1016/j.epsl.2014.11.044
Saal, A. E., Hauri, E. H., Langmuir, C. H., & Perfit, M. R. (2002). Vapour undersaturation in primitive mid-ocean-ridge basalt and the volatile content of Earth's upper mantle. Nature, 419, 451–455. https://doi.org/10.1038/nature01073
Schmidt, P., Lund, B., Hieronymus, C., Maclennan, J., Arnadottir, T., & Pagli, C. (2013). Effects of present-day deglaciation in Iceland on mantle melt production rates. Journal of Geophysical Research: Solid Earth, 118, 3366–3379. https://doi.org/10.1002/jgrb.50273 Scott, D. R. (1992). Small-scale convection and mantle melting beneath mid-ocean ridges. In J. Phipps Morgan, D. K. Blackman, & J.
M. Sinton (Eds.), Mantle flow and melt generation at mid-ocean ridges, Geophysical Monograph Series (Vol. 71, pp. 327–352): American Geophysical Union.
Shorttle, O., & Maclennan, J. (2011). Compositional trends of icelandic basalts: Implications for short-length scale lithological heterogeneity in mantle plumes. Geochemistry, Geophysics, Geosystems, 12, Q11008. https://doi.org/10.1029/2011GC003748
Sigvaldson, G. E., Annertz, K., & Nilsson, M. (1992). Effect of glacier loading/ deloading on volcanism: postglacial volcanic production rate of the Dyngjufjöll area, central Iceland. Bulletin of Volcanology, 54, 385–392. https://doi.org/10.1007/BF00312320
Sinton, J., Grönvold, K., & Saemundsson, K. (2005). Postglacial eruptive history of the Western Volcanic Zone, Iceland. Geochemistry, Geophysics, Geosystems, 6, Q12006. https://doi.org/10.1029/2005GC001021
Acknowledgments
We would like to thank M. A. Mary Gee (The University of Western Australia) for sharing her Nb composition data from the Reykjanes Peninsula and Tamara Pico (Harvard University) for sharing her sea level curves. John J. Armitage acknowledges funding from an Agence Nationale de la Recherche (France), Acceul de Chercheurs de Haute Niveau, grant InterRift. Numerical computations were partly performed on the S-CAPAD platform, IPGP, France. The 1-D melting model is available from https://bitbucket. com/johnjarmitage/melt1d-icesheet/.
Geophysical Research Letters
10.1029/2019GL081955
Sternai, P., Caricchi, L., Castelltort, S., & Champagnac, J. D. (2016). Deglaciation and glacial erosion: A joint control on magma productivity by continental unloading. Geophysical Research Letters, 43, 1632–1641. https://doi.org/10.1002/2015GL067285
Wasylenki, L. E., Baker, M. B., Kent, A. J. R., & Stopler, E. M. (2003). Near-solidus melting of the shallow upper mantle: partial melting experiments on depleted peridotite. Journal of Petrology, 44, 116–1191.
References From the Supporting Information
Andersen, K. K., Azuma, N., Barnola, J. M., Bigler, M., Biscaye, P., Caillon, N., et al. (2004). High-resolution record of northern hemisphere climate extending into the last interglacial period. Nature, 431, 174–151. https://doi.org/10.1038/nature02805
Andrews, J. T. (2008). The role of the Iceland Ice Sheet in the North Atlantic during the late Quaternary: A review and evidence from Denmark Strait. Journal of Quaternary Science, 23, 3–20. https://doi.org/10.1002/jqs.1142
Armitage, J. J., Collier, J. S., Minshull, T. A., & Henstock, T. J. (2011). Thin oceanic crust and flood basalts: India-Seychelles breakup. Geochemistry, Geophysics, Geosystems, 12, Q0AB07. https://doi.org/10.1029/2010GC003316
Clark, P. U., Dyle, A. S., Shakun, J. D., Carlson, A. E., Clark, J., Wohlfarth, B., et al. (2009). The last glacial maximum. Science, 325, 710–714. https://doi.org/10.1126/science.1172873
Geirsdóottir, A. (2011). Pliocene and pleistocene glaciations of iceland: A brief overview of the glacial history. In J. Ehlers, P. L. Gibbard, & P. Hughes (Eds.), Quaternary glaciations—Extent and chronology, a closer look (Vol. 15, pp. 199–210). Amsterdam: Elsevier. https://doi. org/10.1016/B978-0-444-53447-7.00016-7
Gibson, S. A., & Geist, D. (2010). Geochemical and geophysical estimates of lithospheric thickness variation beneath galápagos. Earth and Planetary Science Letters, 300, 275–286. https://doi.org/10.1016/j.epsl.2010.10.002
Gurenko, A. A., & Chaussidon, M. (1995). Enriched and depleted primitive melts included in olivine from icelandic tholeiites: Origin by continuous melting of a single mantle column. Geochimica et Cosmochimica Acta, 59, 2905–2917.
Katz, R. F., Spiegelman, M., & Langmuir, C. H. (2003). A new parameterization of hydrous mantle melting. Geochemistry, Geophysics, Geosystems, 4(9), 1073. https://doi.org/10.1029/2002GC000433
Lambeck, K., & Chappel, J. (2001). Sea level change through the last glacial cycles. Science, 292, 679–686. https://doi.org/10.1126/science. 1059549
Lambeck, K., Rouby, H., Purcell, A., Sun, Y., & Sambridge, M. (2014). Sea level and global ice volumes from the Last Glacial Maximum to the Holocene. Proceedings of the National Academy of Sciences, 111, 15,296–15,303. https://doi.org/10.1073/pnas.141176211
McKenzie, D., & O'Nions, R. K. (1991). Partial melt distribution from inversion of rare earth element concentrations. Journal of Petrology, 32, 1021–1091.
Miller, K. J., Zhu, W., Montési, L. G. J., & Gaetani, G. A. (2014). Experimental quantification of permeability of partially molten mantle rock. Earth and Planetary Science Letters, 388, 273–282. https://doi.org/10.1016/j.epsl.2013.12.003
Ribe, N. M. (1985). The generation and composition of partial melts in the Earth's mantle. Earth and Planetary Science Letters, 73, 361–376. Silbeck, J. N. (1975). On the fluid dynamics of ridge crests. In Notes on the 1975 summer study program in geophysical fluid dynamics at the
woods hole oceanographic institution, 2, 113–122.
Sleep, N. H., & Snell, N. S. (1976). Thermal contraction and flexure of midcontinent and Atlantic marginal basins. Geophysical Journal of the Royal Astronomical Society, 45, 125–154.
Spiegelman, M. (1996). Geochemical consequences of melt transport in 2-D: The sensitivity of trace elements to mantle dynamics. Earth and Planetary Science Letters, 139, 115–132.
Spratt, R. M., & Lisiecki, L. E. (2016). A late Pleistocene sea level stack. Climate of the Past, 12, 1079–1092. https://doi.org/10.5194/ cp-12-1079-2016

![[PDF] Cours Complet Introduction à Merise pdf](data:image/gif;base64,R0lGODlhAQABAIAAAP///wAAACH5BAEAAAAALAAAAAABAAEAAAICRAEAOw==)