HAL Id: hal-00297659
https://hal.archives-ouvertes.fr/hal-00297659
Submitted on 5 Dec 2007
HAL is a multi-disciplinary open access
archive for the deposit and dissemination of
sci-entific research documents, whether they are
pub-lished or not. The documents may come from
teaching and research institutions in France or
abroad, or from public or private research centers.
L’archive ouverte pluridisciplinaire HAL, est
destinée au dépôt et à la diffusion de documents
scientifiques de niveau recherche, publiés ou non,
émanant des établissements d’enseignement et de
recherche français ou étrangers, des laboratoires
publics ou privés.
leaves
P. Harley, J. Greenberg, Ü. Niinemets, A. Guenther
To cite this version:
P. Harley, J. Greenberg, Ü. Niinemets, A. Guenther. Environmental controls over methanol emission
from leaves. Biogeosciences, European Geosciences Union, 2007, 4 (6), pp.1083-1099. �hal-00297659�
www.biogeosciences.net/4/1083/2007/ © Author(s) 2007. This work is licensed under a Creative Commons License.
Biogeosciences
Environmental controls over methanol emission from leaves
P. Harley1, J. Greenberg1, ¨U. Niinemets2, and A. Guenther1
1Atmospheric Chemistry Division, National Center for Atmospheric Research, Boulder, Colorado, USA 2Institute of Agricultural and Environmental Sciences, Estonian University of Life Sciences, Tartu, Estonia
Received: 31 July 2007 – Published in Biogeosciences Discuss.: 6 August 2007
Revised: 5 November 2007 – Accepted: 20 November 2007 – Published: 5 December 2007
Abstract. Methanol is found throughout the troposphere, with average concentrations second only to methane among atmospheric hydrocarbons. Proposed global methanol bud-gets are highly uncertain, but all agree that at least 60% of the total source arises from the terrestrial biosphere and primary emissions from plants. However, the magnitude of these emissions is also highly uncertain, and the environmen-tal factors which control them require further elucidation.
Using a temperature-controlled leaf enclosure, we mea-sured methanol emissions from leaves of six plant species by proton transfer reaction mass spectrometry, with simul-taneous measurements of leaf evapotranspiration and stom-atal conductance. Rates of emission at 30◦C varied from 0.2 to 38 µg g (dry mass)−1h−1, with higher rates measured on young leaves, consistent with the production of methanol via pectin demethylation in expanding foliage. On average, emissions increased by a factor of 2.3 for each 10◦C increase in leaf temperature. At constant temperature, emissions were also correlated with co-varying incident photosynthetic pho-ton flux density and rates of stomatal conductance. The data were analyzed using the emission model developed by Ni-inemets and Reichstein (2003a, b), with the incorporation of a methanol production term that increased exponentially with temperature. It was concluded that control of emis-sions, during daytime, was shared by leaf temperature and stomatal conductance, although rates of production may also vary diurnally in response to variations in leaf growth rate in expanding leaves. The model, which generally provided reasonable simulations of the measured data during the day, significantly overestimated emissions on two sets of mea-surements made through the night, suggesting that produc-tion rates of methanol were reduced at night, perhaps because leaf growth was reduced or possibly through a direct effect of light on production. Although the short-term dynamics
Correspondence to: P. Harley
of methanol emissions can be successfully modeled only if stomatal conductance and compound solubility are taken into account, emissions on longer time scales will be determined by rates of methanol production, controls over which remain to be investigated.
1 Introduction
In the last decade, development of new instrumentation has fostered the measurement of oxygenated volatile organic compounds (OVOC) in the troposphere. Singh et al. (1995) measured significant quantities of OVOC over the Pacific, dominated by methanol (400 to 700 ppt) and acetone (200 to 500 ppt). Intensive aircraft measurements in the last decade have confirmed the magnitude of methanol, average con-centrations of which are second only to CH4 among atmo-spheric hydrocarbons. Concentrations in the remote tropo-sphere range from 0.1 to 1.1 ppbv (Heikes et al., 2002; Singh et al., 2004), with values in the continental boundary layer up to 10 times higher. Methanol oxidation is a significant source of formaldehyde in the remote troposphere and the continen-tal boundary layer, as well as carbon monoxide (4–6% of the global total). It is thought to play a small but signifi-cant role in the tropospheric oxidant balance, reducing tropo-spheric levels of hydroxyl radical by approx. 2% (Tie et al., 2003), although proposed heterogeneous reactions involving methanol and the hydroxyl radical (Tabadazeh et al., 2004) would enhance its importance. Jacob et al. (2005) suggested “a minor but non-negligible role for methanol in global tro-pospheric chemistry”.
A number of investigators have attempted to construct an-nual global budgets for methanol (Singh et al., 2000; Heikes et al., 2002; Galbally and Kirstine, 2002; Tie et al., 2003; von Kuhlmann et al., 2003; summarized in Jacob et al., 2005). Considerable uncertainties remain with respect to both sources and sinks, resulting in a wide range of global
estimates, and varying degrees of budget closure. Mean es-timates of total source strength in these studies range from 122 to 350 Tg y−1, while those of total sinks range from 40 to 270 Tg y−1. A similar range of variation is associated with the magnitude of the methanol source arising from direct emissions from living plant biomass, with mean estimates ranging from 75 to 280 Tg y−1. In all cases, however, di-rect emissions from plants constituted the major source of methanol to the atmosphere, ranging from 60 to 80% of the total source strength. This value is consistent with the results of Shim et al. (2007) who applied the positive matrix fac-torization method to chemical concentration measurements made during two aircraft campaigns over the Pacific Ocean (TRACE-P and PEM-Tropics B), and assigned 80–88% of the measured methanol to their “terrestrial biogenic” factor.
Methanol comprises a significant fraction of the total VOC emissions measured above a variety of different ecosystems, generally exceeding emissions of all other VOC except ter-penoids. Using a variety of techniques (static enclosures, relaxed eddy accumulation, eddy covariance), canopy-scale fluxes of methanol have been measured above grasslands (Fukui and Doskey, 1998; Kirstine et al., 1998; Brunner et al., 2007), crops (Das et al., 2003; Warneke et al., 2002; Custer and Schade, 2007), coniferous forests (Baker et al., 2001; Karl et al., 2002), pine plantations (Schade and Gold-stein, 2001; Karl et al., 2005), deciduous temperate forests (Karl et al., 2003; Spirig et al., 2005), and tropical forests (Geron et al., 2002; Karl et al., 2004). Results from these studies are summarized in Seco et al. (2007).
The major source of methanol from plants appears to be its release in the demethylation of pectin during cell wall expansion, a reaction catalyzed by the enzyme pectin methylesterase (PME) (Galbally and Kirstine, 2002). Sup-porting evidence is provided by recent isotope studies (Kep-pler et al., 2004) in which the methoxyl groups of pectin (and lignin) were shown to be exceptionally depleted in13C. Methanol emitted by plants was also anomalously depleted in13C, to approx. the same extent, strongly suggesting that the methoxyl pool associated with pectin is the predomi-nant source. Pectin is the major source of methanol from living biomass, but both pectin and lignin are expected to contribute to methanol emissions from soil litter (Fall and Benson, 1996) and biomass burning. It was recently demon-strated that PME activity in Salvia was stimulated by cater-pillar oral secretions, resulting in large increases in methanol emission (von Dahl et al., 2006). Methanol may also be re-leased during protein repair, but this probably represents a minor source (Fall and Benson, 1996). Potential sinks for methanol in or on the leaf include oxidation to formaldehyde (Gout et al., 2000) and metabolism by methylotrophic bac-teria which colonize leaves of many species in high num-bers and can exist solely on a methanol diet (Holland and Polacco, 1994). Neither of these potential sinks has been quantified, but both are assumed to be small (Galbally and Kirstine, 2002).
The first quantitative estimates of methanol emissions from plants were presented by MacDonald and Fall (1993). Emission rates from mature leaves of 14 species of trees, measured at 30◦C, varied substantially, ranging from 1.5 µg g−1h−1 to 15 µg g−1h−1. Highest rates (2.2 to 46 µg g−1h−1)were obtained from a variety of crop species. On average, rates were twice as high in young leaves. Sev-eral fold higher emissions from developing vs. mature leaves of cotton (Gossypium hirsutum), cottonwood (Populus
del-toides) and European beech (Fagus sylvatica) were reported
by H¨uve et al. (2007), who also demonstrated in an ele-gant study that integrated daily emissions of methanol from
Populus leaves were strongly correlated with total daily leaf
growth.
Until recently, little has been published on the environ-mental controls over methanol emission from plants. Mac-Donald and Fall (1993) observed that methanol emissions were influenced by rapid changes in stomatal conductance (gs). This behavior was confirmed by Nemecek-Marshall et al. (1995), who also observed large bursts of methanol fol-lowing dark/light transitions, as did H¨uve et al. (2007). By contrast, VOC such as isoprene or α-pinene are unaffected by large and rapid decreases in stomatal conductance (Fall and Monson 1992). This apparent anomaly was explained by Ni-inemets and Reichstein (2003a) who developed a model of VOC emission from plants that incorporates effects of com-pound solubility and successfully explains the observed dif-ferential responses of various VOC to stomatal closure.
The model, exhaustively described previously (Niinemets and Reichstein, 2002, 2003a, b) assumes that methanol is produced at some prescribed rate in the cell walls. It diffuses in the liquid phase along a series of diffusion pathways until it reaches the outer surface of the cell walls and the inter-face between aqueous and gas phases. At that point, liquid to gas phase partitioning is determined by H , the Henry con-stant for methanol. Methanol in the gas phase diffuses into the substomatal cavity and then through the stomata and leaf boundary layer to the ambient air. Diffusion of gas phase methanol from the intercellular air space to the air outside the leaf boundary layer, i.e., the rate of emission, follows Fick’s law, and is proportional to the methanol partial pres-sure difference and the total gas phase conductance.
Assuming constant rates of VOC production, any change in gs is countered by corresponding, but opposite, changes in the gas and liquid pools, resulting in a change in the partial pressure gradient exactly proportional, but op-posite in sign, to the change in conductance. Hence, there is no alteration in the methanol flux. For largely insoluble isoprene (H @25◦C=7780 Pa m3mol−1) and α-pinene (H @25◦C=10 840 Pa m3mol−1), a new steady-state gas pool is re-established in a matter of seconds follow-ing any perturbation (Niinemets and Reichstein, 2003a) and stomata cannot limit the flux (Fall and Monson, 1992; Loreto et al., 1996). However, highly soluble methanol (H @25◦C=0.461 Pa m3mol−1) partitions strongly into the
liquid phase, and a large increase in liquid pool size follow-ing stomatal closure is required before gas partial pressures rise sufficiently to completely counteract the reduced con-ductance. Once a new equilibrium is reached, the original flux is restored, but during this extended transition period to a new equilibrium state, stomata may have a significant im-pact on observed emissions.
All other things being equal, the extent to which stom-ata limit the flux of a given VOC is determined largely by
H. However, several other factors can also influence the time needed for re-equilibration of the leaf pools, helping to explain observed differences in stomatal sensitivity between species or for a given leaf at different times. As shown by Ni-inemets and Reichstein (2003b), the time for re-equilibration is affected slightly by the magnitude of various liquid and gas phase resistances within the leaf, and more significantly by the amount of liquid water within the leaf into which methanol can partition. As the amount of water increases, the time needed for pool equilibration also increases. The time needed for re-equilibration of the liquid methanol pool also increases as values of gs decline; i.e., leaves with lower rates of stomatal conductance spend more time in non-steady state situations, and methanol emissions are more likely to be limited by gs. Thus, the extent to which changes in stomatal conductance affect emissions is influenced by the magnitude of stomatal conductance, the rate at which stomata open or close, and by internal leaf anatomy, which determines resis-tances to intercellular diffusion in both gas and liquid phase, and also establishes the potential liquid pool size.
The detailed model of Niinemets and Reichstein treats these factors explicitly, and short-term patterns of emis-sions are generally well described through the interaction of methanol production rate, changes in the size of liquid and gas phase pools, and stomatal conductance. Comparison be-tween measured emission data and model predictions pro-vided convincing evidence that high solubility plays the key role in explaining stomatal sensitivity of methanol emissions. However, the data against which their model was tested were obtained under constant temperature and light, and in their simulations, both methanol production rates and stom-atal conductance were prescribed. If one wishes to model methanol emissions under naturally occurring conditions, it becomes necessary to predict rates of methanol production as well. In available methanol emission models, however, nei-ther production rates nor variation in stomatal conductance are well characterized.
The major goal of this paper is to establish the relative importance of leaf temperature and incident photosynthetic photon flux density (PPFD) on methanol production, and the importance of stomatal conductance in controlling emissions under varying light and temperature conditions. We first present representative examples of leaf-level methanol emis-sion data obtained from several plant species under a wide range of light and temperature conditions along with stom-atal conductance data collected concurrently. Since stomstom-atal
conductance itself varies in response to PPFD and tempera-ture, separating the direct effects of these drivers on methanol production from indirect effects via changes in stomatal con-ductance is challenging. To facilitate this process, we evalu-ate the data sets against predictions of the model developed by Niinemets and Reichstein (2002, 2003a, b) and assess the suitability of the model for predicting methanol emissions under a range of environmental conditions.
2 Methods
Emissions of methanol were investigated in six plant species: two conifers, two broadleaved trees and two grasses. In-dividual saplings of loblolly pine (Pinus taeda) and grey pine (P. sabiniana) were obtained from Forest Farm Nurs-ery (Williams, OR) and those of mango (Mangifera indica) were obtained from Pine Island Nursery (Miami, FL). Young plants of cottonwood (Populus deltoides [S7c8 East Texas Day Neutral clone]) were generated from greenwood cut-tings taken from established plants growing in the Univ. of Colorado greenhouse. Plants of sorghum-sudangrass (Sorghum bicolor) and fescue (Festuca sp.) were grown from seed (Rocky Mountain Seed Co, Denver CO). Plants were re-potted into 4-L plastic pots containing a commercial potting mix (MiracleGro) and maintained in the NCAR Frost Phy-totron. Osmocote slow release fertilizer was applied to pots of all trees, and the grasses were fertilized monthly with Pe-ter’s Professional Plant Food (20N-20P-20K).
Intact leaves or needles were enclosed in a flow-through, temperature-controlled, fan-stirred leaf cuvette (MPH-1000, Campbell Scientific, Logan, UT), while the rest of the plant experienced laboratory conditions of relatively low light and approximately 20◦C. Air entering the 400 ml cuvette con-sisted of zero air (Model 737, Pure Air Generator, AADCO Instruments, Inc., Clearwater, FL), further purified by flow-ing through a palladium catalyst maintained at 300◦C, and mixed with 1% CO2 in air to a final CO2concentration of approximately 400 ppm. Incoming air was humidified to the desired dew point by routing a fraction of the zero air through a glass bubbler containing de-ionized water. All mixing flows were controlled using mass flow controllers (Model 825, Edwards High Vacuum International, Wilming-ton, MA) and the flow rate of air entering the cuvette was measured with a mass flow meter (Model 831, Edwards High Vacuum International). Leaf or chamber temperature was controlled (±0.3◦C) using thermoelectric coolers, and light was provided by a 1000-W high intensity metal halide dis-charge lamp (Sylvania MS1000-M47). CO2 and H2O va-por in air exiting the leaf cuvette were measured by infrared gas analyzer (LI-6262, Li-Cor, Lincoln, NE) and a portion of the air was directed to the inlet of a proton transfer reac-tion mass spectrometer (PTR-MS) for analysis of methanol. After being measured, plant tissue inside the cuvette was ex-cised. For broad-leaved species and grasses, leaf area was
estimated by tracing the leaf outline onto construction paper of known mass per unit area (g m−2)and then cutting and weighing the outline. For all species, measured leaf tissue was oven-dried (70◦C) for a minimum of 24 h and dry mass (g) determined. Experimental leaves were not sterilized, and the potential impact of methylotrophic bacteria residing on the leaf surface was not considered.
Methanol concentrations were measured using proton transfer reaction mass spectrometry (MS). The PTR-MS used in this study, designed and built at NCAR and fully described in Hanson et al. (2003), consists of an ion source (a radioactive strip of241Am [NRD Incorporated, Grand Is-land, NY]), a drift tube 8.8 cm in length, and a mass selec-tive quadrupole detector. Hydronium ions (H3O+)served as reagent ions. As sample air passes through a drift tube, those VOC with a greater proton affinity than H3O+accept a pro-ton and are passed on to the quadrupole mass detector. This PTR-MS was designed to operate at higher drift tube pres-sures (≈10 Torr) than commercially available PTR-MS sys-tems, conferring increased sensitivity (Hanson et al., 2003).
When normalized to 1 MHz of primary reagent signal, PTR-MS sensitivity to a given target compound remains con-stant as long as the geometry of the drift tube and operat-ing conditions are unchanged. However, over the course of these experiments, slight modifications in the operating con-ditions of the PTR-MS were carried out in an attempt to op-timize performance. As a result, daily calibrations were car-ried out, using a high-pressure cylinder prepared gravimet-rically at NCAR and containing 4.0 ppmv (±5%) methanol. Air from the high concentration standard was serially diluted using humidified zero air to generate a final concentration of 27 ppbv. A calibration using this diluted standard was carried out at least once a day. As noted in Hanson et al. (2003), the sensitivity to methanol decreases with humidity, presumably due to back reactions (i.e., proton transfer back to H3O+) at high humidities. Several calibrations over the course of the experiment were carried out while varying the dew point of the calibration stream, allowing us to develop an empiri-cal vapor pressure correction for methanol sensitivity. Vapor pressures in the experiments reported here varied over the range 9 to 21 mbar, resulting in a 23% variation in sensitivity to methanol.
Initial tests of the integrated leaf cuvette and PTR-MS sys-tem indicated background concentrations of methanol sig-nificantly greater than zero. These background levels de-creased gradually over time, and maintaining a flow of zero air through the cuvette at all times kept these background levels to a minimum. Despite these precautions, background levels could not be neglected. Thus, for all data reported be-low, following removal of an experimental leaf, the methanol signal arising from the empty cuvette was recorded and sub-tracted from all leaf measurements. At 30◦C, this correction averaged approximately 200 pptv.
Rates of transpiration, stomatal conductance (gs) and methanol emission were calculated based on
concentra-tion difference between air entering and leaving the cu-vette (nmol mol−1)and the flow rate through the enclosure (mol s−1), corrected for the increased mass flow exiting the chamber due to transpiration (von Caemmerer and Farquhar, 1981). All methanol emission rates are expressed on a per unit dry mass basis (µg methanol g−1 dry mass h−1), but values of leaf mass per unit area (LMA, g m−2)are provided for broad-leaved species (Table 1) to allow conversion to area based units. Rates of stomatal conductance and rates of tran-spiration are expressed as mmol H2O m−2s−1 and mmol H2O g−1 h−1 for broad-leaved species and pines, respec-tively.
We chose to evaluate our data in the context of the VOC emissions model developed by Niinemets and Reichstein, pa-rameterized specifically for methanol. Full parameterization of the Niinemets-Reichstein model requires assigning val-ues to a large number of parameters describing internal leaf anatomy, gas and liquid phase conductance pathways within the leaf, and physico-chemical characteristics of the com-pound of interest. To describe the physico-chemical charac-teristics of methanol, we use the values and temperature de-pendencies given in Niinemets and Reichstein (2003b). Leaf anatomy and internal diffusion pathways vary between vege-tation species. Lacking detailed anatomical information, we used published parameterizations (Niinemets and Reichstein, 2003b), that of Pinus sylvestris for our two pine species, and that of Phaseolus vulgaris for the grasses. Rather than use the parameterization developed for Quercus ilex, a mediter-ranean sclerophyllous tree, we follow the example of Ni-inemets and Reichstein (2003a), and use averaged anatom-ical characteristics of Q. ilex and Phaseolus as the default parameterization for our broadleaf trees, mango and cotton-wood. While we recognize that none of these represents a perfect match for the species under consideration, sensitiv-ity analyses (Niinemets and Reichstein, 2003b) demonstrated that large differences in most leaf anatomical features had only a minor effect on model behavior. The major excep-tion is the size of the water pool into which methanol parti-tions,which has a large impact on the magnitude of emission bursts and influences the time needed for the liquid pool to equilibrate and thus the extent to which stomata limit emis-sions.
The Niinemets-Reichstein model has not heretofore incor-porated variations in the rate of production, controls over which are not well characterized, either in the short-term (minutes) or over periods of hours to days. Data presented below indicate that methanol emissions increase exponen-tially with leaf temperature (Fig. 5), and we assume that this reflects the temperature dependence of methanol production. Production (Pm)in the model is assumed to increase expo-nentially,
Pm=Pm30×exp(β∗[Tleaf−30]) (1)
where Pm30 is the rate of methanol production at 30◦C and the rate of exponential increase is determined by the value
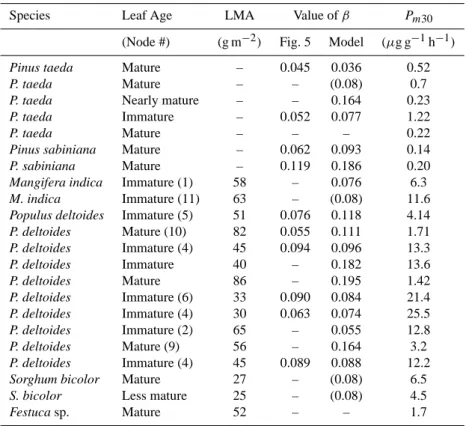
Table 1. Summary of leaf-level measurements carried out during this study. Values of β were estimated for individual temperature response curves shown in Fig. 5. Values of β and Pm30determined by least squares fit to the Niinemets-Reichstein model are also shown. In cases where temperature variation in the measured data was insufficient to determine a value of β, the mean value of 0.08 was used. Values of leaf mass per unit area (LMA, g m−2)are provided for broad-leaved species and grasses to allow conversion to area-based units.
Species Leaf Age LMA Value of β Pm30
(Node #) (g m−2) Fig. 5 Model (µg g−1h−1)
Pinus taeda Mature – 0.045 0.036 0.52
P. taeda Mature – – (0.08) 0.7
P. taeda Nearly mature – – 0.164 0.23
P. taeda Immature – 0.052 0.077 1.22
P. taeda Mature – – – 0.22
Pinus sabiniana Mature – 0.062 0.093 0.14
P. sabiniana Mature – 0.119 0.186 0.20
Mangifera indica Immature (1) 58 – 0.076 6.3
M. indica Immature (11) 63 – (0.08) 11.6
Populus deltoides Immature (5) 51 0.076 0.118 4.14
P. deltoides Mature (10) 82 0.055 0.111 1.71 P. deltoides Immature (4) 45 0.094 0.096 13.3 P. deltoides Immature 40 – 0.182 13.6 P. deltoides Mature 86 – 0.195 1.42 P. deltoides Immature (6) 33 0.090 0.084 21.4 P. deltoides Immature (4) 30 0.063 0.074 25.5 P. deltoides Immature (2) 65 – 0.055 12.8 P. deltoides Mature (9) 56 – 0.164 3.2 P. deltoides Immature (4) 45 0.089 0.088 12.2
Sorghum bicolor Mature 27 – (0.08) 6.5
S. bicolor Less mature 25 – (0.08) 4.5
Festuca sp. Mature 52 – – 1.7
assigned to β.
Although there is new and convincing evidence that diur-nal variation in growth rate of expanding leaves leads to vari-ations in rates of methanol production (H¨uve et al., 2007), these effects are not yet sufficiently well characterized to incorporate into the model. Similarly, despite data raising the possibility of reduced rates of production at night (e.g., Fig. 14), we lack convincing evidence of a direct effect of varying PPFD on methanol production, and effects of vary-ing light in the model are mediated via PPFD controls over gs. Although not currently included in the model, the po-tential effects of varying leaf expansion rates and/or direct effects of PPFD on methanol production rates should be kept in mind, as they may help explain some observed discrepan-cies between measurements and model predictions presented below.
For each of the data sets presented below, we applied model fits using the default parameterizations provided by Niinemets and Reichstein (2003a). The Solver function in Microsoft Excel was used to iterate for the best-fit values of
Pm30and β (Eq. 1), values of which are given in each figure caption and listed in Table 1. Our aim was to evaluate the suitability of the model for simulating methanol emissions
for several species and over a wide range of light, temper-ature and measured stomatal conductance. Examining each data set in the context of the model also sheds light on the relative contributions of temperature and gs in determining emissions, as well as the possibility of a direct influence of PPFD.
3 Results
Methanol emission measurements were made concurrently with measurements of net photosynthesis and transpiration for several tree species: loblolly pine (Pinus taeda), grey pine (P. sabiniana), cottonwood (Populus deltoides), mango (Mangifera indica) and two grasses, sorghum-sudangrass (Sorghum bicolor) and fescue (Festuca sp.). Measurements on a given leaf or set of needles were made over several hours, occasionally over several days, and in general, in-cident PPFD and leaf temperature were varied over a wide range. These measurements are summarized in Table 1.
Early in the course of these experiments, it became clear that short-term controls over methanol emissions were not straightforward. Incident PPFD and leaf temperature, which alone or in combination largely control short-term variation
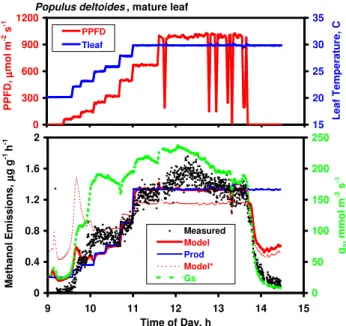
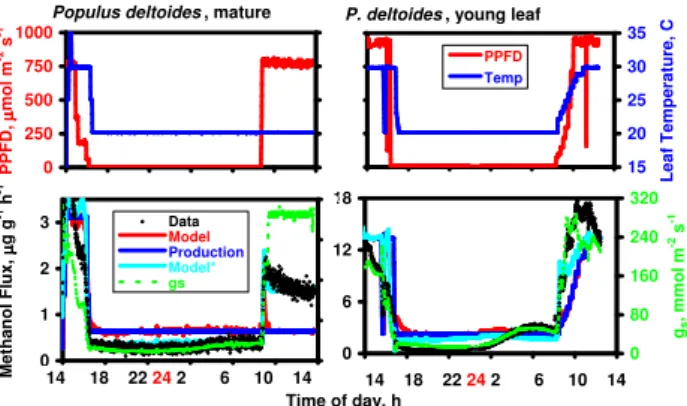
Populus deltoides, young leaf 0 500 1000 1500 9 10 11 12 13 14 15 16 P P F D , µµµµ m o l m -2 s -1 15 20 25 30 35 L e a f T e m p e ra tu re , C PPFD Temp 0 40 80 120 160 9 10 11 12 13 14 15 16 M e th a n o l F lu x , µµµµ g g -1 h -1 0 100 200 300 gs , mmo l m -2 s -1 Data Model Prod Model* gs 0 10 20 30 40 9 10 11 12 13 14 15 16 Time of Day, h L iq u id P o o l, µµµµ m o l m -2 0 0.3 0.6 0.9 1.2 G a s P o o l, n m o l m -2 Liquid Pool Liquid Pool* Gas Pool Gas Pool*
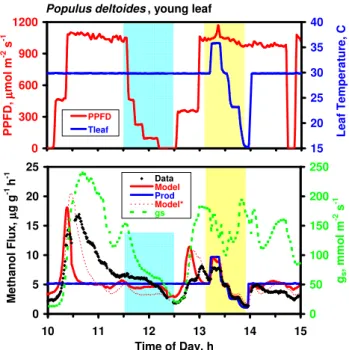
Fig. 1. Methanol emission data measured over a six-hour period on an immature leaf of Populus deltoides. Top panel: Incident PPFD and measured leaf temperature. Middle panel: Measured rates of methanol emissions and stomatal conductance, and rates of methanol production and methanol emissions predicted by the Niinemets-Reichstein model. Emissions predicted using the default broadleaf parameterization (in the absence of temperature varia-tion in the light, β was set to 0.08; Pm30=38.1 µg g−1h−1) are shown in solid red line; those predicted assuming a pool of liq-uid water four times that of the default parameterization (β=0.08; Pm30=35.7 µg g−1h−1) are shown in dashed red line. Bottom panel: Modeled aqueous and gas phase pools of methanol within the leaf for the default case (solid lines) and those predicted assum-ing four times the liquid water within the leaf (dashed lines). It has come to our attention that those suffering from various forms of color blindness may have difficulty interpreting this and other figures; we encourage them to contact the corresponding author for clarification.
of isoprene and monoterpene fluxes (Kesselmeier and Staudt, 1999), were inadequate to fully explain short-term or di-urnal variations in the emissions of methanol. Although in certain situations methanol emission responded to varia-tions in both PPFD and temperature, there was clearly an-other level of short-term control. Previous studies (Mac-Donald and Fall, 1993; Nemecek-Marshall et al., 1995) had clearly demonstrated that, under certain circumstances, stomata could strongly limit methanol emissions, and we ex-amined whether such effects were evident in our data and, if
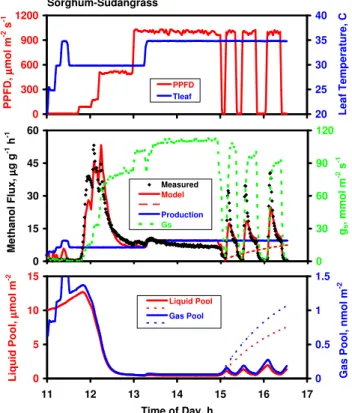
Sorghum-Sudangrass 0 300 600 900 1200 11 12 13 14 15 16 17 P P F D , µµµµ mo l m -2 s -1 20 25 30 35 40 L e a f T e mp e ra tu re , C PPFD Tleaf 0 15 30 45 60 11 12 13 14 15 16 17 M e th a n o l F lu x , µµµµ g g -1 h -1 0 30 60 90 120 gs , mmo l m -2 s -1 Measured Model Series2 Production Gs 0 5 10 15 11 12 13 14 15 16 17 Time of Day, h L iq u id P o o l, µµµµ mo l m -2 0 0.5 1 1.5 G a s P o o l, n mo l m -2 Liquid Pool Series1 Gas Pool Series2
Fig. 2. Methanol emission data measured over five and a half hours on a leaf of Sorghum bicolor. Top panel: Incident PPFD and mea-sured leaf temperature. Middle panel: Meamea-sured rates of methanol emissions and stomatal conductance, and rates of methanol produc-tion and methanol emissions predicted by the Niinemets-Reichstein model using the default parameterization for Phaseolus vulgaris (in the absence of significant temperature variation, β was set to 0.08; Pm30=6.5 µg g−1h−1). Dashed red line represents modeled emis-sions if stomata are assumed to remain closed following closure at 15:00 h. Bottom panel: Modeled aqueous and gas phase pools of methanol within the leaf (solid lines). Dashed lines represent mod-eled pool sizes if stomata are assumed to remain closed following 15:00 h.
so, the extent to which they obscured possible effects of light or temperature.
Figure 1 depicts methanol emission data from an expand-ing leaf of Populus deltoides, along with light and tempera-ture data and measured stomatal conductance. Prior to 11:00, the leaf was in the dark, and both gs and methanol emis-sions were low. At approx. 11:00, the light was turned on, resulting in rapid stomatal opening accompanied by an ex-tremely large burst of methanol emission that reached a max-imum rate exceeding 120 µg g−1h−1and persisted for about an hour. With light and leaf temperature then held constant, methanol emissions remained fairly stable at rates between 30 and 40 µg g−1h−1, presumably reflecting the steady-state rate of production. Following 14:30, PPFD was gradually re-duced to zero, resulting in parallel declines in both methanol release and gs.
Another case of stomatal control over emissions is illus-trated in Fig. 2, depicting data from a leaf of Sorghum
bi-color, the stomata of which respond very rapidly to changes
in PPFD. In addition to the characteristic burst of emissions upon illumination in the morning, a series of light/dark/light transitions in the afternoon illustrate the extent to which methanol emissions can respond to changes in stomatal aperture. While leaf temperature was maintained constant at 35◦C, the light was turned off for periods of 6.5, 8.1 and 13.2 min. Each time the light fell to zero, stomata responded rapidly, values of gs dropping from >100 to
<5 mmol m−2s−1 in less than 6 min; methanol emissions dropped in parallel to near zero. Each time the light was turned on again, stomata began to re-open almost immedi-ately, accompanied by a burst of methanol emission, which reached values significantly higher than the steady-state val-ues prior to the onset of darkness. The magnitude of the burst generally increased as the amount of time spent in darkness increased.
Model fits to the data are included in Figs. 1 and 2 (red line; note that in the absence of significant temperature vari-ation, we used a value of β=0.08 and iterated only for Pm30). For the expanding leaf of cottonwood (Fig. 1), the model predicts the observed burst of methanol emission following stomatal opening in the morning, as well as the decline in emissions as PPFD was gradually reduced in the late after-noon. However, neither the magnitude and dynamics of the morning burst nor the rate of decline in the afternoon were well captured by the model. A model fit to the Sorghum data in Fig. 2 captures reasonably well both the early morn-ing methanol burst and the afternoon dynamics of emissions during the sequence of light/dark/light transitions. However, the model underestimates the maximum rate of emissions ob-served during rapid stomatal reopening in the afternoon. Al-though both of these simulations fail to capture accurately the magnitude and precise dynamics of the observed emis-sion bursts, in a qualitative sense, they describe the observed behavior quite well, confirming the potential short-term con-trol by stomata of emissions of highly soluble VOC such as methanol.
Note that both the observed morning burst of methanol and the declines in methanol emission when the light was turned off and subsequent bursts of emission on re-illumination are generated in the model simply by the interaction of stomatal conductance and the partitioning of methanol between gas and liquid pools as determined by Henry’s law constant. To illustrate the importance of pool dynamics, changes in the methanol pool sizes predicted by the model are shown in the bottom panels of Figs. 1 and 2. The bursts of emission in the morning result from the large buildup of leaf methanol pools overnight, followed by rapid increases in gsupon illu-mination. The burst continues until pools are depleted. The magnitude of the early morning methanol burst is thus largely determined by overnight rates of production and gs, as well as by the overall size of the water pool into which methanol
Populus deltoides, young leaf
0 300 600 900 1200 10 10.5 11 11.5 12 12.5 13 13.5 14 14.5 15 P P F D , µµµµ mo l m -2 s -1 15 20 25 30 35 40 L e a f T e mp e ra tu re , C PPFD Tleaf 0 5 10 15 20 25 10 11 12 13 14 15 Time of Day, h M e th a n o l F lu x , µµµµ g g -1 h -1 0 50 100 150 200 250 gs , mmo l m -2 s -1 Data Model Prod Model* gs
Fig. 3. Methanol emission data measured over five hours on an immature leaf of Populus deltoides. Top panel: Incident PPFD and measured leaf temperature. Bottom panel: Mea-sured rates of methanol emissions and stomatal conductance, and rates of methanol production and methanol emissions predicted by the Niinemets-Reichstein model. Emissions predicted using the default parameterization (β=0.106; Pm30=5.24 µg g−1h−1)are shown in solid red line; those predicted assuming a pool of liq-uid water four times that of the default parameterization (β=0.155; Pm30=4.80 µg g−1h−1)are shown in dashed red line.
can partition. With rapid stomatal closure (Fig. 2) and the restriction of emissions, both liquid and gas phase pools im-mediately begin to increase. However, because methanol par-titions overwhelmingly to the liquid phase, gas phase con-centrations increase far too slowly in the short term to com-pensate for the decrease in stomatal conductance, with the result that methanol emissions decrease rapidly to near zero. Upon rapid stomatal re-opening, the elevated leaf pools are depleted in a short-term burst before emissions return to val-ues near the steady-state rates prior to stomatal closure.
Note that although rapid stomatal closure, as in Fig. 2 at 15:00, causes a rapid decline in methanol emissions both in the data and the model, modeled emissions will not remain depressed indefinitely, assuming that production continues. Following the initial drop in gs, we held gs constant in the model at the minimum measured value (5 mmol m−2s−1)for the next hour and a half. Modeled pools of both liquid and gas phase methanol slowly increased (dashed lines in bot-tom panel), leading to a gradual recovery of modeled emis-sions towards pre-closure values. This underscores the fact, stressed by Niinemets and Reichstein (2003a), that stomata cannot limit emissions in the steady-state, but only during the
S to m a ta l C o n d u c ta n c e , m m o l m -2 s -1 M e th a n o l E m is s io n F lu x , µµµµ g g -1 h -1 0 4 8 12 16 0 300 600 900 1200 PPFD, µµµµmol m-2 s-1 0 40 80 120 160 All MeOH 11:20-12:35 gs
Populus deltoides , immature leaf (Node 5)
A MeOH = 5.0*exp0.08*(T-30) 0 2 4 6 8 10 15 20 25 30 35 40 Leaf Temperature, C 0 50 100 150 200 250 13:10-14:00 All MeOH gs Expon. Fit B
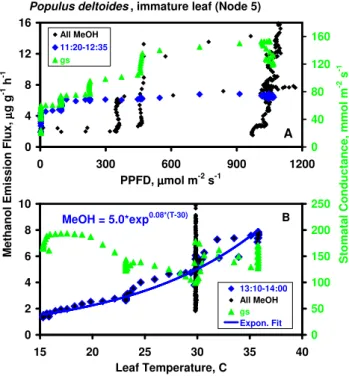
Fig. 4. Rates of methanol emission and stomatal conductance as a function of incident PPFD (top panel) and leaf temperature (bot-tom panel), re-plotted from the data in Fig. 3. Black symbols represent all methanol emission data in Fig. 3. Top panel: Blue and green symbols represent methanol and conductance data, re-spectively, collected between 11:20 and 12:35 (blue shaded area in Fig. 3) with leaf temperature constant at 30◦C. Bottom panel: Blue and green symbols represent methanol and conductance data col-lected between 13:10 and 14:00 (yellow shaded area in Fig. 3) with PPFD at approximately 1000 µmol m−2s−1. An exponential fit to the blue symbols is shown.
transition to new steady-state values following a significant perturbation.
Having confirmed the observation that gs can control methanol emissions under conditions of rapidly changing stomatal aperture, we sought to elucidate the potential im-portance of leaf temperature and PPFD in controlling emis-sions when stomata were in the steady state or gswas chang-ing only slowly. Figure 3, depictchang-ing 5 h of data collected from a young leaf of Populus deltoides, demonstrates a sig-nificant effect of environmental variables. Following the ex-pected burst when the light was turned on in the morning, methanol emissions gradually decayed over the next hour, during which time PPFD and leaf temperature remained con-stant at approx. 1050 µmol m−2s−1 and 30◦C. Due to the early morning burst/decay in emissions, which was largely independent of light and temperature, methanol emissions in the complete 5-h data set exhibit no unique relationship with either PPFD or temperature (Fig. 4). However, after the initial methanol burst subsided at approx. 11:20, emis-sions clearly responded to variations in both PPFD and leaf
Methanol Emission vs. Leaf Temperature
0 0.5 1 1.5 2 2.5 10 15 20 25 30 35 40 Leaf Temperature, C M e th a n o l F lu x , n o rm a li z e d Pg 5_23 Pg 5_24 Pg 5_29 Pg 8_5 Pg 8_8 Pg 8_23 Pt 10_4 Pt 12_19 Ps 11_8 Ps 11_12 Fit (beta=0.08) Fit (beta=0.075)
Fig. 5. MeOH emissions from ten leaves or sets of needles as a func-tion of leaf temperature (Pd: Populus deltoides; Pt: Pinus taeda; Ps:
P. sabiniana). Data from each data set were normalized to a value
of 1.0 at 30◦C. Values of β for each data set are shown in parenthe-ses in legend. Exponential fits to entire data set (β=0.082) and fit using mean value for all individual data sets (β=0.075) are shown.
temperature. Methanol emissions as a function of PPFD are plotted in Fig. 4a; between 11:30 and 12:30 (blue shading in Fig. 3), during which time leaf temperature remained con-stant at 30◦C, both methanol emissions and gsdeclined in re-sponse to decreasing PPFD, although the effect on emissions only became apparent at PPFD<150 µmol m−2s−1. Emis-sions versus leaf temperature data, including those collected between 13:10 and 14:00 (yellow shading in Fig. 3) when PPFD remained constant at approx. 1000 µmol m−2s−1, are shown in Fig. 4b. Included is an exponential fit to the data collected during this period; each 10◦C increase in tem-perature resulted in a 2.2-fold increase in emissions (i.e.,
Q10=2.2). The increase in methanol emissions as temper-ature increased is clearly not related to changes in gs, which decreased with increasing temperatures. The reduction in gs as light was reduced, however, generally paralleled de-clines in methanol emissions. Thus, the degree to which declining methanol emissions were a direct response to de-creasing light versus an indirect response to stomatal closure is ambiguous. The model fit to the data in Fig. 3 captures the salient features of the diurnal response but dramatically underestimates the duration of the early morning emission burst.
To further explore the relationship between methanol emissions and temperature, data similar to that in Fig. 4b, re-lating methanol emissions to leaf temperature at high PPFD (>750 µmol m−2s−1), were obtained on 10 different leaves or sets of needles. All data were collected after 11:00, fol-lowing any significant emission burst. This protocol can’t preclude stomatal limitation of emissions, but minimizes the stomatal contribution. All data were normalized to give a value of 1.0 at 30◦C, and the results are plotted in Fig. 5. An exponential increase in methanol emissions with temperature appears to be a general response, with the relationship being
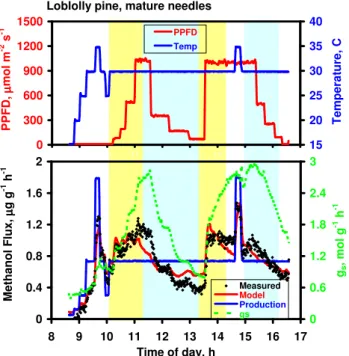
Loblolly pine, mature needles 0 300 600 900 1200 1500 8 9 10 11 12 13 14 15 16 17 P P F D , µµµµ m o l m -2 s -1 15 20 25 30 35 40 T e m p e ra tu re , C PPFD Temp 0 0.4 0.8 1.2 1.6 2 8 9 10 11 12 13 14 15 16 17 Time of day, h M e th a n o l F lu x , µµµµ g g -1 h -1 0 0.6 1.2 1.8 2.4 3 gs , m o l g -1 h -1 Measured Model Production gs
Fig. 6. Methanol emission data measured over eight hours on ma-ture needles of Pinus taeda. Top panel: Incident PPFD and mea-sured temperature. Bottom panel: Measured rates of methanol emissions and stomatal conductance, and rates of methanol produc-tion and methanol emissions predicted by the Niinemets-Reichstein model. Emissions predicted using the default parameterization (β=0.18; Pm30=0.22 µg g−1h−1)are shown in solid red line.
well described by,
Em(normalized) = exp(β∗[Tleaf−30]) (2) The value of β that best fits the entire data set is 0.082, similar to the value of 0.09 often used to describe the tem-perature response of monoterpene emissions (range 0.057– 0.144; Guenther et al., 1993) and corresponding to a Q10 of 2.3. If each of the 10 data sets is fit independently to Eq. (2), the values of β range from 0.045 to 0.119 (Mean
±sd=0.075±0.023), comparable to the range of estimates for monoterpene emissions.
The relationship between PPFD, gs and methanol emis-sions is further examined in Fig. 6, using data obtained from mature needles of loblolly pine. Following light on at about 10:00, temperature was constant at 30◦C for 6.5 h (except for a brief excursion at 14:45) and PPFD was varied. Both gs and methanol flux generally tracked changes in PPFD, but again the extent to which stomata control the flux is unclear. If methanol emissions are plotted against both PPFD and gs, however, a clearer picture emerges (Fig. 7). The correla-tion between methanol flux and PPFD is apparent, but fairly weak. In contrast, the correlation with gs is strong, although two distinct relationships appear, depending on whether gs was increasing (yellow shading in Fig. 6) or decreasing (blue shading). Methanol is linearly related to gs during periods
0 0.3 0.6 0.9 1.2 1.5 0 300 600 900 1200 PPFD, µµµµmol m-2 s-1 PPFD increasing PPFD decreasing 0 0.3 0.6 0.9 1.2 1.5 0 1 2 3 gs, mol g-1 h-1 M e th a n o l F lu x , µµµµ g g -1 h -1 gs increasing gs decreasing
Fig. 7. Methanol emissions data from Fig. 6 re-plotted as a func-tion of stomatal conductance (left panel) and incident PPFD (right panel). Only data collected at a leaf temperature of 30◦C are plot-ted, and data are segregated according to whether PPFD and gs were increasing (yellow shaded areas in Fig. 6) or decreasing (blue shaded areas in Fig. 6).
of both increasing and decreasing PPFD and gs. However, at a given value of gs, methanol emissions are higher when stomata are opening, consistent with the emptying of liquid phase methanol pools that accumulate during periods of low stomatal conductance.
When a model fit was applied, predictions tracked well with measured emissions and with gs, exceeding rates of pro-duction when stomata were opening and falling below rates of production when stomata were closing. During periods of decreasing gs, predicted emissions decreased linearly with conductance, but the fit to the data represented a compro-mise, overestimating in some regions and underestimating in others. Although emissions deviated in the short term from modeled production rates, the methanol produced in the model, integrated over the 7.5 h period (5.83 µg g−1)), was very similar to the measured emissions (5.75 µg g−1), as must be the case, given that the potential storage pools within the leaf are small, relative to even these low rates of production.
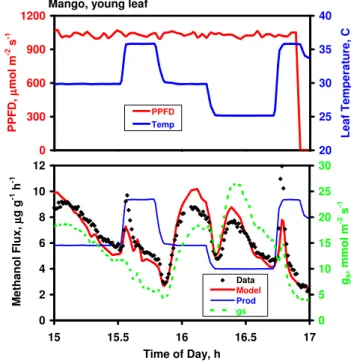
Another example is provided by a young leaf of mango (Fig. 8). Note particularly the significant bursts of methanol emission (at 13:30 and 15:45, denoted by blue shading) which occurred upon re-illumination following a short pe-riod of darkness (15–25 min) that caused stomata to close al-most completely. If emissions between noon and 15:45, mea-sured at constant temperature of 30◦C, are plotted against gs (Fig. 9), a clear linear relationship emerges, suggesting that stomatal conductance plays a significant controlling role for much of the day, temperature remaining constant. Only those periods immediately after illumination following a period of darkness (shaded regions in Fig. 8; red and green asterisks in Fig. 9) exhibit a burst of emissions and deviate from the general relationship between gs and methanol emissions.
Methanol emissions from the same leaf of mango on the previous day, with light held constant at ap-prox. 1000 µmol m−2s−1, failed to show an exponential
Mango, young leaf 0 300 600 900 1200 10 11 12 13 14 15 16 P P F D , µµµµ mo l m -2 s -1 15 20 25 30 35 40 L e a f T e mp e ra tu re , C PPFD Temp 0 4 8 12 16 20 10 11 12 13 14 15 16 Time of Day, h M e th a n o l F lu x , µµµµ g g -1 h -1 0 25 50 75 gs , mmo l m -2 s -1 Prod Model Data gs
Fig. 8. Methanol emission data measured over six hours on an immature leaf of Mangifera indica. Top panel: Incident PPFD and measured leaf temperature. Bottom panel: Mea-sured rates of methanol emissions and stomatal conductance, and rates of methanol production and methanol emissions predicted by the Niinemets-Reichstein model. Emissions predicted using the broadleaf tree default parameterization are shown in solid red line (in the absence of significant temperature variation β was set equal to 0.08 and Pm30=6.46 µg g−1h−1). 0 3 6 9 12 15 18 0 10 20 30 40 50 60
Stomatal Conductance, mmol m-2 s-1
M e th a n o l F lu x , µµµµ g g -1 h -1 Noon-1612 1330-1345 1545-1600
Fig. 9. Methanol emission fluxes from the mango leaf in Fig. 8 plot-ted as a function of stomatal conductance. Superimposed on all data collected from noon to 16:12 (blue symbols) are data from periods characterized by stomatal opening immediately following periods of darkness and stomatal closure (asterisks), denoted by blue shad-ing in Fig. 8.
Mango, young leaf
0 300 600 900 1200 15 16 17 P P F D , µµµµ mo l m -2 s -1 20 25 30 35 40 L e a f T e mp e ra tu re , C PPFD Temp 0 2 4 6 8 10 12 15 15.5 16 16.5 17 Time of Day, h M e th a n o l F lu x , µµµµ g g -1 h -1 0 5 10 15 20 25 30 gs , mmo l m -2 s -1 Data Model Prod gs
Fig. 10. Methanol emission data measured over two hours on an immature leaf of Mangifera indica (same leaf as Figs. 8 and 9). Top panel: Incident PPFD and measured leaf temperature. Bottom panel: Measured rates of methanol emissions and stomatal conduc-tance, and rates of methanol production and methanol emissions predicted by the Niinemets-Reichstein model. Emissions predicted using the broadleaf tree default parameterization are shown in solid red line (in the absence of significant temperature variation β was set equal to 0.08 and Pm30=6.46 µg g−1h−1).
increase with temperature (Fig. 10), contrasting with the sit-uation observed in cottonwood (Fig. 3). Emissions fluctu-ated wildly, and bore a closer relationship to stomatal con-ductance than to temperature. This is confirmed when emis-sions are plotted versus gs(Fig. 11a) and, at a given tempera-ture, increased linearly with gs. The slope of the response in-creased with temperature however, and if the emissions pre-dicted by the three lines are compared at a common stomatal conductance value of 15 mmol m−2s−1, the Q10is 2.4, sim-ilar to the value obtained in a different fashion in Fig. 4b. Interestingly, if emissions are plotted against leaf transpira-tion rate (Fig. 11b), the three curves collapse on each other.
Model fits to the data in Figs. 8 and 10 capture much of the observed variation in emissions. In Fig. 8, the model describes qualitatively the bursts in emission when stomata re-open following a period of darkness, and mimics the con-trol of emissions by gs in the afternoon, although signif-icantly underestimating measured rates between 11:00 and 13:00. As with the loblolly data above (Fig. 6) the modeled methanol emission rates tended to exceed rates of produc-tion during and after rapid stomatal opening and fell below production rates when stomata were closing, indicating sig-nificant stomatal control of emissions during those periods.
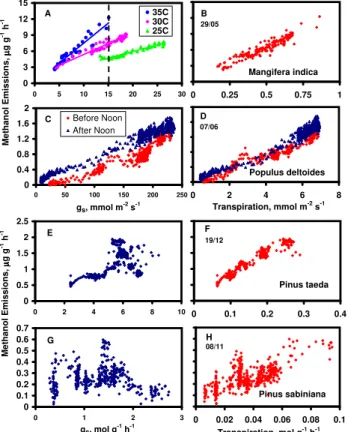
0 3 6 9 12 15 0 0.25 0.5 0.75 1 Mangifera indica B 29/05 0 3 6 9 12 15 0 5 10 15 20 25 30 35C 30C 25C A 0 0.4 0.8 1.2 1.6 2 0 2 4 6 8 Transpiration, mmol m-2 s-1 Populus deltoides D 07/06 0 0.4 0.8 1.2 1.6 2 0 50 100 150 200 250 gs, mmol m-2 s-1 Before Noon After Noon C 0 0.5 1 1.5 2 2.5 0 0.1 0.2 0.3 0.4 Pinus taeda F 19/12 0 0.5 1 1.5 2 2.5 0 2 4 6 8 10 E 0 0 0 0 0 1 1 1 0 0.02 0.04 0.06 0.08 0.1 Transpiration, mol g-1 h-1 Pinus sabiniana H 08/11 0 0.1 0.2 0.3 0.4 0.5 0.6 0.7 0 1 2 3 gs, mol g-1 h-1 G M e th a n o l E m is s io n s , µµµµ g g -1 h -1 M e th a n o l E m is s io n s , µµµµ g g -1 h -1
Fig. 11. Measured rates of methanol emission as a function of stomatal conductance (left panels) and as a function of transpira-tion (right panels) for leaves of four different species, mango (A, B), cottonwood (C, D), loblolly pine (E, F) and gray pine (G, H). Rates of stomatal conductance and transpiration are expressed on a leaf area basis for the two broadleaved species and on a dry mass basis for the two pines.
In Fig. 10, in which emissions bear no obvious relationship with temperature or modeled rates of production, and appear to be controlled largely by variations in gs, they are well cap-tured by the model. Despite the apparent control by gs, the effects of temperature on the slope of the emissions vs. gs relationship (Fig. 11a) and the strong correlation between emissions and transpiration (Fig. 11b) clearly indicate that leaf temperature also plays a role. Indeed, if leaf temperature is held constant at 25◦C in Fig. 10, attempts to model the ob-servations are unsuccessful (not shown); only by combining temperature effects on production and the value of H with variation in gs is a successful simulation obtained.
Figure 12 depicts data obtained from two species of pine, with data from immature needles of loblolly pine in the left panel and similar data from mature needles of gray pine in the right panel. In both examples, emissions appeared to track closely with step changes in temperature and the model captures observed variations quite well. In neither case is a clear relationship with gs apparent; indeed, if emissions are plotted versus gs (Fig. 11e, g), the relationship between the
Loblolly pine, immature
0 500 1000 1500 11 12 13 14 15 16 17 P P F D , µµµµ m o l m -2 s -1 15 20 25 30 35 40 PPFD Temp 0 500 1000 1500 11.5 12 12.5 13 13.5 14 14.5 15 15.5 16 16.515 20 25 30 35 40 T e m p e ra tu re , C
Gray pine, mature needles
0 0.8 1.6 2.4 3.2 11.5 12.5 13.5 14.5 15.5 16.5 Time of day, h M e th a n o l, µµµµ g g -1 h -1 0 2 4 6 8 0 0.2 0.4 0.6 0.8 11.5 12.5 13.5 14.5 15.5 16.5 Time of day, h 0 1 2 3 gs , m o l g -1 h -1 Data Model Prod Gs
Fig. 12. Methanol emission data measured over five hours on immature needles of loblolly pine (left panels) and mature nee-dles of gray pine (right panels). Top panels: Incident PPFD and measured leaf temperature. Bottom panels: Measured rates of methanol emissions and stomatal conductance, and rates of methanol production and methanol emissions predicted by the Niinemets-Reichstein model. Emissions predicted using the de-fault parameterization for pine are shown in solid red lines (loblolly: β=0.054 and Pm30=1.45 µg g−1h−1; gray: β=0.116 and Pm30=0.24 µg g−1h−1).
two is quite weak. Of particular interest in both panels is the interval between approximately 14:30 and 16:00 when mea-sured methanol emissions and stomatal conductance strongly diverged, and emissions are explained largely by direct ef-fects of temperature on methanol production and, to a lesser extent, the value of H . Niinemets and Reichstien (2003a) previously demonstrated that temperature dependent changes in the value of H influenced modeled emissions, independent of any changes in methanol production. As seen above, if emissions are plotted against leaf transpiration rate (Fig. 11f, h), effects of varying temperature are incorporated and the correlations become much stronger.
3.1 Methanol emissions at night
The fact that PPFD and gs are strongly correlated makes it difficult to distinguish between direct effects of light on methanol production and indirect effects on emission via changes in stomatal aperture. During brief periods of dark-ness (e.g., Figs. 2, 8), emissions sometimes fell to near zero, but in each case, the decline in emissions was accompanied by very rapid and nearly complete stomatal closure. In other cases, early morning rates of emission in plants kept in the dark overnight (e.g., Fig. 13) were quite low but significantly above zero. We collected little data over extended periods of darkness, and the magnitude of methanol emissions at night remains a largely unexamined issue. In two cases, however, we measured methanol emissions from leaves of cottonwood continuously from late afternoon until noon the following day (Fig. 14). In both the mature (left panel) and rapidly
growing leaves (right panel), emissions continued through the night, but at quite low rates, and clearly responded to gradual increases in gs that occurred after midnight. When the light was turned on at the end of the dark period, stom-ata opened rapidly with simultaneous increases in emissions. Several hours after illumination, and long after any methanol burst should have subsided, emissions from the mature leaf (left panel) remained over three times higher than observed in the dark, temperature remaining constant at 20◦C. Simi-larly, in the young leaf, emissions at 30◦C when the experi-ment was terminated at noon were over five times higher than emissions just prior to illumination (at 20◦C), an increase in-consistent with the average Q10value of 2.3 (Fig. 5).
4 Discussion
Ultimately, our goal is to develop a model of methanol emis-sions from forests and other ecosystems suitable for inclu-sion in regional and global scale atmospheric chemistry mod-els. The leaf-level methanol emission measurements re-ported here were undertaken to elucidate short-term con-trols over emissions with the aim of incorporating such in-formation into a leaf-level model. Our data clearly indicate that, in the short term (minutes to hours), daytime emissions of methanol are under joint control of leaf temperature and stomatal conductance.
4.1 Methanol response to rapid changes in stomatal con-ductance
Consistent with previous reports (Nemecek-Marshall et al., 1995; H¨uve et al., 2007), we observed large bursts of methanol emissions when light was turned on after a pro-longed period of darkness. These bursts were particularly dramatic in leaves with relatively high rates of emission (Figs. 1–3). Morning bursts of emission were less pro-nounced or undetectable in pine trees with low steady-state rates of emission (Fig. 12). Bursts of methanol emission, smaller and of shorter duration, were also observed following short-term (5 to 20 min) periods of darkness, as long as stom-ata responded rapidly and methanol emissions were strongly limited during the dark period (Figs. 2 and 8).
Such behavior was qualitatively captured by the Niinemets-Reichstein model, and is explained by the short-term dynamics of the leaf methanol pool (Figs. 1 and 2). Pools that accumulate during extended periods of stomatal closure empty rapidly upon stomatal opening. Following rapid stomatal closure, newly produced methanol partitions strongly to the liquid phase, and a large increase in the liquid pool (and considerable time) is required before gas phase concentrations reach sufficiently high levels to counter the effects of decreased gs.
4.2 Methanol response to varying light and temperature During periods not characterized by bursts of emission, and at constant leaf temperature, many of our data sets ex-hibit a striking linear relationship between emissions and gs (Figs. 7, 9 and 11a, c), strong evidence of stomatal con-trol. However, it is also apparent that leaf temperature op-erates simultaneously to control emissions. Thus, in Fig. 12, emissions in both loblolly and gray pine decreased during the afternoon as temperature was lowered stepwise, despite increasing gs. And although emissions in a young leaf of mango (Fig. 10) clearly fluctuated in concert with gs, a closer examination reveals three independent linear relationships between emissions and gs, the slopes of which are deter-mined by leaf temperature (Fig. 11a).
When leaf temperature was varied while holding PPFD constant, a clear exponential relationship was revealed be-tween methanol emissions and temperature (Figs. 4b, 5). We assumed that this reflected the temperature dependency of methanol production, and incorporated such a dependency in the model (Eq. 1). Although the data in Fig. 5 were ob-tained following any morning burst of emissions and with constant PPFD, gs is dependent on leaf temperature and we cannot dismiss the possibility that stomatal changes affect emissions independently of temperature. Since gs generally decreases as leaf temperature increases (e.g., Figs. 3, 12), stomatal limitations would tend to depress emissions with increasing temperature, in which case values of β describing methanol production should be somewhat higher than those describing emission in Fig. 5. In addition, temperature de-pendent variations in H , affecting methanol solubility, are not taken into account.
In principle, the Niinemets-Reichstein model incorporates both stomatal effects and variations in H , and values of β and Pm30obtained using non-linear least-squares regression techniques applied to each individual data set should better reflect the temperature dependency of methanol production. In Table 1, values of β obtained for each curve in Fig. 5 (i.e., describing emissions) are compared with β values obtained by inverting the Niinemets-Reichstein model (i.e., describing production). For those 10 data sets in which comparisons be-tween the two methods could be made, agreement is reason-ably good (r2=0.53), but on average estimates of β derived from model fits were 21% greater than those obtained using emission data as a function of temperature.
Estimates of β using least-squares analysis will only be valid if the model realistically captures the effects of varying stomatal conductance and light, or effects of variable rates of leaf expansion in growing leaves. If such behavior is not captured by the model, the value of β will be adjusted to pro-vide the best overall fit to the data, but may not accurately reflect the temperature dependency of methanol production. Consider the data in Fig. 3. Fitting the emissions data col-lected between 13:10 and 14:00 to leaf temperature (Fig. 4b) resulted in a β value of 0.080, compared to a value of 0.118
when the entire data set was used to fit the model. The higher value of β in the latter case results in large part from the in-ability of the model to capture the duration of the emission burst in the early morning; in a compromise, the fitting rou-tine increases the steepness of the temperature response to provide the best fit to the entire data set, even though emis-sions are overestimated for much of the afternoon.
Plotting emissions versus transpiration often revealed a strong linear relationship (Fig. 11b, d, f, h). While this cor-relation might indicate that at least a portion of the methanol emitted by leaves is transported in the transpiration stream, we have no evidence for such a process. Transpiration simul-taneously incorporates effects of both stomatal conductance and leaf temperature, since saturation vapor pressure, and therefore the water vapor concentration gradient, is strongly temperature dependent. The change in saturation vapor pres-sure with temperature can be closely approximated using an exponential function analogous to Eq. (1), with β equal to 0.059 and Q10equal to 1.8. Thus, a fortuitous correlation be-tween transpiration and methanol emission arises, since both are proportional to gs at constant temperature, and the aver-age postulated Q10of methanol production is 2.3.
Although the model simulations presented above appear to capture the dominant short-term controls over methanol emissions, accounting for both the effects of leaf temperature (on methanol production and the value of H ) and stomatal conductance, the model frequently underestimates the mag-nitude and duration of the methanol burst following stom-atal opening in the morning. For instance, the model fit to
Populus data in Fig. 1 generated a morning burst of
emis-sions and also responded to stomatal closure as light was reduced in the afternoon, but in neither case was the mag-nitude or duration of the response well simulated. In the context of the Niinemets-Reichstein model, liquid and gas phase pools re-equilibrate far too rapidly following a pertur-bation. In the morning, the pools dropped precipitously at 11:00, forcing modeled emissions to decrease and equal the rate of production by 11:15. The measured burst, however, lasted until about noon, resulting in a significant model un-derestimate of emissions over this period. Similarly, in the late afternoon, when stomata closed in response to a gradual reduction in PPFD, the model responded only slightly while measured emissions fell by 75%. This too is explained, in the context of the model, by an overly rapid re-equilibration of methanol pools, this time resulting in a rapid increase in the gas pool that counteracts the decrease in conductance, lead-ing to a model overestimate of emissions durlead-ing this period.
Any change to the model that retards the rate at which the liquid pool comes into equilibrium improves the model fit to the data, in both early morning and late afternoon. How-ever, none of these modifications can be justified as realis-tic. For instance, if we increase by a factor of four the pool of liquid water into which methanol can partition, the time necessary for the liquid pool to equilibrate is extended. The resulting changes in pool dynamics and improvement in
sim-0 0.4 0.8 1.2 1.6 2 9 10 11 12 13 14 15 Time of Day, h M e th a n o l E m is s io n s , µµµµ g g -1 h -1 0 50 100 150 200 250 gs , m m o l m -2 s -1 Measured Model Prod Model* Gs
Populus deltoides, mature leaf
0 300 600 900 1200 9 10 11 12 13 14 15 P P F D , µµµµ m o l m -2 s -1 15 20 25 30 35 L e a f T e m p e ra tu re , C PPFD Tleaf
Fig. 13. Methanol emission data measured over five hours on a mature leaf of Populus deltoides. Top panel: Incident PPFD and measured leaf temperature. Bottom panel: Measured rates of methanol emissions and stomatal conductance, and rates of methanol production and methanol emissions predicted by the Niinemets-Reichstein model. Emissions predicted using the default parameterization (β=0.195; Pm30=1.02 µg g−1h−1)are shown in solid red line; those predicted assuming a mean value of β=0.08 (Pm30=1.17 µg g−1h−1)are shown in dashed red line.
ulated emissions are illustrated in Fig. 1 by the dashed lines. Unfortunately, such an enhancement of the liquid water pool would imply over 2 m3water per m3leaf, a physical impos-sibility. Very similar improvements to the overall model fit (not shown) result from reducing the value of H by a fac-tor of 4, to 0.115 Pa m3mol−1, or by arbitrarily reducing gs by a factor of 3. Each of these changes also serves to slow the equilibration of the leaf methanol pools, improving the model fit during the early morning burst and the afternoon decline in emissions, yet neither can be justified.
Figure 3, illustrating emission data for another young cot-tonwood leaf, exhibits similar discrepancies between mea-surements and model predictions. Using the default param-eterization, the morning burst in emissions is dramatically underestimated. Once again, arbitrarily increasing the pool of liquid water by a factor of four (dotted line) improves the situation, both during the morning burst and in the afternoon, although morning emissions remain substantially underesti-mated.
Although there is clear evidence that growth rates in ex-panding leaves vary substantially over the diurnal cycle, lead-ing to correspondlead-ing variations in methanol release (H¨uve et al., 2007), such effects are not well characterized and are not incorporated into the model. If rapid leaf growth in expand-ing leaves of Populus leads to enhanced methanol production