Publisher’s version / Version de l'éditeur:
Nature Physical Science, 233, 42, pp. 134-135, 1971-10-01
READ THESE TERMS AND CONDITIONS CAREFULLY BEFORE USING THIS WEBSITE.
https://nrc-publications.canada.ca/eng/copyright
Vous avez des questions? Nous pouvons vous aider. Pour communiquer directement avec un auteur, consultez la première page de la revue dans laquelle son article a été publié afin de trouver ses coordonnées. Si vous n’arrivez pas à les repérer, communiquez avec nous à [email protected].
Questions? Contact the NRC Publications Archive team at
[email protected]. If you wish to email the authors directly, please see the first page of the publication for their contact information.
NRC Publications Archive
Archives des publications du CNRC
This publication could be one of several versions: author’s original, accepted manuscript or the publisher’s version. / La version de cette publication peut être l’une des suivantes : la version prépublication de l’auteur, la version acceptée du manuscrit ou la version de l’éditeur.
Access and use of this website and the material on it are subject to the Terms and Conditions set forth at
Hedvall effect in cement chemistry
Ramachandran, V. S.; Sereda, P. J.
https://publications-cnrc.canada.ca/fra/droits
L’accès à ce site Web et l’utilisation de son contenu sont assujettis aux conditions présentées dans le site LISEZ CES CONDITIONS ATTENTIVEMENT AVANT D’UTILISER CE SITE WEB.
NRC Publications Record / Notice d'Archives des publications de CNRC:
https://nrc-publications.canada.ca/eng/view/object/?id=3aa6998d-dd28-4c24-b461-5336f0655f8d
https://publications-cnrc.canada.ca/fra/voir/objet/?id=3aa6998d-dd28-4c24-b461-5336f0655f8d
(Reprinted from Nature Physical Science, Vol. 233, N o . 4 2 , p p . 134-135,
October 18, 1971)
Hedvall Effect in
aCement Chemistry
THE increased reactivity of a solid during and as a consequence of a crystalline transformation is commonly known as the Hedvall effect'-3. In a wider sense this effect may include increased reactivity near a transition point. The typical data quoted in support of the Hedvall effect refer to reactions in the binary systems containing silver salts with BaO, SrO and CaO yielding the reciprocal pairs4-'.
There are still many unresolved problems in cement chemistry in spite of the use of powerful techniques such as X-ray diffrac- tion, electron microscopy, electron microprobe, NMR and others. One of the problems is concerned with the difference in reactivities of the cement components. It seemed that the reactivity might be studied through the solid state reactions and that the use of the Hedvall effect might resolve the problem.
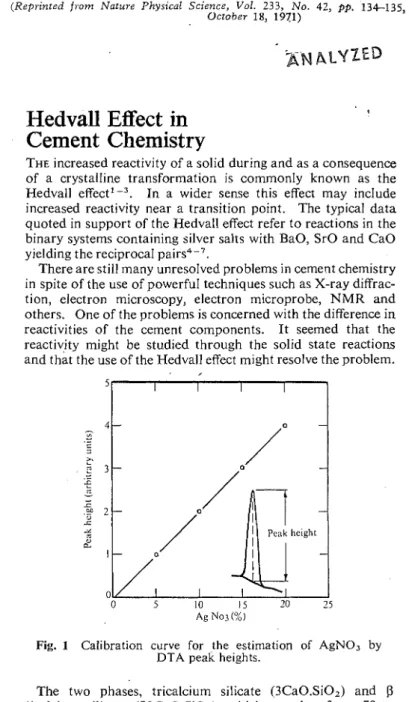
Fig. 1 Calibration curve for the estimation of AgNO3 by DTA peak heights.
The two phases, tricalcium silicate (3Ca0.Si02) and [3 dicalcium silicate ([32Ca0.Si02), which together form 70 to 80% of the cement clinker, play a dominant role in the physical,
chemical and mechanical properties in the hardening of port- land cement paste. We have studied reactions between AgNO, and 3Ca0.Si02, D2CaO.SiO2, CaO, Ca(OH), and a com- pletely hydrated 3CaO.Si0, in order to test the effect in these systems.
Silver nitrate was mixed with different proportions of each of the reactants already mentioned and heated to 250" C in a DTA apparatus. There was a clear indication that some or all of the AgNO, was consumed in the reaction. The amount of AgNO, reacted in the time involved was determined by estim- ating the amount of the nitrate remaining in the system after completion of the exothermal reaction. The mixture was heated to a temperature of 250" C which is much greater than the exothermal peak temperature. DTA was then obtained on the cooling mode; an exothermal peak was found, which corre- sponds to the recrystallization of the unreacted silver nitrate. Calibrations were performed with different proportions of AgNO, and SiO,. There is a good straight line relationship between the peak height or the peak area and the amount of AgNO, in the mixture (Fig. 1). Because it is quick and easy to determine the peak heights, all the estimations were done o n this basis.
Table 1 Extent of Reaction of AgNO, with Different Reactants
Extent of Amount Amount
Sample Reactants reaction of Ca in of Ca
No. Reactant : the reacted
AgN03 reactant (mol) (wt) (mol) I CaO 1 : 5.8 1 0.96 2 Ca(OH), 1 : 4.6 1 1 .O 3 3Ca0.Si02 1 : 1.21 3 0.81 4 B2CaO.SiOZ 1 : 4.2 2 0.12 5 Hydrated 3Ca0.SiOz 1 : 3.74 6 5.99
The reaction between CaO and AgNO, is almost stoichio- metric and shows that 96.0% of CaO reacts with AgNO, (Table 1). A slightly lower value for the reacted CaO should be attributed to presence of a small quantity of relatively non- reactive CaO formed at a calcination temperature of 1,000" C. In other words, this method offers a new tool to study the reactivity of CaO formed in the calcination of limestones. Calcium hydroxide reacts with AgN03 stoichiometrically in the weight proportions of 1 : 4.6 which corresponds to the reaction of 1 mol of Ca(OH),-with 2 mol of AgNO,. This is a quick and elegant method of estimating Ca(OH),.
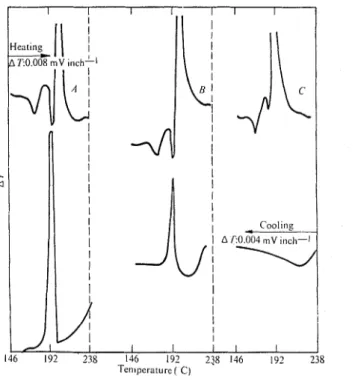
Fig. 2 Differential thermal behaviour of 3Ca0.SiOZ-AgNO, system. A , 66.67 % AgN03; B, 60.0% AgNO,; C, 50.0%
AgNO,.
The reaction of AgNO, with 3 C a 0 . S i 0 2 may be studied through the thermograms presented in Fig. 2. The curves A, B and C represent, respectively, the mixtures containing 66.6%, 60.0% a n d 50.094, AgNO,. The exothermic peak, due to the reaction between the tricalcium silicate and silver nitrate, is completed within a few minutes. I n curves A and B
the presence of the exothermal peaks in the cooling mode shows clearly that a n excess of AgNO, was mixed with the tricalcium silicate initially and, as expected, more nitrate remained unreacted in sample A . I n curve C, however, no AgNO, remained after the reaction as evidenced by the absence of a n exothermal effect in the cooling mode. Curves A and B were used to c a l c ~ ~ l a t e the amount of AgNO, consumed in the reaction a n d both indicated that 27% of the C a present in the tricalcium silicate phase had taken part in the reaction. This corresponds to 0.81 rnol out of a total of 3 mol of C a present in the 3CaO.Si0, phase (Table 1). These results demonstrate
that about 27% of the tricalcium silicate sample is relatively more reactive than the rest. The conclusion that 27y0 of 3 C a 0 . S i 0 2 had reacted with AgNO, in the time involved could also be confirmed by estimating the amount of 3Ca0.SiOz (73%) which remained unreacted by means of the new D T A method reported elsewheres.
This res~llt confirms the finding obtained with isothermal conduction calorimetry and from t h e rate of hydrationg. After a n induction period of a few hours the rate of heat development due t o hydration reaches a maximum.in the region of 7 t o 8 h and decreases t o a low value a t 18 t o 24 h. The rate of hydration has been shown to have a n analogous behaviour which also suggests that 27% of our 3 C a 0 . S i 0 2 is a material with a high reactivity. It seems that all Ca ions in tricalcium silicate are not equivalent and that some of them a r e more reactive. The Hedvall effect provides a new approeach t o the study of the relative reactivities of C a ions In the sample. This does not mean that the remaining c a l c ~ u m silicate does not react with AgNO, nor that 27% is a unique proportion. It requires only a few minutes for 270,/, of the tricalcium silicate t o react with AgNO, a t about 200" C and further heating for about twice this time does not show any difference. Even heating a t 250" C for 60 min causes a further reaction of only about 1.5% tricalcium silicate. A similar trend is obvious in the paste hydration but the periods should be reckoned in terms of days and months.
The B2Ca0.Si02 phase in portland cement is known to hydrate relatively slowly compared with the 3Ca0.SiOz phase. One would expect that in the former system the percentage of the reactive part would be lower. This is so, as may be seen from Table 1; the dicalcium silicate phase has reacted about 6 per cent only a n d this corresponds to 0.12 mol of C a out of the 2 mol in the sample.
A completely hydrated 3 C a 0 . S i 0 2 contains a mixture of Ca(OH)2 and the C-S-H phase. In this system practically all of the C a present in the Ca(OH)2 and in the C-S-H phase reacted with A g N 0 , (Table 1). For calculation purposes the following equation was used:
2 {3CaO.SiO2)
+
5 H 2 0 +Ca3Si20,.2Hz0 (D-dried)
+
3Ca(OH), Our observation has confirmed the validity of this complex equation and also reveals that all the Ca in the C-S-H phase, whether in the interlayer positions or in the layer itself, is equally reactive, by contrast with the observations for the tricalcium silicate phase. The reactivity in the C-S-H phase a s defined by the Hedvall effect is in agreement with the fact that COz and even water attacks it; Al a n d the SO, ions can replace the cations and the calcium is extractable with organicsolvents. This may also reflect in t h e characteristic property for accommodation of its surface with that of t h e adjacent materials in terms of interfacial bonding.
T h e Hedvall effect is a ~1sefi11 new tool for t h e study o f various aspects of t h e physico-chemical phenomena in cement chemistry a n d probably in other allied fields.
W e thank G. M. Polomark for experimental assistance.
Blrildit~g Mc~terials Sectiotl, Divisiotl of' Builc/itrg Researclz,
Natiotlal Researclz Co~rrlcil o f Catrada, Ottawa
Received August 9; revised September 27, 1971.
Hedvall, J. A,, Eitlfiillr~n~g it1 die Fesrkorpercl~ett~ie (Vieweg, Braunschweig, 1952).
Hauffe, K., Reaktionetl it1 utlrl an Festetz S I O ~ C I I , 628 (Springer, Berlin, 1955).
Garner. W. E.. C/lemisrrv o f the Solid Srare. 309 (Butterworths.
Cohen, G. ,'Cl~ett;. Rev., 42, .527 (1 948).
Gray, J., TIIC Defecl Solid Srare, 127 (Interscience, New York,
1957)
*,-.,.
Rees, A. L. G., Cl~emisrr~ of rile Defecr Solid Srare, 91 (Methuen,
London 1954).
'
Borchardt, H.' J:, and Thompson, B. A,, J. Amer. Clren~. Soc., 82, 5630 (1960).Ramachandran, V. S., J. Tllertt?al At~alysis, 3, 181 (1971). Tenoutasse, N., Mat~fisrariot~s Thertniqr[es rle I'Hydrarion (Collo-
quium), 10 (Paris, 1969).
Printed in Great Br~tain by FlaIeDath Printers Limited, Walling Street. Colney Street. St. Albans. Herts.