HAL Id: inserm-02907332
https://www.hal.inserm.fr/inserm-02907332
Submitted on 27 Jul 2020
HAL is a multi-disciplinary open access
archive for the deposit and dissemination of
sci-entific research documents, whether they are
pub-lished or not. The documents may come from
teaching and research institutions in France or
abroad, or from public or private research centers.
L’archive ouverte pluridisciplinaire HAL, est
destinée au dépôt et à la diffusion de documents
scientifiques de niveau recherche, publiés ou non,
émanant des établissements d’enseignement et de
recherche français ou étrangers, des laboratoires
publics ou privés.
and functional effects of cancer mutations on kinase
complexes
Martin Mehnert, Rodolfo Ciuffa, Fabian Frommelt, Federico Uliana, Audrey
van Drogen, Kilian Ruminski, Matthias Gstaiger, Ruedi Aebersold
To cite this version:
Martin Mehnert, Rodolfo Ciuffa, Fabian Frommelt, Federico Uliana, Audrey van Drogen, et al..
Multi-layered proteomic analyses decode compositional and functional effects of cancer mutations
on kinase complexes. Nature Communications, Nature Publishing Group, 2020, 11 (1), pp.3563.
�10.1038/s41467-020-17387-y�. �inserm-02907332�
Multi-layered proteomic analyses decode
compositional and functional effects of cancer
mutations on kinase complexes
Martin Mehnert
1
✉
, Rodolfo Ciuffa
1
, Fabian Frommelt
1
, Federico Uliana
1
, Audrey van Drogen
1
,
Kilian Ruminski
1,3
, Matthias Gstaiger
1
✉
& Ruedi Aebersold
1,2
✉
Rapidly increasing availability of genomic data and ensuing identification of disease
asso-ciated mutations allows for an unbiased insight into genetic drivers of disease development.
However, determination of molecular mechanisms by which individual genomic changes
affect biochemical processes remains a major challenge. Here, we develop a multilayered
proteomic work
flow to explore how genetic lesions modulate the proteome and are
trans-lated into molecular phenotypes. Using this work
flow we determine how expression of a
panel of disease-associated mutations in the Dyrk2 protein kinase alter the composition,
topology and activity of this kinase complex as well as the phosphoproteomic state of the cell.
The data show that altered protein-protein interactions caused by the mutations are
asso-ciated with topological changes and affected phosphorylation of known cancer driver
pro-teins, thus linking Dyrk2 mutations with cancer-related biochemical processes. Overall, we
discover multiple mutation-specific functionally relevant changes, thus highlighting the
extensive plasticity of molecular responses to genetic lesions.
https://doi.org/10.1038/s41467-020-17387-y
OPEN
1Department of Biology, Institute of Molecular Systems Biology, ETH Zurich, Switzerland.2Faculty of Science, University of Zurich, Zurich, Switzerland.3Present
address: Centre d’Immunologie de Marseille-Luminy, Aix Marseille Université, INSERM, CNRS, Marseille, France. ✉email:[email protected]; [email protected];[email protected]
123456789
T
he emerging paradigm of personalized medicine essentially
posits that the molecular makeup of individual patients will
guide their optimal treatment. To date, molecular profiles
have been largely generated by a range of genomic technologies,
including genome-wide association studies (GWAS),
whole-genome sequencing, or transcript profiles. GWAS have
estab-lished a plethora of correlations between sequence
polymorph-isms (SNPs) and a variety of human diseases
1. However, while
our understanding of the genetic bases of diseases has progressed
at an extraordinary pace, only limited progress has been achieved
in systematically mapping the functional repercussions of specific
lesions.
Over the last years, mass spectrometry (MS)-based proteomic
methods have significantly advanced with respect to their
robustness, performance, and scope
2. With time, methods have
been developed, which measure functionally important properties
of proteins such as the modification state
3as well as the
com-position and topology of protein complexes
4in addition to the
presence and abundance of a protein in a sample. In combination,
these MS techniques constitute a powerful tool set to measure
mechanistically relevant responses of the cell to (genomic)
perturbations.
Protein kinases modulate key cellular processes, form stable
and transient complexes with other cellular proteins and are
frequently found mutated in genetically linked human diseases.
As a consequence kinases are the largest family of current anti
cancer drug targets. The CMGC kinase Dyrk2 (dual-specificity
tyrosine-phosphorylation-regulated kinase 2) represents one of
the less studied kinases and presents several important features
relevant for this study.
First, Dyrk2 forms a well-defined multifunctional protein
complex encompassing the ubiquitin ligase Ubr5 (also called
EDD) and the substrate receptor subunit composed of DDB1 and
VprBP (Dyrk2–EDVP [EDD–DDB1–VPRBP complex]).
Dyrk2-dependent phosphorylation of recruited substrates is required for
the subsequent ubiquitylation by Ubr5 and their proteasomal
degradation
5. Second, Dyrk2 possibly contributes to cancer
pro-gression; it has been implicated as both a putative tumor
sup-pressor and an oncogene
6–9. Third, high-resolution structural
information about Dyrk2 is available
10, which facilitates the
topological analysis of the kinase module by MS.
In this study, we develop an integrated, multi-layered
pro-teomic workflow to assess the response of cells to specific
cancer-associated mutations at various layers of proteomic information.
Specifically, we use (i) AP–MS and BioID–MS to assess the effects
of specific mutations on the interaction landscape around the
mutated protein, (ii) quantitative cross-linking MS to determine
alterations in the topology of the complex containing the mutated
protein and (iii) quantitative proteome and phosphoproteome
profiling by SWATH–MS to quantify the response of proteome
and phosphoproteome to the mutated protein. This multi-layered
proteomic analysis of the effects of a panel of
five Dyrk2 mutants
indicates that the cells react to the different mutations with
substantial and mutation-specific responses at different levels. We
provide several examples of affected functional modules and how
the combination of data from different layers may support
spe-cific mechanistic explanations. Most prominently, we focus on
the discovery of the nuclear pore complex as a cellular module
that is affected by Dyrk2 mutations, as well as on how these
mutations significantly perturb the interaction with and the
phosphorylation of a number of known cancer driver proteins
(Cancer Gene Census)
11.
Overall, we describe a multi-layer analysis strategy to
deter-mine the molecular response of cells to different
cancer-associated mutations in the same gene. The results highlight the
complexities of the cellular response to perturbations and provide
insights how specific mutations in the Dyrk2 kinase shape
cancer-relevant biochemical pathways. The established workflow is
generically applicable and its use will aid our understanding of
how cancer-associated mutations cause their phenotypic effects.
Results
Selection of cancer mutations in the Dyrk2 kinase. In the
first
layer of the multi-layered workflow (Fig.
1
a), we set out to identify
and express a panel of functionally/structurally relevant Dyrk2
mutants. We used as a reference set the 119 mutations in the
DYRK2 gene reported in the COSMIC database (11.08.2015)
12,
most of which are missense mutations (n
= 72) located in the
kinase domain (Supplementary Table 4). To select a suitable
subset for this study, we considered the frequency of the
muta-tions occurring in DYRK2 and a damage probability score
pro-vided by the structure-ppi algorithm
13, which predicts the impact
of missense mutations on proteins based on known structural
information, the position of mutations in conserved and
func-tionally relevant regions and the presence of mutations in tumor
samples. Overall, we selected four missense (P198L (PL), R378L
(RL), S471L (SL), S471P (SP)), and 1 nonsense (S471X (SX))
mutation for further analysis. They all show an increased damage
probability score (structure-ppi score: 2–3). The respective
posi-tions in the gene and predicted damage score are shown in
Supplementary Fig. 1a. The RL mutation is close to the strongly
conserved activation loop (Fig.
1
b), it has an elevated ppi score of
3 and the respective arginine position has been found to be
recurrently mutated (n
= 3) in DYRK2. Furthermore, sequence
alignment with Dyrk family members shows that basic residues
(either R or K) are conserved at this position
14. The three selected
mutations on position S471 have been identified in patients with
breast cancer (SX) and various cancer types (SL, SP)
6,7,15. Dyrk2
SX contains a stop codon leading to a C-terminally truncated
protein variant and has been shown to abrogate the interaction to
the EDVP complex member VprBP
16. The PL mutation is located
outside of the kinase domain but close to the DYRK-homology
(DH) box, which is strongly conserved among DYRKs
14. Among
the known mutations in this region PL shows one of the highest
damage probability scores (structure-ppi score: 2). Finally, we
included a catalytically inactive variant of Dyrk2 (Dyrk2 K251R
(KR)), which has not been reported in repositories of cancer
mutants yet, into the mutant panel
17. It serves as a control for the
evaluation of functional effects of the selected cancer-associated
mutations (Fig.
1
b).
The selected point mutations were introduced by site-directed
mutagenesis into plasmids encoding a Strep-HA-tagged version
of Dyrk2 for AP–MS experiments or a BirA*-tagged Dyrk2
variant for BioID–MS experiments. The Dyrk2-mutant constructs
were genomically integrated into T-REx HEK293 cells using the
Flp–In recombination system and expressed in an inducible
manner by addition of doxycycline. As determined by western
blot analysis, the generated Dyrk2 mutants were expressed at
levels comparable to the wild-type (wt) Dyrk2 (Supplementary
Fig. 1b).
A reference interaction network of the Dyrk2–EDVP complex.
To our knowledge (i) the protein–protein interactions (PPIs) of
all EDVP components have not yet been examined, (ii) no
proximal interactome, which sheds light on transient interactors
of this complex has been reported, and (iii) the overlap between
the interactors reported to date for the four EDVP components is
very low (n
= 2, IID (Integrated Interactions Database)
18),
probably due to the heterogeneity of the experimental methods
used so far. We therefore initially generated an interaction map of
the EDVP subunits as a crucial reference interaction network to
relate the effects of the chosen Dyrk2 mutations on the core
module. To obtain broad coverage of the EDVP interactors and
their functional associations, we mapped the interactors of the
core module components by two complementary approaches,
AP–MS and BioID–MS. Overall, we identified 203 unique
high-confidence interactions for all the complex members. The two
methods (ranging from 21 PPIs for the ubiquitin ligase Ubr5 to
70 PPIs for Dyrk2) generated highly orthogonal information
(average overlap of ~10%). Importantly, the large majority of
detected interactions have not yet been reported (on average
~70%). Nine PPIs identified with high confidence were shared
between all four EDVP complex members. This represents a more
than fourfold increase in identified interactors compared to
database knowledge.
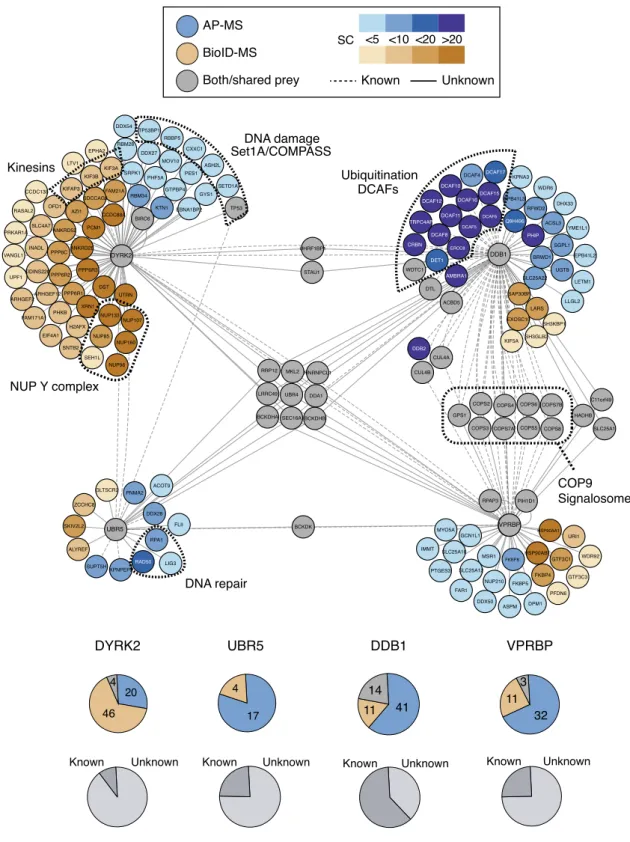
Our data both recalled several known EDVP members and
identified further proteins associated with the core complex.
Among the most extensively characterized interaction modules,
we confirmed the interaction of Dyrk2 with the EDVP complex
components DDB1, VprBP, and Ubr5 by both methods (Fig.
2
,
cytoscape graph and lower pie charts). Similarly, the interaction
between DDB1 and the E3 CRL4 ligase machinery including
several DCAF substrate receptors as well as the known
association with the COP9 signalosome was represented in our
data set
19–21. Furthermore, we found that Dyrk2 is prominently
associated with members of the Set1A/COMPASS complex and
several kinesins, which is in line with a putative role of Dyrk2 in
cytokinesis and mitosis
5. One of the most remarkable
findings
was the identification of the entire nuclear Y-complex (NUP133,
NUP107, NUP85, NUP160, SEH1L, NUP96) in spatial proximity
to Dyrk2 by BioID–MS. The Y-complex is a major subunit of the
nuclear pore complex involved in nuclear transport processes
22.
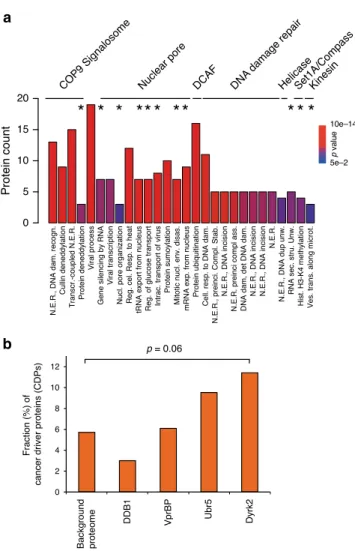
Accordingly, functional GO-term analysis showed that in
addition to the already suggested involvement of Dyrk2 in
cytokinesis and DNA damage repair
5,17,23, it was also strongly
linked to various cellular functions related to the nuclear pore
complex (Fig.
3
a; Supplementary Fig. 2a). In addition,
sever-al Dyrk2 interaction partners (n
= 8) detected in this study
such as p53 or the ubiquitin ligase Birc6 are annotated as cancer
driver proteins (CDP) in the Cancer Gene Census catalogue
11,24.
Remarkably, the fraction (11.4%) of CDPs is enriched (p-value
=
0.06) in the Dyrk2 interaction network compared to the overall
measured proteome in this study (Fig.
3
b).
In combination, AP–MS and BioID–MS confirmed the
composition of the Dyrk2 kinase core complex and provided an
extended interaction network, which is enriched in cancer driver
proteins and processes, as well as other functions.
Cancer mutations affect the Dyrk2 interaction network. Next,
we monitored the effects of the selected mutations on the wt
Dyrk2 interaction network. For this, we used T-REx HEK293 cell
lines expressing Strep/HA or BirA*-tagged mutant variants of
Dyrk2 and repeated the interaction analysis using AP–MS and
BioID–MS. The quantification of protein abundances in
inter-action experiments was based on precursor MS1 intensities
obtained from MaxQuant v1.5.2.8
25. Interaction partners were
quantified in triplicates with a replicate CV < 21 % (AP–MS) and
CV < 10 % (BioID–MS), respectively (Supplementary Fig. 3a).
We
first asked to what extent the different mutations affected
the kinase core module (Dyrk2–EDVP complex). Previous
literature
findings
16, damage probability scores and the critical
role of catalytic activity suggested that SX, KR, and RL would
a
b
Dyrk2
P198L (PL) R378L (RL) S471P (SP) S471L (SL) S471X (SX) K251R (KR) = kinase deadN
Kinase domain
C
Activation loop*
Wild-type kinase complex Cancer-perturbed kinase complex Phosphoproteomics AP-MS BioID-MS XL-MS*
*
Interaction analysis Topological analysis Functional analysis
Dyrk2
Cell line generation (Flp-In recombination system)
Damage probality prediction (Structure-PPi )
Selection of cancer mutations
Site-directed DNA mutagenesis
* * * *
COSMIC database
Fig. 1 Selection of cancer-related mutations for the application of a multi-layered proteomic workflow. a Applied multi-layered proteomic workflow integrating interaction analysis (AP–MS and BioID–MS), topological analysis (quantitative cross-linking (XL) MS), and functional analysis
have the greatest impact on the interaction network of Dyrk2 and
the assembly of the EDVP complex. This is indeed what we
found. Both AP–MS and BioID–MS analyses showed that the
truncated Dyrk2-mutant (Dyrk2 SX), the non-cancer-related,
catalytically inactive mutant (Dyrk2 KR) and the recurrently
mutated Dyrk2 RL, which bears a mutation close to the activation
loop, resulted in the most pronounced dissociation from the
EDVP complex subunits (Fig.
4
a). It is noteworthy that the
expression level of the EDVP complex components remained
unchanged in the Dyrk2 mutants (Supplementary Fig. 3c). The
AP-MS BioID-MS Both/shared prey SC <5 <10 <20 >20 Known Unknown interacts with interacts with interacts with interacts with interacts with interacts with interacts with interacts with interacts with interacts with interacts with interacts with interacts with interacts with interacts with eraact interacts with int interacts with interacts with interacts with interacts with interacts with interacts with interacts with interacts with interacts with s with interacts with interacts with interacts with interacts with interacts with interacts with interacts with interacts with interacts with interacts with interacts with interacts with interacts with h interacts with intera interacts with interacts with raacts w interacts with interacts with acts w rarac witwith interacts with interacts with interacts with interacts with interacts with interacts with interacts with interacts with teraac interacts with interacts with interacts with interacts with interacts with interacts with th interacts with interacts with in interacts with interacts with with terainte ac interacts with interaeracts interacts with interacts with interacts with interacts with inte interacts with s with wit interacts with cts witw interacts with interacts with interacts with inter interacts with interacts with eraracts w interacts with interacts with interacts with interacts with interacts with interacts with interacts with interacts with interacts with interacts with interacts with interacts with interacts with interacts with interacts with int interacts with interacts with interacts with interacts with interacts with interacts with interacts with interacts with interacts with interacts with interacts with interacts with interacts with interacts with interacts with teera interacts with interacts with interacts with interacts with interacts with interacts with interacts with interacts with interacts with interacts with interacts with acts wiitthh interacts with interacts with interacts with interacts with interacts with interacts with interacts with acts ww interacts with interacts with interacts with interacts with interacts with interacts with interacts with interacts with interacts with nteracract interacts with interacts with interacts with interacts with interacts with interacts with interacts with
nterarawwiitthhracts with
s wwiitthh teracts interacts with interacts with interacts with interacts with interacts with interacts with interacts with s wwith eraracts interacts with in interacts with interacts with interacts witha interacts with interacts with interacts with interacts with ith interacts with interacts with cts wwit interacts with interacts with interacts with interacts with interacts with acts wwit interacts with intera interacts with interacts with sacts with intesracts interacts with interacts with a a interacts with cts wwit interacts with nter witth interacts with interacts with inte era interacts with interacts with th interacts with iantera interacts with intera intte e interacts with interacts with aacts ww n nteraa ra interacts with interacts with interacts with acts wi i ith i i tinter acts w interacts with interacts with interacts with interacts with with interacts with interacts with interacts with interacts with interacts with interacts with interacts with interacts with interacts with interacts with int interacts with interacts with interacts with interacts with interacts with interacts with interacts with interacts with inter interacts with interacts with interacts withth interacts with interacts with interacts with interacts with interacts with interacts with interacts with interacts with interacts with interacts with interacts with interacts with interacts with interacts with interacts with ith interacts with interacts with interacts with interacts with interacts with interacts with interacts with interacts with FAM171A1 PHKB PPP6R1 ARHGEF2 XRN1 PPP6R3 DST UTRN PPP6R2 ARHGEF12 NUP133 FAM21A EPHA2 SDCCAG3 KIF3B KIF3A LTV1 KIFAP3 RASAL2 PRKAR1A SLC4A7 CCDC138 KIDINS220 VANGL1 INADL UPF1 ANKRD28 ANKRD52 DYRK2 CCDC88A AZI1 PCM1 OFD1 PPP6C XPNPEP3 ZCCHC8 ALYREF SKIV2L2 SUPT5H UBR5 GLTSCR2 H2AFX EIF4A1 SEH1L NUP160 NUP96 NUP85 SNTB2 ERCC8 DET1 AMBRA1 DTL WDTC1 ACBD5 CRBN DCAF8 LARS SH3KBP1 SLC25A22 UGT8 SAP30BP EXOSC10 LETM1 LLGL2 DHX33 RFWD2 Q9H496 ACSL3 WDR6 EPB41L3 KPNA3 DCAF17 DCAF11 DCAF10 DCAF15 DCAF4 DCAF5 DCAF6 TRPC4AP DCAF12 DCAF16 PHIP EPB41L2 SGPL1 DDB1 BRWD1 YME1L1 FKBP4 DPM1 GTF3C1 PFDN6 HSP90AB1 WDR92 URI1 HSP90AA1 GTF3C3 VprBP NUP210 FKBP8 DDX50 MSR1 FKBP5 VPRBP PIH1D1 ASPM RPAP3 SH3GLB2 CUL4B KIF5A CUL4A DDB2 COPS3 COPS2 COPS6 COPS5 COPS4 GPS1 COPS7A MYO5A SLC25A10 SLC25A12 IMMT FAR1 PTGES3 GCN1L1 HADHB C11orf49 COPS8 SLC25A1 COPS7B DDA1 UHRF1BP1 BCKDK HNRNPCL1 BCKDHB STAU1 UBR4 LRRC49 SEC16A BCKDHA RRP12 MKL2 LIG3 RAD50 FLII NUP107 PNMA2 DDX28 ACOT9 RPA1 RBM28 RBBP5 DDX54 TP53BP1 CXXC1 DDX27 ASH2L MOV10 GTPBP4 SETD1A PES1 SRPK1 PHF5A TP53 KTN1 EBNA1BP2 RBM34 BIRC6 GYS1 NUP Y complex COP9 Signalosome DNA damage Set1A/COMPASS Ubiquitination DCAFs Kinesins DNA repair
DYRK2
4 46 20 Unknown KnownUBR5
17 4 Unknown KnownDDB1
41 11 14 Unknown KnownVPRBP
32 11 3 Unknown KnownFig. 2 Comprehensive interaction network of the wild-type Dyrk2–EDVP complex. Interaction network of the Dyrk2–EDVP complex. Interactors identified by AP–MS are shown in blue, interactors identified by BioID–MS are shown in brown, interactors identified by both methods are shown in gray. The intensity of the color indicates the number of spectral counts that was assigned to the respective interaction partner. The upper pie charts indicate the number of interactors for the respective bait protein identified by AP–MS or BioID–MS. The lower pie charts show the distribution of known and previously unknown interactors, respectively.
detected differences are therefore caused by changes in
protein–protein associations rather than differential protein
abundance. In conclusion, we found that certain cancer-related
point mutations and the non-cancer-related catalytically inactive
Dyrk2-mutant cause a disassembly of the kinase core module
revealed by the both complementary interaction approaches
AP–MS and BioID–MS.
We next measured the impact of the tested mutations on the
entire interactome of Dyrk2. We found that all mutations
contributed, albeit to a different degree, to a remodeling of the
Dyrk2 protein interaction network (Fig.
4
b, c). The extent of
interactome rewiring by the mutants broadly reflects the
described impact on the association with the EDVP complex.
Dyrk2 SX (66 interaction changes with
│log2FC│ > 1 and
adj. p-value
≤ 0.05) and the non-cancer-related, catalytically
inactive kinase mutant (Dyrk2 KR, 21 interaction changes
with
│log2FC│ > 1 and adj. p-value ≤ 0.05) exhibited the greatest
impact on the network. They caused a severe to complete
reduction in the number and extent of their interactions. Dyrk2
RL (10 interaction changes with
│log2FC │ > 1 and adj.
p-value
≤ 0.05) showed the same patterns of downregulated
interactions as the catalytically inactive mutant, although at
reduced magnitude (Fig.
4
c). In contrast, Dyrk2 PL, SL, and SP
showed milder but detectable effects on the interaction network
(1–7 interaction changes with │log2FC│ > 1 and adj. p-value ≤
0.05). The effect of mutations on single protein modules and the
kinase specific PPI network is also reflected by interaction
changes involving CDPs. Accordingly, the SX mutant produced
the strongest impact on the interaction with CDPs of the Dyrk2
interactome, followed by Dyrk2 RL; on the other hand, the KR
mutant, which has not been associated with cancer, showed a
rather weak effect contrary to its sizable effect on the global
Dyrk2 interactome as a whole (Fig.
4
d). The fact that certain
point mutations in Dyrk2 substantially disrupt the binding to
CDPs supports the putative importance of these mutations in
cancer-related processes.
Intriguingly, BioID–MS also indicated that both Dyrk2 KR and
Dyrk2 SX severely disrupted Dyrk2 binding to the subunits of the
nuclear Y-complex, which we identified in this study as
interaction partner of wt Dyrk2 (Fig.
4
e). Protein quantification
by SWATH–MS revealed no significant change of the expression
level of the Y-complex components in the cells expressing Dyrk2
mutants, indicating that the interaction loss is not due to changes
in their abundance (Supplementary Fig. 3d). We further
performed immunofluorescence microscopic analysis of
GFP-tagged wt Dyrk2 and its mutant variants. This demonstrated a
clear nuclear translocation defect of Dyrk2 SX, resulting in an
exclusive cytoplasmic localization of this mutant. The nuclear
localization of Dyrk2 KR, on the other hand, was not affected
(Supplementary Fig. 3e). This
finding suggests that the
Y-complex-related interaction phenotype of Dyrk2 KR is
associated with the loss of catalytic activity of Dyrk2 and not
with a perturbed cellular localization indicating that specific
phosphorylation events at the nuclear envelope could be required
for the interaction.
Overall, our data show significant and mutation-specific
reorganization of the Dyrk2 interactome upon genetic
perturba-tion of the kinase and a clear effect of some Dyrk2 mutants on the
interactions with known CDPs. Intriguingly, the kinase mutant
with no association to cancer showed an attenuated effect on the
interaction with CDPs. The most significant changes—in
particular the disassembly of the EDVP complex and the loss of
interactions with the nuclear Y-complex—are associated with
mutants that interfere with the catalytic activity of the kinase,
suggesting that the kinase activity is required for its binding to
key interaction partners.
Cancer mutations induce topological changes in Dyrk2. It can
be expected that the mutation-dependent changes observed in the
Dyrk2 protein interaction network were the result of changes in
Dyrk2 structure or function. We therefore determined the Dyrk2
phosphorylation patterns and topological reorganization of
Dyrk2 in the mutant panel.
Enriched
Strep/HA-tagged
Dyrk2-mutant
variants
from
AP–MS pulldown experiments were analyzed for changes in
their state of phosphorylation within the Dyrk2 sequence.
Bait-normalized abundance values from MaxQuant v1.5.2.8 were used
for the quantification of the identified Dyrk2 phosphopeptides.
Overall, we found that the different mutants affected the
phosphorylation state of Dyrk2 substantially and to different
extents. Furthermore, in general the decrease in Dyrk2
phos-phorylation level (Fig.
5
a) correlated well with the impact of the
respective mutant on the interactome (Fig.
4
b). In particular,
a
b
p value 10e–14 5e–2 Protein count 10 15 20Nuclear pore DCAF DNA
damage repair COP9 Signalosome HelicaseKinesin
*
**
**
* *
*
* *
*
N.E.R., DNA dam. recogn.
Cullin deneddylation
Transcr.-coupled N.E.R.
Protein deneddylation
Viral process
Gene silencing by RNA
Viral transcription
Nucl. pore organization Reg. cel. Resp. to heat tRNA export from nucleus Reg. of glucose transport Intrac. transport of virus
Protein sumoylation
Mitotic nucl. env. disas.
mRNA exp. from nucleus
Protein ubiquitination
Cell. resp. to DNA dam.
N.E.R., preinci. Compl. Stab.
N.E.R., DNA incision
N.E.R. preinci compl ass. DNA dam, det DNA dam. N.E.R., DNA incision N.E.R., DNA incision
N.E.R.
N.E.R., DNA dup unw. RNA sec. stru. Unw. Hist. H3-K4 methylation Ves. trans. along microt.
Set1A/Compass
5 0
Fraction (%) of
cancer driver proteins (CDPs)
Background proteome DDB1 VprBP Ubr5 Dyrk2 0 2 4 6 8 10 12 p = 0.06
Fig. 3 GO-term analysis of the Dyrk2–EDVP interaction network. a Biological processes GO terms enriched (p-value ≤ 0.05) for interactors of the Dyrk2–EDVP complex. The asterisk indicates biological processes that were not associated with components of the Dyrk2–EDVP complex yet based on previous interactome data (IID); Nuclear Excision Repair (N.E.R.). Thep-value for GO-term enrichment (by a modified Fisher exact test) was obtained from DAVID32.b Fraction of known cancer driver proteins (CDP) (Cancer Gene Census Catalogue) identified in the interactome of the Dyrk2–EDVP complex components and in the measured proteome background. Thep-value calculation was performed by Fisher’s exact test (two-sided). Source data are provided as source datafile.
a
b
d
e
SL SP PL RL KR SX Log2FC (mutant/WT) < –1 Log2FC (mutant/WT) > 1 Relative MS1 intensity (bait-normalized) Low High Relative abundancec
0 25 50 75 100 KR RL SX Af fected CDP interactions (%) PL SP RL SL KR SX NUP96 NUP107 NUP160 NUP133 NUP85 −5 −4 −3 −2 −1 0 1 Log2FC (mutant/WT) High confident interactorsKR RL WT SL PL SP SX ST AU1 DDX27 RBM28 RBM34 TP53BP1 ASH2L SETD1A PHF5A GYS1 SRPK1 PES1 MOV10 CXXC1 BIRC6 DDA1 RBBP5 GTPBP4 KTN1 EBNA1BP2 MCCC1 UBR4 VPRBP DDB1 UBR5 DDX54 AP-MS BioID-MS High-confident interactors PPP6R2 UHRF1BP1 NUP160 AZI1 ANKRD52 DST XRN1 LRRC49 H2AFX MKL2 UTRN PPP6C PPP6R1 NUP107 NUP96 NUP133 PPP6R3 DDB1 VPRBP CCDC88A SEC16A ANKRD28 1 M C P UBR5 F A M171A1 CCDC138 OFD1 F A M21A SDCCAG3 PRKAR1A EIF4A1 VA N G L 1 RASAL2 KIDINS220 EPHA2 NUP85 ARHGEF12 KIF3A KIF AP3 SNTB2 TP53 SLCA7 INADL L TV1
BIRC6 UPF1 SEHL1
ARGHGEF2 KIF3B PHKB KR RL WT SL PL SP SX KR RL PL SL SP SX –25 –20 –15 –10 –5 –2.5 –2.0 –1.5 –1.0 –0.5 0.0 0.5 1.0 L o g2FC (m ut ant /WT) Ubr5 VprBP DDB1
Fig. 4 Cancer-related point mutations perturb the Dyrk2 interactome. a Effect of cancer-related mutations on the interaction to the core subunits of the Dyrk2–EDVP complex measured by AP–MS. Error bars denote the mean value (center) with 95% confidence interval (n = 3 biologically independent experiments).b Radar chart representing the number of changed interactors (│log2FC│ > 1) measured by AP–MS and BioID–MS. c Mutation perturbed Dyrk2 interactome measured by AP–MS (upper panel) or BioID–MS (lower panel). The color indicates the bait (Dyrk2) normalized MS1 intensity. The node size displays the relative abundance of an interactor across the mutant conditions. Dyrk2–EDVP subunits are highlighted in purple letters, nuclear Y-complex subunits are highlighted in green letters. Cancer driver proteins (CDPs) are marked with a red dot.d Effect of Dyrk2 mutants on the interaction with cancer driver proteins (CDPs) (│log2FC│ > 1, adj. p-value ≤ 0.05). Dyrk2 SL, SP, and PL do not affect CDP interactions. e Certain point mutations affect the binding of Dyrk2 to the Y-complex of the nuclear pore. The arrow indicates the direction of a significant change in binding (adj. p-value ≤ 0.05). Statistical analysis was performed with two-tailed unpaired Student’s t-test and p-values were adjusted using the method of Benjamini–Hochberg67. Source data are provided as source datafile.
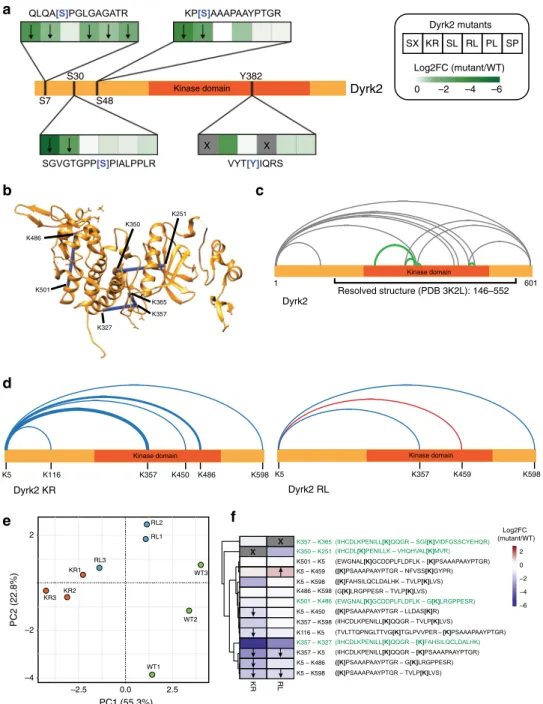
catalytically inactive Dyrk2 KR, Dyrk2 SX and to a lesser extent
Dyrk2 RL clearly reduced phosphorylation, including the
autophosphorylation of the activation loop (Y382), which is
crucial for the topology and activation of the kinase
10,26. Of note,
the mutation of arginine to leucine in Dyrk2 RL blocks the tryptic
cleavage at this position preventing the identification of the
peptide comprising the activation loop sequence. For this
reason, the effect of Dyrk2 RL on the phosphorylation of the
activation loop is still unclear. Together, the differential Dyrk2
phosphorylation state may lead to topological changes in the
a
c
d
f
b
Dyrk2 Kinase domain S30 S7 S48 Y382 X X SX KR SL RL PL SP Log2FC (mutant/WT) 0 –2 –4 –6 Dyrk2 mutants K486 K501 K327 K357 K365 K350 K251 Dyrk2 Kinase domain 1 601 Resolved structure (PDB 3K2L): 146–552 Dyrk2 KR Kinase domain K5 K116 K357 K450 K486 K598 Dyrk2 RL Kinase domain K5 K357 K459 K598e
KR1 KR2 KR3 RL1 RL2 RL3 PC1 (55.3%) –4 2.5 0.0 –2.5 –2 2 WT1 WT2 WT3 PC2 (22.8%) KR RL −6 −4 −2 0 2 Log2FC (mutant/WT) x x K357 – K365 K350 – K251 K501 – K5 K5 – K459 K5 – K598 K486 – K598 K501 – K486 K5 – K450 K357 – K598 K116 – K5 K357 – K327 K357 – K5 K5 – K486 K5 – K598Fig. 5 Differential topological analysis of cancer-related Dyrk2 mutants by cross-linking MS. a Effect of cancer-related mutations on the phosphorylation status of Dyrk2 measured by AP–MS. The arrow indicates the direction of a significant change in phosphorylation (p-value ≤ 0.05). Statistical analysis was performed with two-tailed unpaired Student’s t-test. The cross represents conditions in which no peptide could be detected. b Mapping of intraprotein cross-links that satisfy the distance threshold (~30 Å) of the cross-linker DSS to the structure of Dyrk2 (PDB: 3K2L). The Dyrk2 structure comprises the region between the amino acids 146–552 and lacks the N- and C-terminal part of the protein. c Visualization of confidently identified intraprotein cross-links (ld score≥ 25). In green are shown cross-links that are validated by the known structure of Dyrk2. Gray lines represent cross-links that are located in regions for which structural information is missing.d Visualization of cross-links affected by selected point mutations in Dyrk2. Blue and red lines indicate a significant downregulation (blue)- or upregulation (red) of the cross-link (adj. p-value ≤ 0.05). Statistical analysis was performed with two-tailed unpaired Student’s t-test and p-values were adjusted using the method of Benjamini–Hochberg67. The thickness of the line stands for the degree of the change. Cross-links that were not affected by the mutations are not shown.e Principal component analysis (PCA) of quantified cross-linked peptides between wt Dyrk2 and its mutant variants.f Heatmap showing the effect of selected Dyrk2 point mutations on the abundance of cross-linked peptides. The arrow indicates the direction of a significant change in peptide abundance (adj. p-value ≤ 0.05). Statistical analysis was performed as in d. The cross indicates cross-linked peptides that could not be detected due to a mutation of the cross-linking residue (KR mutant) or the cleavage site (RL mutant). Cross-linked lysine residues are shown in brackets and structurally validated cross-linked peptides are highlighted in green. Source data are provided as source datafile.
mutants, which in turn has an impact on the Dyrk2 interaction
fitness.
To identify topological changes accompanying differential
phosphorylation and interaction patterns, we combined chemical
cross-linking (XL) with targeted mass spectrometry (PRM) (see
“Methods” section). We selected the mutants that revealed the
strongest effect on the interaction network: the catalytically
inactive KR mutant as well as the cancer-associated RL and SX
mutants. Wild-type Dyrk2 and the selected mutants were
recombinantly expressed in SF9 insect cells and purified using a
FLAG-tag. Dyrk2 SX was also expressed but could not be purified
from SF9 cells, possibly due to a misfolding of this protein under
these conditions (Supplementary Fig. 4a, b). The purified Dyrk2
variants were treated with the lysine-specific cross-linker DSS
followed by an enrichment of trypsin-digested cross-linked
peptides by size-exclusion chromatography (SEC; Supplementary
Fig. 4c). The differential quantitative cross-linking analysis was
carried out by PRM using a precursor library containing
cross-linked peptides of the different mutant conditions identified by
the xQuest/xProphet software pipeline (ld (linear discriminant)—
score > 25; Supplementary Fig. 4d)
27. We quantified 14
cross-links across the different mutant conditions. Cross-linking
experiments with affinity-purified Strep/HA-tagged wt Dyrk2
matched to 8 of the 14 cross-links (Supplementary Table 3). In
the correlation analysis using normalized transition intensity, all
replicates emerged as individual clusters with high Pearson
correlation values (average R
= 0.91 (KR), 0.95 (RL), 0.90 (WT))
(Supplementary Fig. 4e, f). Furthermore, principal component
analysis (Fig.
5
e) and fold-change calculation (Fig.
5
f) revealed
measurable topological changes across the different mutants, each
displaying a specific pattern and magnitude of change. The
identified cross-links can be broadly subdivided in two groups:
four of the identified cross-links, highlighted in green in the
primary sequence map of wt Dyrk2 (Fig.
5
c), form the
first group
and are exclusively positioned within the kinase domain. These
cross-links could be mapped to the known crystal structure of
Dyrk2 (PDB: 3K2L) and all fell within the expected DSS distance
restraint of ~30 Å (Fig.
5
b)
10,28, validating the correctness of the
cross-linking procedure. The second group comprises the
remaining ten high-confidence cross-links mapped to the
N-terminal or C-N-terminal region of the kinase, for which no
structural information is currently available (Fig.
5
c). This group
of cross-links suggests that the potentially disordered N-terminal
region of the protein (IUPRED; data not shown) is making
contact with large portions of the protein, primarily the
C-terminal region of the kinase domain. In both mutants the
first
group of cross-links remained largely unaltered, indicating that
the structure of the kinase domain was not fundamentally
reorganized. In contrast, in both mutants the interaction of the
N-terminal region with the kinase domain was perturbed: in the
Dyrk2 KR mutant the interaction was strongly decreased (e.g.,
K357-K5, log2FC
−2.8, adj. p-value = 0.02). In contrast, the
Dyrk2 RL mutant showed a mixed pattern, including increased
interaction between the N-terminal region and the C-terminal
lobe of the kinase domain and decreased interaction between the
N terminus and the rest of the protein (Fig.
5
d, f).
In conclusion, our topological data are in good agreement with
prior structural information and define specific topological
changes associated with the individual mutants. The abundance
differences of cross-linked peptides quantified by the PRM
method supported the comparison of topological changes. In
absence of additional experimental data, we can only speculate
about the exact relationship between the here described
phosphorylation and topological changes and the protein
interaction network. It is, however, reasonable to hypothesize
that some of the changes captured in our analysis can rationalize
the already discussed rewiring in the interactome of Dyrk2
mutants.
Effect of Dyrk2 mutants on the cellular phosphoproteome. The
wild-type form of the Dyrk2 kinase is expected to phosphorylate a
specific subset of the cellular proteome. We hypothesized that the
mutation-induced changes in the topology and phosphorylation
state of Dyrk2, and the ensuing changes in the core module and
the extended PPI network would leave a detectable footprint in
the cellular phosphoproteome and thus provide important
func-tional insights about the cellular functions affected by the
mutation. We therefore performed phosphoproteomic and
pro-teome abundance analyses of cells expressing Dyrk2 point
mutations. Dyrk2 mutants were genomically integrated via the
Flp–In recombination system into a Dyrk2 KO cell line
(T-REx-HeLa) engineered by CRISPR/Cas9 (Supplementary Fig. 5a, b)
and expressed in an inducible manner by the addition
of doxycycline (Supplementary Fig. 5c). The deletion of
endo-genous DYRK2 in the cell lines prevented a dilution of the
mutant-specific
phosphoproteomic
phenotypes
due
to
residual Dyrk2 wild-type activity, thus increasing the sensitivity
of the phospho-phenotyping. The quantitative phosphoproteomic
analysis
was
performed
by
SWATH–MS, followed by
phosphosite determination using LuciPHOr2
29,30(Supplemen-tary Note 1).
Hierarchical clustering of the phosphopeptide patterns revealed
a common pattern of phosphoproteome dysregulation for the
catalytically inactive Dyrk2 cell lines (KO and KR) and the
C-terminally truncated Dyrk2-mutant (Dyrk2 SX) (Fig.
6
a).
Speci-fically, in these cell lines, we observed a significant number of
downregulated phosphopeptides compared to cells expressing wt
Dyrk2. Between 21% and 47% of the quantified phosphopeptides
(adj. p-value
≤ 0.05) were downregulated with a log2
fold-change
≤ −1 in the kinase mutants (KR: 47%, 68 peptides, SX:
21%, 54 peptides) and the Dyrk2 KO (33%, 48 peptides). For
Dyrk2 SX, we also detected a fraction (8%, 20 peptides) of
upregulated phosphopeptides (Fig.
6
c).
Next, we analyzed the sequences of phosphopeptides with
decreased abundance and found that these were enriched in the
phosphorylation motif recognized by the Dyrk2 kinase (R/Kxx(x)
S/TP)
31(Fig.
6
d). This suggests that many of these phosphosites
represent putative direct substrates of Dyrk2 (e.g., MISP, log2FC
(KO)
= −2.2; MEP50, log2FC (KO) = −2.1; Supplementary
Table 1). In keeping with this
finding, mutations that showed
the most significant phosphoproteomic footprint also most
severely affected the kinase interaction network and generated a
strong interaction phenotype, as shown in the previous layer of
our proteomic workflow (Fig.
4
b, c). The second main cluster in
our phosphoproteomic analysis contains mutations with mild
interaction phenotype (Dyrk2 PL, SL, SP) that also showed only
weak effect on the phosphoproteome. To further confirm the
observed phosphoproteomic patterns, we performed in vitro
kinase assays with recombinant Dyrk2 variants (see
“Methods”
section, in vitro ADP-Glo kinase assay). The results confirm that
with the exception of the Dyrk2 KR mutant the tested kinase
mutants were still catalytically active and show comparable
activity to wt Dyrk2 (Supplementary Fig. 6a). Surprisingly, we
found that the expression of Dyrk2 PL, SL, and SP caused an
upregulation of several phosphopeptides (Fig.
6
c). For Dyrk2 PL,
the highest fraction (21% related to all quantified
phosphopep-tides, adj. p-value
≤ 0.05) of upregulated phosphopeptides were
found. Here, 20% of the upregulated phosphopeptides showed an
abundance change of log2FC > 2. Notably, the upregulated
phosphosites did not contain the Dyrk2 target motif or any
other clearly enriched phosphorylation motif, implying that the
enhanced phosphorylation rather resulted from indirect effects of
the Dyrk2 mutants on these proteins (Supplementary Fig. 6b).
Besides changes in Dyrk2 catalytic activity the observed
phosphoproteomic phenotype could be also due to protein
abundance changes of the phosphorylated proteins or Dyrk2 itself
or
finally to a combination of these effects. To rule out that the
observed effects on phosphopeptide level were due to protein
abundance changes, we performed a total proteome analysis by
a
b
c
d
Regulated (µlog2FCµ> 1) Un-regulated Phosphopeptides (%) Proteins (%) 10 90 99 <1 Regulated phosphopeptides (%) 0 10 20 30 40 50KO
KR
RL
PL
SL
SP
SX
Downregulated Upregulated KO KR SX RL PL SL SP DYRK2 phosphomotif R/K-x-x-(x)-p(S/T)-P 0 10 20 30 40 50 KO KR RL PL SL SP SX (%) Phosphopeptides containing DYRK2 phosphomotif RL PL SL SP SX KO KR Log2FC (mutant/WT) 4 2 0 2 4Fig. 6 The molecular footprint of Dyrk2 cancer-related mutations on the cellular phosphoproteome. a Heatmap with hierarchical clustering illustrating changes in the abundance of cellular phosphopeptides across the different cancer-related Dyrk2 point mutants. Only those peptides that have been detected at least once as statistically significantly changed (adj. p-value ≤ 0.01, │log2FC│ > 0.5) are displayed. b Content of regulated proteins and phosphopeptides summarized from all Dyrk2-mutant cell lines (regulated phosphopeptides:│log2FC│ > 1, adj. p-value ≤ 0.05). c Fraction of significantly upregulated or downregulated localized phosphopeptides in cell lines expressing the Dyrk2 point mutants (│log2FC│ > 1, adj. p-value ≤ 0.05). d Phosphomotif analysis of downregulated phosphopeptides in the different Dyrk2 variants (adj.p-value ≤ 0.05) (left panel). Fraction of downregulated phosphopeptides containing the Dyrk2 phosphomotif (right panel). The statistical analysis andp-value calculation (adj. p-value (FDR)) was performed within the mapDIA package60. Source data are provided as source datafile.
SWATH–MS, and consistently measured and quantified 5138
proteins (protein CV < 11%; protein FDR
≤ 3%) (Supplementary
Fig. 5g) across the cell lines. Compared to the phosphoproteomic
readout, we found only mild changes in protein levels upon
Dyrk2-mutant expression, indicating that protein abundance
measurement is less informative than the other analyzed layers
for the cellular impact of mutations. Across all mutant conditions,
only 0.2% (10 proteins, adj. p-value
≤ 0.05, │log2FC│ > 1) of
proteins showed altered abundance and, in contrast to the
phosphoproteome analysis, the catalytically inactive and
trun-cated Dyrk2 mutants did not emerge as cluster (Figs.
6
b and
7
a).
Instead, Dyrk2 RL and SL clustered together and showed the
highest number of significantly regulated protein abundances
(Dyrk2 RL: 107 proteins, Dyrk2 SL: 94 proteins, adj. p-value
≤
0.05,
│log2FC│ > 0.5). However, nearly all these proteins are only
moderately regulated, with a log2FC < 1 (RL: 103 proteins, SL: 94
proteins) indicating that the mutants generated a rather minor
and unspecific protein abundance footprint. Furthermore, we
found that (i) in the Dyrk2 KO as well as in the other mutant cell
lines the altered phosphopeptide abundances did not correlate
with the corresponding protein abundances (R
2= 0.0199, Dyrk2
KO) (Fig.
7
b; Supplementary Fig. 6c); (ii) the abundance of the
Dyrk2 mutants did not change compared to wt Dyrk2, except for
Dyrk2 SX that shows an elevated protein level (Supplementary
Fig. 5c). Taken together, these results suggest that changes on
phosphoproteome level result from genuine differential
phos-phorylation events induced by point mutations or the deletion of
DYRK2.
To identify cellular processes that might be affected by the
Dyrk2 mutations on phosphoproteome level, we performed an
enrichment analysis of GO terms on significantly regulated
phosphosites (adj. p-value
≤ 0.05, │log2FC│ > 1) from our data
set using DAVID (
https://david.ncifcrf.gov/
)
32(Fig.
7
c;
“Meth-ods” section).
In all mutants, we observed a regulation of phosphosites
belonging to proteins annotated to function in
“mRNA
proces-sing” (GO: 0006397) and “Cell-cell-adhesion” (GO: 0098609). For
the latter, we found a significant enrichment in the inactive
(Dyrk2 KR, p-value
= 2.05e−04) as well as in the putatively still
active Dyrk2 PL mutant (p-value
= 2.56e−06), consistent with
the reported role of Dyrk2 in cancer metastasis
9,33,34. Certain GO
terms were enriched only in a specific mutant group. In the
catalytically inactive (Dyrk2 KO, KR) and truncated mutant
(Dyrk2 SX), a significant number of regulated phosphosites
belonged to proteins involved in nuclear transport processes (e.g.,
“RNA export from the nucleus” (GO: 0006405, p-value = 2.5e
−02 (KR), p-value = 3.10e−05(KO))), consistent with the
disrupted binding of these mutants to the nuclear pore complex
observed in our differential interaction analysis. Remarkably,
both the serine missense mutations (Dyrk2 SL and Dyrk2 SP)
lead to a high number and significant enrichment (Dyrk2 SL,
p-value
= 3.38e−05; SP, p-value = 1.55e−04) of regulated
phos-phosites linked to transcriptional control (“positive regulation of
transcription from RNA polymerase II promoter” (GO:0045944))
in line with the involvement of Dyrk2 in transcriptional processes
and the regulation of protein synthesis
35–37.
Interestingly, we also detected 150 phosphopeptides (80
localized phosphopeptides, FLR
≤ 1%) belonging to CDPs.
Among them, 23 phosphosites were significantly regulated
(│log2FC│ > 1, adj. p-value ≤ 0.05) upon mutation or deletion
of DYRK2. Consistent with its impact on CDP interactions,
Dyrk2 SX caused the strongest effect on the phosphorylation of
CDPs, together with another cancer-related Dyrk2 point mutant
(Dyrk2 PL) (Fig.
7
d). In keeping with its effect on the interaction
with CDPs, the non-cancer-related Dyrk2 KR mutant showed a
rather
minor
effect
on
the
phosphorylation
of
CDPs.
Interestingly, some of the regulated CDP phosphosites were
found to be mutated in cancer tissues (e.g., NPM1 S125, PL
(log2FC
= 2.2), RL (log2FC = 2.04), SP (log2FC = 2.58)
38) or are
known to have a functional role in protein–protein interactions
(e.g., HMGA1 T53, Dyrk2 KR (log2FC
= 1.05), PL (log2FC =
1.21), and SX (log2FC
= 1.14))
39,40(Supplementary Table 2).
Together, our data reveal mutation-specific phosphoproteomic
signatures that can be both used to discriminate between different
mutant backgrounds and to gain insights into their phenotypic
effects. We observed a strong downregulation of several
phosphopeptides in those mutants having the strongest effects
on the interactome of Dyrk2, involving in particular processes
affected also in the interaction data, such as nuclear transport.
Network of cancer driver proteins perturbed by Dyrk2
mutants. Finally, we asked whether our data, combined with
prior knowledge about cancer proteins and PPI’s, could help
to identify important regulated modules and thereby rationalize
the putative role of the selected mutants in cancer.
The interaction analysis described above revealed that Dyrk2 is
associated with a higher-than-random number of CDPs (Fig.
3
b).
Furthermore, we found a clear effect of some cancer-related
Dyrk2 mutations on the interaction with CDPs (Fig.
4
d). To
understand the interplay between interaction and
phosphopro-teome CDP regulation, we combined the relevant data in a PPI
network based on previously deposited interactions between
regulated proteins (“Methods” section; Supplementary Note 2)
(Fig.
8
a). We found that the CDPs identified in our interaction
and phosphoproteome analysis form a network in which, overall,
Dyrk2 SX and RL exhibit the strongest regulatory effect (Figs.
7
d
and
8
a). Functional GO-term analysis of the regulated CDPs
revealed an enrichment of biological processes such as
“negative
regulation of cell proliferation” (GO:0008285, p-value = 7.3e−4),
“negative regulation of apoptotic processes” (GO:0043066, p =
1.4e−3) (Supplementary Note 3), “chromatin remodeling”
(GO:0006338,
p-value
= 5.3e−4), and “nuclear transport”
(GO:0051169, p-value
= 9.2e-3). Indeed, the deletion of DYRK2
significantly elevated proliferation in T-REx-HeLa cells as shown
by colony formation and MTT assay (Fig.
8
b; Supplementary
Fig. 7a). The result is in line with previous xenograft mouse
studies
8and supports a putative tumor suppressor function of
Dyrk2.
The phosphorylation and interaction of CDPs involved in
“nuclear transport” were mainly affected by the catalytically
inactive Dyrk2 mutants (Dyrk2 KO, KR) and Dyrk2 SX, in
keeping with their strong effect on the global phosphoproteome
(Fig.
8
a; Supplementary Note 4). Out of 18 localized NUP
phosphosites (FLR
≤ 1%) that were measured in our
phospho-proteomic analysis, only sites of NUP214, NUP98, and NUP88
were regulated by the Dyrk2 mutants KR and SX as well as Dyrk2
KO (Supplementary Fig. 7c). Interestingly, NUP214 and NUP88
are direct interaction partners and are associated with the nuclear
Y-complex that was identified as interactor of Dyrk2 in this
study
41,42. As shown above, the expression of Dyrk2 KR and SX
perturbed the binding to the subunits of the nuclear Y-complex,
which is in line with the significantly reduced phosphorylation of
the nearby subunits NUP214 and NUP88 in these mutants
identifying the nuclear pore complex as cellular module that is
affected at different functional levels (interaction and
phosphor-ylation) by Dyrk2 mutations.
In order to elucidate a putative functional role of Dyrk2 on the
nuclear pore complex (NPC), we aimed at validating the
Dyrk2-dependent phosphorylation of the cancer driver protein NUP214,
which is suggested to act as docking site in nuclear transport
processes
43. Indeed, in vitro phosphorylation of NUP214 with
recombinant Dyrk2 confirmed the protein as direct
phosphoryla-tion substrate of Dyrk2 (Fig.
8
d). Notably, the phosphorylation
state of NUPs has been shown to be important for their binding
to the NPC and the regulation of NPC assembly
44, which also
influences other NPC-related functions such as nuclear transport.
Based on this data, we propose a model for the putative role of
Dyrk2 at the NPC where the interaction with the nuclear
Y-complex promotes the phosphorylation of nearby NUPs by
Dyrk2 (Fig.
8
e), which potentially influences the association of
these NUPs with the NPC.
Overall, our data illustrate how the combination of different
layers of proteomic information not only improves our ability to
discriminate between the effects of different mutants and
interpret their functional and cellular effects, but also suggests
mechanistic and causal links exemplified by the impact of Dyrk2
mutants on components of the nuclear pore complex. We
a
b
c
d
−4 −2 0 2 4 Log2FC (mutant/WT) RL SX SL PL SP KO KR −0.4 −0.2 0.0 0.2 0.4 −5.0 −2.5 0.0 2.5 5.0 Dyrk2 KOPhosphopeptides log2FC (mutant/WT)
Protein a b undances log2FC (mutant/WT) R = 0.01992 0 5 10 15 20 % of regulated phosphopeptides M itotic nuclear en v. disassem b ly tR NA export from nucleus Regulation of glucose transport V iral transcription mR NA export from the nucleus R NA export from the nucleus Regulation of cellular response to heat Translational initiation V iral process Cell − cell adhesion mR NA processing Protein sumo y lation R NA secondar y struct .unwinding Positi v e reg . of trans . from R NA pol . II promoter SX KO KR PL RL SP SL
*
*
*
*
*
*
*
*
*
*
*
*
*
*
*
*
Nuclear pore A ff e c te d CDPs (%) 0 10 20 30 40 50 60 70 80 90 100 KO KR RL PL SL SP SX Interactome PhosphoproteomeFig. 7 Further proteomic and phosphoproteomic analysis of Dyrk2 mutants. a Heatmap showing differences in protein abundances across the different cancer-related Dyrk2 point mutants. Only those proteins that have been detected at least once as statistically significantly changed (adj. p-value ≤ 0.01, │log2FC│ > 0.5) are displayed. b Correlation of log2 fold changes between significantly regulated phosphopeptides and the corresponding protein identified in DYRK2 KO cells (adj. p-value ≤ 0.05). c Biological processes GO-term analysis of regulated phosphopeptides identified in the different Dyrk2 mutants. The asterisk indicates an significant enrichment of the GO term (p-value ≤ 0.05). The p-value for GO-term enrichment was obtained from DAVID32.d Effect of Dyrk2 point mutations on the interaction and phosphorylation of cancer driver proteins identified in the interaction and phosphoproteome analysis of this study (│log2FC│ > 1, adj. p-value ≤ 0.05). The statistical analysis and p-value calculation (adj. p-value (FDR)) was performed within the mapDIA package60. Source data are provided as source datafile.
a
b
PBRM1 MYC TP53 BIRC6 UBR5 NPM1 FLNA NCOR2 FANCE HMGA1 NUP214 NUP98 KNT1 PPP6C ARHGEF12 ARID1A BRD4 RAF1 CXCR4 ELL SF3B1 PCBP1 NUMA1 AFF4 PRKAR1A EML4 LSM14A PSIP1 RANBP2 Chromatin binding/ remodeling Cell proliferation/ApoptosisNuclear transport
DNA damage RBM10 BCLAF1 PCM1 NUP214 KO SX KR RL SP SL PL Downregulated Upregulated Mixed No sign. Change SX KR RL SP SL PL KO Phospho PPI P NUP96 NUP160 NUP85 NUP107 NUP214 NUP88 NUP133 NPC Y-complex Dyrk2 Phosphoproteomics Interactomics WT KO Dyrk2 ATP NUP214 kDa 37 37 100 D-phospho S/T D-His D-Dyrk2 Phospho S/T-NUP214 His-NUP214 GST-Dyrk2c
d
e
Colonies 0 100 200 300 400 500*
KO WT p = 1.5e–4 A poptotic cells (%) 0 5 10 15 20 25 30 35 40 45 WT KR SX*
p = 4.3e–3Fig. 8 Impact of Dyrk2 mutations on the network of known cancer driver proteins. a Network of cancer driver proteins (Cancer Gene Census) found to be significantly regulated either at the phospho level (|log2FC | > 1, adj. p-value ≤ 0.05) and/or at the interactome level (|log2FC | > 1, adj. p-value < 0.05). The statistical analysis andp-value calculation (adj. p-value (FDR)) was either performed within the mapDIA package (phosphodata) or with two-tailed unpaired Student’s t-test and p-values were adjusted using the method of Benjamini–Hochberg67(interaction data). The network is based on reported interactions between the proteins (IID v.2018-05; only experimentally validated interactions). The gene ontology analysis was performed with DAVID and significant terms (p-values < 0.05) were merged in general terms (“Methods” section). The regulation of the interaction and phosphorylation of cancer driver proteins by Dyrk2 mutants is illustrated with a color code. For PCM1 the lower color code shows the regulation on interactome level, the upper color code shows the regulation on phosphorylation level.b Colony formation assay of CRISPR/Cas9 engineered T-REx-HeLaDYRK2 KO cells. c Annexin V-FITC apoptosis assay of MDA-MB-213 cells overexpressing Dyrk2 wt or Dyrk2 KR and Dyrk2 SX, respectively.d In vitro phosphorylation assay using recombinant Dyrk2 and NUP214 (Ser601-Arg868) incubated for 1 h at 37 °C. Phosphorylation was detected by an anti-phospho-serine/threonine antibody. The experiment was repeated independently (n = 2) with similar results. e Model of the putative function of Dyrk2 at the nuclear pore complex (NPC). As shown by BioID–MS Dyrk2 interacts with subunits of the nuclear Y-complex. Quantitative phosphoproteomic analysis revealed a Dyrk2-dependent phosphorylation of NUP214 and NUP88, which represent direct interaction partners of the Y-complex. Error bars represent the mean value (center) with 95% confidence interval (n = 3 biologically independent experiments). Statistical analysis was performed with two-tailed unpaired Student’s t-test. The asterisk indicates a significant statistical difference (p-value ≤ 0.05). Source data are provided as source data file.