HAL Id: hal-02995355
https://hal.archives-ouvertes.fr/hal-02995355
Submitted on 19 Nov 2020
HAL is a multi-disciplinary open access archive for the deposit and dissemination of sci-entific research documents, whether they are pub-lished or not. The documents may come from teaching and research institutions in France or abroad, or from public or private research centers.
L’archive ouverte pluridisciplinaire HAL, est destinée au dépôt et à la diffusion de documents scientifiques de niveau recherche, publiés ou non, émanant des établissements d’enseignement et de recherche français ou étrangers, des laboratoires publics ou privés.
Eva Lievens, Yannis Michalakis, Thomas Lenormand
To cite this version:
Eva Lievens, Yannis Michalakis, Thomas Lenormand. Trait-specific trade-offs prevent niche expansion in two parasites. Journal of Evolutionary Biology, Wiley, 2020, �10.1111/jeb.13708�. �hal-02995355�
T
RAIT-
SPECIFIC TRADE-
OFFS PREVENT NICHE EXPANSION IN TWO PARASITES 1Eva J. P. Lievens1,2, Yannis Michalakis2,† and Thomas Lenormand1,† 2
†equal contribution 3
1UMR 5175 CEFE, CNRS–Université de Montpellier–Université P. Valéry–EPHE, 1919 Route de Mende, 4
34293 Montpellier Cedex 5, France 5
2UMR 5290 MIVEGEC, CNRS–IRD–Université de Montpellier, 911 Avenue Agropolis BP 64501, 34394 6
Montpellier Cedex 5, France 7
A
BSTRACT 8The evolution of host specialization has been studied intensively, yet it is still often difficult to determine 9
why parasites do not evolve broader niches – in particular when the available hosts are closely related 10
and ecologically similar. Here, we used an experimental evolution approach to study the evolution of 11
parasite specialization, and its underlying traits, in two sympatric parasites: Anostracospora rigaudi and 12
Enterocytospora artemiae, microsporidians infecting the brine shrimp Artemia franciscana and Artemia
13
parthenogenetica. In the field, both parasites regularly infect both hosts, yet experimental work has
14
revealed that they are each semi-specialized. We serially passaged the parasites on one, the other, or an 15
alternation of the two hosts; after ten passages, we assayed the infectivity, virulence, and spore 16
production rate of the evolved lines. In accordance with previous studies, A. rigaudi maintained a higher 17
fitness on A. parthenogenetica, and E. artemiae on A. franciscana, in all treatments. Further, we showed 18
that the origin of this specialization was not infectivity, which readily evolved and showed a weak trade-19
off among host species for both parasites. Instead, there was a strong trade-off in spore production, 20
suggesting that the ability to exploit the host and produce spores is the barrier preventing the evolution 21
of generalism in this system. Intriguingly, the trait-specific trade-offs appear to be very similar for both 22
parasites. This study highlights that the shape of between-host trade-offs can be very heterogeneous 23
across parasite traits, so that only some traits are pivotal to specialization. 24
K
EYWORDS 25Ecological specialization, niche, host specificity, experimental evolution, parasite life history, multi-host 26
parasites, Artemia, microsporidians. 27
I
NTRODUCTION 28Most parasites manifest a degree of specialization in nature, with niches that do not cover the entire 29
community of potential hosts. This occurs even in communities of ecologically and physiologically similar 30
host species (e.g. Antonovics et al. 2002, Hall et al. 2009, Streicker et al. 2013, Lievens et al. 2019), 31
begging the question of why parasites do not evolve to extend their niche. Answering this question is 32
particularly relevant when trying to predict the future evolution of a parasite, for example with regards 33
to the emergence of new diseases (Cleaveland et al. 2001) or the impact of invasive hosts (Prenter et al. 34
2004, Kelly et al. 2009). 35
The evolution of host specialization – i.e. the evolution of parasitic niches – is generally studied through 36
the lens of ecological specialization theory. A cornerstone of specialization theory is the assumption that 37
adaptation to one environment trades off with adaptation to another (reviewed in e.g. Futuyma and 38
Moreno 1988, Kassen 2002, Ravigne et al. 2009). The strength of the fitness trade-offs determines, to a 39
large degree, whether specialist or generalist strategies evolve: strong trade-offs favor the evolution of 40
specialists, while weak trade-offs favor the evolution of generalists. At first glance, therefore, we might 41
view specialism in a parasite population as an indicator that there are strong fitness trade-offs between 42
the hosts. This would imply that the parasite could never evolve to become a generalist. However, 43
specialization is also governed by the availability and demography of the different environments (e.g. 44
Bell and Reboud 1997, Ronce and Kirkpatrick 2001, Ravigne et al. 2009). Low encounter rates with the 45
alternative host can maintain specialism in spite of weak trade-offs (Benmayor et al. 2009), especially if 46
that host is an ecological sink (Holt and Gaines 1992, Holt and Hochberg 2002, Lenormand 2002, Ching 47
et al. 2013). In this case, a demographic change in the host community could indeed prompt a shift 48
towards generalism in the parasite. This scenario would seem especially likely among similar host 49
species, where we might expect trade-offs to be weaker (cf. Hereford 2009). To disentangle the 50
consequences of trade-offs from those of host availability, experimental evolution studies are necessary 51
(cf. Kassen 2002, Fry 2003). 52
Many experimental evolution studies have been done on parasite specialization, yielding a variety of 53
outcomes: evidence for fitness trade-offs (e.g. Turner and Elena 2000, Yourth and Schmid-Hempel 2006, 54
Legros and Koella 2010), mixed support for trade-offs (e.g. Fry 1996, Agrawal 2000, Nidelet and Kaltz 55
2007, Magalhães et al. 2009, Bedhomme et al. 2012, Messina and Durham 2015), selection for 56
generalism in fluctuating environments (e.g. Poullain et al. 2008, Bruns et al. 2014, Magalhães et al. 57
2014), and complex effects of migration and host availability (e.g. Benmayor et al. 2009, Ching et al. 58
2013). However, experimental evolution studies that take the natural context of parasite populations 59
into account are rare (Jaenike and Dombeck 1998, Fellous et al. 2014). In addition, few studies look for 60
the traits underlying fitness trade-offs (Jaenike and Dombeck 1998, Magalhães et al. 2009, Bedhomme 61
et al. 2012, Messina and Durham 2015). Parasite fitness is a composite of successful infection, host 62
exploitation, and transmission success, and any of these traits may pose problems when adapting to 63
new hosts. Low fitness in a new host may result from strong trade-offs in one or a few key traits, or from 64
the accumulation of weak trade-offs in most traits. However, only strong trade-offs may prevent the 65
evolution of a generalist parasite on the long term. Identifying whether such key traits occur is a largely 66
unexplored, but crucial question to understand patterns of host specialization. 67
In this study, we investigated whether trade-offs in host use limit the evolution of specialization of two 68
naturally occurring parasites, and if so, upon which traits these trade-offs act. We used the 69
microsporidians Anostracospora rigaudi and Enterocytospora artemiae and their sympatric hosts, the 70
brine shrimp Artemia parthenogenetica and Artemia franciscana. The two parasites are ecologically 71
similar, can complete their life cycles on both hosts, and commonly infect both hosts in the field (Rode 72
et al. 2013b). Nonetheless, they each show a degree of specialization: A. rigaudi has much higher fitness 73
in A. parthenogenetica and cannot persist without this host in the field, while E. artemiae’s fitness is 74
much higher in A. franciscana (Lievens et al. 2018, 2019). To disentangle the effects of host availability 75
from trade-offs for these semi-specialized parasites, we manipulated their host environment by serially 76
passaging them on one, the other, or an alternation of the two hosts. We then assayed the infectivity, 77
virulence, and spore production rate of the evolved lines, and asked: [1] did manipulating the host 78
environment affect the degree of specialization of the parasites?; [2] what was the role of the 79
underlying traits?; and [3] were these results consistent with trade-offs in host use? 80
M
ETHODS 81Hosts and parasites
82
Natural system
83
Artemia is a genus of small crustaceans occurring in hypersaline environments. Our study system, the
84
saltern of Aigues-Mortes on the Mediterranean coast of France, contains two sympatric Artemia species. 85
The first, A. parthenogenetica, is an asexual clade native to the area; the second, A. franciscana, is a 86
sexual species that was introduced from North America in 1970 and has since become highly prevalent 87
(Amat et al. 2005, Rode et al. 2013b). The two species coexist for most of the year, and can usually be 88
found in the same microhabitats (Lievens et al. 2019). 89
A. rigaudi and E. artemiae are two of the most prominent parasites infecting Artemia in Aigues-Mortes,
90
with infections of either reaching prevalences of up to 100% in both host species (Lievens et al. 2019). 91
Both microsporidians are horizontally transmitted parasites of the gut epithelium: once established, 92
infections continuously release spores into the environment with the host’s feces (Rode et al. 2013a). 93
Experiments revealed that the fitness of A. rigaudi and E. artemiae is higher when infecting respectively 94
A. parthenogenetica and A. franciscana (Lievens et al. 2019). This is mainly due to differences in spore
95
production, although E. artemiae is also a poor infector of A. parthenogenetica and A. rigaudi has 96
suboptimal virulence in A. franciscana. 97
Origin of experimental parasites
98
We obtained our experimental parasites from the same laboratory stocks of A. rigaudi and E. artemiae 99
that were used by Lievens et al. (2019) to estimate infectivity, virulence, and spore production. The 100
microsporidians in these stocks were collected in Aigues-Mortes and maintained on a mix of both hosts. 101
Before starting the serial passages, we made sure that the stocks were singly infected by using them to 102
infect lab-bred hosts, testing those hosts for the presence of both microsporidians, and re-starting the 103
stocks from singly infected hosts only (see Supplementary Material for more details). Note that although 104
we tried to maximize the genetic diversity of our stocks by using spores produced by both host species, 105
originating in several sites and at different times, we do not know if the resulting microsporidian 106
populations were genetically diverse or not. 107
Experimental evolution
108
We serially passaged the microsporidians A. rigaudi and E. artemiae on the host species A. franciscana, 109
A. parthenogenetica, or an alternation of the two. After 10 passages, we assayed the infectivity,
110
virulence, and spore production of each line, and compared these among treatments. 111
Experimental conditions
112
See Supplementary Methods. 113
Serial passages
114
We subjected A. rigaudi and E. artemiae to serial passaging under three evolutionary treatments: ‘A. f. 115
host’, ‘A. p. host’, and ‘Alternating hosts’. In the first two regimes, the parasites encountered only A. 116
franciscana or only A. parthenogenetica; in the third regime, the parasites encountered alternating 117
passages of A. franciscana and A. parthenogenetica. Each microsporidian × treatment combination was 118
replicated four times, producing a total of 24 parasite lines. Parasites underwent ten serial passages, 119
each lasting three weeks. The protocol is depicted in Fig. 1; details can be found in the Supplementary 120
Methods. 121
Two aspects of our passaging protocol should be pointed out: first, the time between passages (three 122
weeks) is enough to allow infections to be transmitted within passaged groups (Rode et al. 2013a). Thus, 123
low infection rates at the start of a passage could be compensated by high within-passage transmission. 124
Second, we did not control the number of spores that were transmitted from one group of hosts to the 125
next. Thus, the size of the inoculum and of the microsporidian population in all passages after P1 were 126
dependent on the infection dynamics that developed within each replicate line. 127
Final assays
128
At the end of the serial passage experiment, we tested the infectivity, virulence, and spore production of 129
each evolved line in both A. franciscana and A. parthenogenetica. We tested all surviving parasite lines 130
based on the spores they produced at the end of P10, and an additional subset of the parasite lines 131
based on backup spores collected after P6 (see Results). Details on spore collection after P6 and P10 can 132
be found in the Supplementary Methods. 133
We performed two final assays (described in Fig. 1, details in the Supplementary Methods). The first 134
assay tested the infectivity of the evolved lines; it was replicated on 40 A. parthenogenetica and 40 A. 135
franciscana individuals for each line. In parallel with the first, a second assay tested the virulence and
136
spore production of each evolved line. This assay was also replicated on 40 A. parthenogenetica and 40 137
A. franciscana per evolved line. Because we suspected that there would be fewer infections when A.
138
parthenogenetica was exposed to E. artemiae, we increased the level of replication for these
139
combinations, adding an extra 20 A. parthenogenetica. We also included 80 control A. parthenogenetica 140
and 80 control A. franciscana, which were not exposed to spores but otherwise treated identically. 141
Spore production was measured by quantifying the number of spores produced by infected individuals 142
over a two-day period after three weeks of infection; this corresponds to the window for transmission 143
during the serial passage experiment. 144
Statistical analyses
All analyses were carried out in R version 3.5.1 (R Core Team 2014), using the packages lme4 (linear 146
mixed modeling, Bates et al. 2015) and survival (survival analyses, Therneau 2014). Unless stated 147
otherwise, we built full models with the relevant experimental factors, and tested for the significance of 148
effects using the likelihood ratio test. If post-hoc testing was necessary, we used Tukey HSD tests from 149
the packages multcomp (Hothorn et al. 2008) and lsmeans [ref]. 150
Serial passages
151
During the serial passage experiment, we collected data on host survival and parasite population size. 152
Here, we tested whether these variables changed over the course of the experiment. 153
Host survival was quantified as the proportion of surviving hosts in each line at the end of each passage. 154
Because we did not maintain “control” host populations during the serial passage experiment, host 155
survival is relative (e.g. survival in ‘Alternating hosts’ vs. ‘A. f. host’ treatments), and can only be 156
compared within host species; we therefore analyzed it separately for A. franciscana and A. 157
parthenogenetica. Linear mixed models included survival as a binomial response variable, Treatment,
158
Passage number (as a continuous variable measuring time), Parasite species and all interactions as fixed
159
effects, and Line as a random effect. In addition, we included Passage as a random factor, to control for 160
background variation in the quality of the hosts. Lines where parasites were lost (see Results) were 161
excluded. 162
To test whether the parasite population size changed, we built linear mixed models including Treatment, 163
Passage number (as a continuous variable measuring time), and their interaction as fixed effects, and
164
Line as a random variable. A. rigaudi and E. artemiae lines were analyzed separately. The population size
165
was ln-transformed, and zero counts (lost lines) were excluded. 166
Final assays
167
In the final assays, we tested the effects of the passaging treatment on the infectivity, virulence, and 168
spore production of the two parasites; we then compared a composite measure of parasite fitness. For 169
each variable described below, analyses proceeded as follows. A. rigaudi and E. artemiae lines were 170
analyzed separately. We began by testing whether surviving and revived lines were different, looking 171
only at those treatments that included revived lines (models with fixed effects Revival, Treatment, Assay 172
host, and their interactions). If they were not different, the revived lines were included in the
173
subsequent analyses (models with fixed effects Treatment, Assay host, and their interaction). Line was 174
always included as a random variable, or as a frailty variable for survival analyses. 175
Infectivity was analyzed as the proportion of infected individuals at the end of the first assay (a binomial 176
response) in a generalized linear mixed model. For virulence, the effects of Treatment were tested using 177
log-logistic survival models, stratified over Assay host (this allowed the host species to have a different 178
baseline survival shape). So that the results could be interpreted in terms of survival relative to 179
uninfected hosts, we included the survival data of the control hosts as an additional Treatment category. 180
However, we excluded any hosts that had been exposed to a parasite but not infected (cf. Lievens et al. 181
2018). We also excluded any hosts that died before day 11 of the assay, because infection could not be 182
reliably detected before this day (see Supplementary Methods). To analyze the effects on spore 183
production, we used the spore count in the fecal sample as a negative binomial response variable in a 184
generalized linear mixed model.Fecal samples were only pooled for infected individuals; uninfected 185
hosts were therefore implicitly excluded from the model. 186
Finally, we used spore production and infectivity to produce a composite fitness measure for each line. 187
We used a measure of fitness that was representative for the context of the experiment, being the 188
projected number of infections occurring if the line were passaged onto a new set of susceptible hosts. 189
We calculated this as the total number of spores produced by the surviving individuals over a two-day 190
period after three weeks of incubation (thus virulence is implicit), multiplied by the infectiousness of a 191
single spore. Infectiousness, the probability of a single spore to start an infection, was calculated based 192
on the results of the first assay. Following an independent action model with birth-death processes, the 193
infectiousness of one spore is − ln (𝑛𝑜𝑛𝑖𝑛𝑓𝑒𝑐𝑡𝑒𝑑𝑒𝑥𝑝𝑜𝑠𝑒𝑑 ) /𝐷, where D is the spore dose, in our case 750 spores 194
(Schmid-Hempel 2011, pg. 225-6). We analyzed fitness using a linear mixed model, after ln+1 195 transformation. 196
R
ESULTS 197Serial passages
198Of the twenty four parasite lines, four were lost during passaging (Table 1). Two of these were lost 199
before we could collect a backup spore sample after P6; of the other two, only one line’s P6 spores 200
could be revived and used in the final assays. 201
At the beginning of passages P5, P6, and P7, exceptionally high mortality occurred in several groups of 202
new hosts as they were being exposed to the parasites produced by the old hosts (Table 2). These 203
episodes were concentrated in the treatments ‘A. f. host’. Notably, the passaging step from P5 to P6 was 204
repeated three times without success for the line E. artemiae × ’A. f. host’ – Replicate 4. The transfer 205
was eventually achieved after 6 weeks of incubation in the P5 hosts, as the other lines were being 206
passaged from P6 to P7. We denote this transfer as ‘P5 P7’ for consistency, but P7 is only the 6th 207
passage for this particular line. To investigate whether these effects were due to increased virulence or 208
demographic effects (increased parasite load), we included backup spores produced by these lines in the 209
final assays (see below). 210
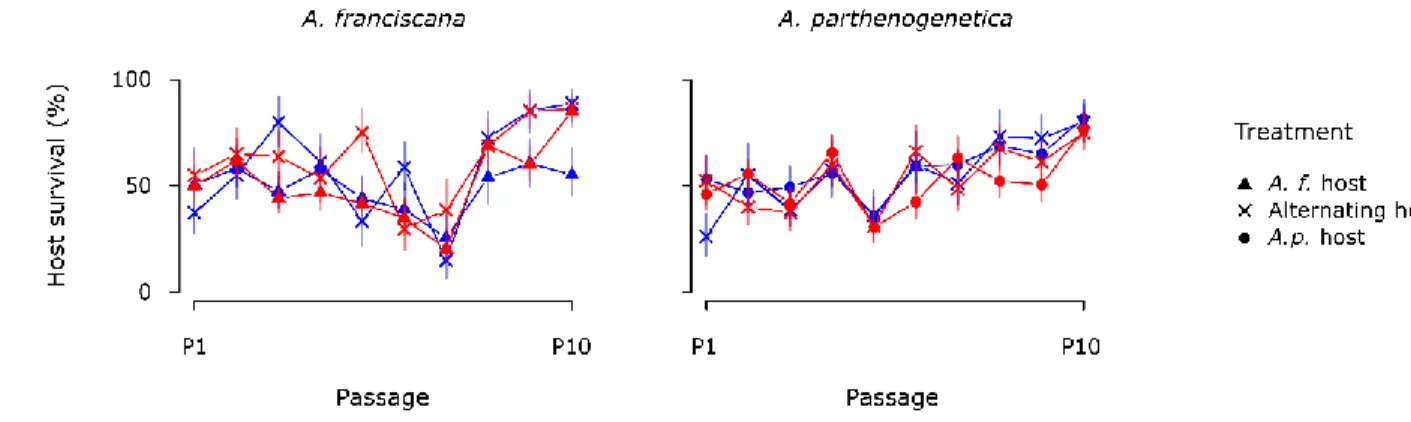
Host survival was not constant throughout the serial passage experiment, even when the background 211
variation in host quality was taken into account (Fig. 2). As the passages progressed, the survival of A. 212
franciscana in A. rigaudi × ’A. f. host’ lines decreased as compared to the others (significant triple
213
interaction, χ2(2) = 5.5, p = 0.02, Supp. Table 1; post-hoc -4.1 < z < -2.5, 0.0001 < p < 0.06). Because we 214
could not separate the background host mortality from parasite-induced effects, we cannot say whether 215
this change was due to increasing parasite-induced mortality in the A. rigaudi × ’A. f. host’ lines, or to 216
decreasing parasite-induced mortality in the other lines. For A. parthenogenetica, survival rates became 217
progressively higher in A. rigaudi relative to E. artemiae lines, as well as in ‘Alternating hosts’ relative to 218
‘A. p. host’ lines (significant effects of Parasite species and Treatment in interaction with Passage 219
number, χ2(1) = 11.4 and 8.6, p < 0.001 and p < 0.01, respectively, Supp. Table 1). Again, we could not 220
distinguish between positive changes in A. rigaudi and ‘Alternating hosts’ lines or negative changes in E. 221
artemiae and ‘A. p. host’ lines.
222
The estimated population size of the parasites also varied through time (Fig. 3). For A. rigaudi, the 223
population grew over the course of the experiment (χ2(1) = 10.0, p < 0.01 for Passage number, Supp. 224
Table 1), and was significantly larger for lines evolving on A. parthenogenetica than for lines evolving on 225
A. franciscana (χ2(2) = 7.2, p = 0.03 for Treatment, Supp. Table 1; post-hoc z = 2.7, p = 0.02). For E. 226
artemiae, only the passaging regime impacted the population size, which was significantly higher in lines
227
evolving on A. franciscana than in those evolving on A. parthenogenetica (χ2(2) = 10.4, p < 0.01 for 228
Treatment, Supp. Table 1; post-hoc z = 3.3, p < 0.01).
229
Final assays
230
During the final assays, we tested all surviving evolved lines, as well as a set of lines revived from the 231
backup P6 spore samples (Table 3). These included all the lines in the parasite/treatment combination E. 232
artemiae × ’A. f. host’, most of which experienced a period of exceptional mortality during the
233
transmission events before the end of P6 (Table 2). The two E. artemiae × ’Alternating hosts’ lines whose 234
P6 hosts were A. franciscana (Replicates 1 & 2) were also revived to act as controls for the effect of 235
storage, but revival was only successful for Replicate 2. Finally, we succeeded in reviving the spores of 236
the lost line A. rigaudi × ’A. f. host’ – Replicate 2. 237
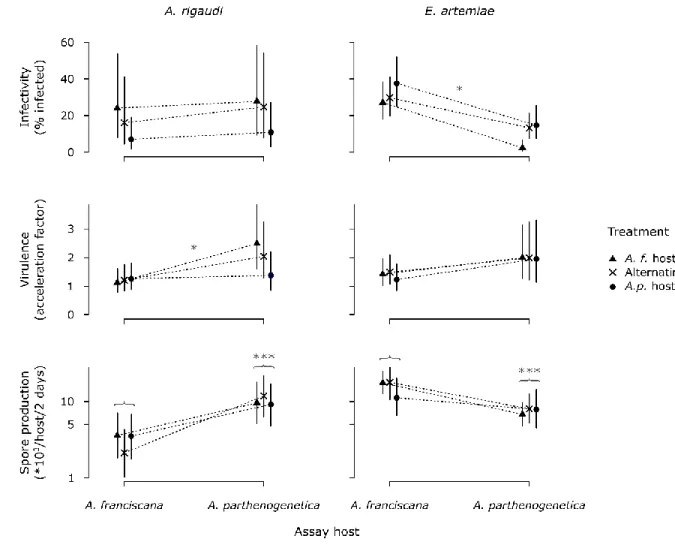
In the first assay, we tested for effects of passaging treatment on infectivity (Fig. 4, replicates shown in 238
Supp. Fig. 1). The infectivity of A. rigaudi was unaffected by storage effects (χ2(1) = 1.6, p = 0.21), and did 239
not change in response to passaging treatment (χ2(2) = 2.8, p = 0.25, Supp. Table 2); it tended to be 240
higher in A. parthenogenetica (χ2(1) = 3.7, p = 0.054, Supp. Table 2). In contrast, the infectivity of E. 241
artemiae was reduced by storage at 4°C (χ2(1) = 4.6, p = 0.03; dashed lines in Supp. Fig. 1), so the revived 242
lines were excluded from further analysis. The infectivity of surviving E. artemiae lines was generally 243
higher in A. franciscana than in A. parthenogenetica, but the difference was less strong after passaging 244
on ‘Alternating hosts’ and ‘A. p. host’ (χ2(2) = 8.1, p = 0.02 for interaction effect, Supp. Table 2). 245
In the second assay, we tested for effects of passaging treatment on virulence and spore production. As 246
expected, we detected infection in the majority of the exposed hosts in all host-parasite combinations 247
except A. parthenogenetica-E. artemiae (Table 4). No infection was detected for the line A. rigaudi × ’A. 248
p. host’ – Replicate 1, so it was excluded from further analyses.
249
For both A. rigaudi and E. artemiae, parasite-induced mortality was unaffected by storage at 4°C 250
(respectively χ2(1.0) = 0.2, p = 0.64 and χ2(1.2) = 0.9, p = 0.39). The revived lines were therefore included 251
in the analyses. Overall, mortality was higher for A. parthenogenetica. For A. rigaudi, there was an 252
additional effect of passaging treatment: when assayed on A. parthenogenetica, virulence was highest 253
for lines passaged on A. franciscana, intermediate for lines passaged on alternating hosts, and lowest for 254
lines passaged on A. parthenogenetica itself (χ2(3.0) = 10.4, p = 0.02 for interaction effect, Supp. Table 255
2). For E. artemiae lines, background mortality was also higher for A. parthenogenetica (χ2(4) = 58.1, p < 256
0.0001, Supp. Table 2), but infected hosts did not die faster than controls: virulence was not affected by 257
passaging treatment, nor by the interaction between treatment and assay host (χ2(3.6) = 3.7, p = 0.38 258
and χ2(4.5) = 5.8, p = 0.27, respectively, Supp. Table 2; Fig. 4, replicates shown in Supp. Fig. 2). 259
Similarly, spore production at passaging was unaffected by storage at 4°C (χ2(1) = 0.2, p = 0.69 for A. 260
rigaudi; χ2(1) = 0.8, p = 0.38 for E. artemiae), so all lines were included in the further analyses. Spore 261
production was higher in A. parthenogenetica for A. rigaudi and in A. franciscana for E. artemiae (χ2(1) = 262
14.8 and = 16.5, p = 0.0001 and < 0.0001, respectively, Supp. Table 2). However, there were no effects of 263
treatment, nor of the interaction between treatment and assay host (χ2(2) ≤ 0.7 and ≤ 1.7, p ≥ 0.71 and ≥ 264
0.43, respectively, Supp. Table 2; Fig. 4, replicates shown in Supp. Fig. 3). 265
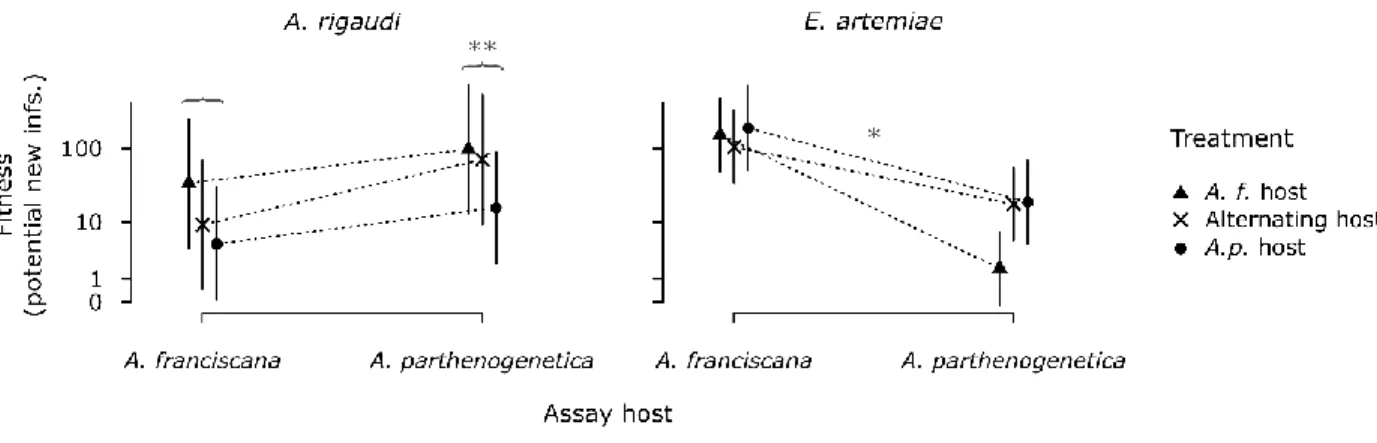
Finally, we analyzed an overall fitness measure for each line: the projected number of hosts that would 266
be infected at passaging (Fig. 5). For A. rigaudi, storage at 4°C had no effect on the composite traits of 267
fitness (see above), so the single revived line was included in the analysis. We also included the line A. 268
rigaudi × ’A. p. host’ – Replicate 1, which failed to infect hosts in the second assay, with fitness set to 0
269
(excluding the line did not change the results). A. rigaudi fitness was always higher when tested on A. 270
parthenogenetica, with no effect of passaging treatment, or of the interaction between treatment and
271
assay host (χ2(1) = 11.9, χ2(2) = 2.2 and 2.5, p < 0.001, = 0.34 and = 0.29, respectively, Supp. Table 2). For 272
E. artemiae, in contrast, the patterns of fitness mirrored those of infectivity. As storage at 4°C affected
273
infectivity (see above), the revived lines were excluded. E. artemiae fitness was always lower in A. 274
parthenogenetica, but less so after passaging on ‘Alternating hosts’ and ‘A. p. host’ (χ2(2) = 6.4, p = 0.04 275
for interaction effect, Supp. Table 2). 276
D
ISCUSSION 277We investigated the evolution of host specialization, and its underlying traits, in the microsporidian 278
parasites A. rigaudi and E. artemiae. In the field, these parasites infect two sympatric species of Artemia, 279
each with a degree of host specialization: A. rigaudi is preferentially adapted to A. parthenogenetica, 280
and E. artemiae to A. franciscana (the “matched” hosts, Lievens et al. 2018). To test whether this 281
pattern is shaped by host availability or by fitness trade-offs, we experimentally evolved the parasites on 282
one or both of their natural hosts. We found that the parasites remained semi-specialized in all 283
passaging conditions. The different parasite traits did not play an equal role in this outcome: spore 284
production remained specialized in both parasites, infectivity readily evolved towards generalism, and 285
virulence played a minor role. Our results are consistent with a strong trade-off acting on spore 286
production and a weak trade-off on infectivity, and suggest that spore production is the key trait 287
preventing the evolution of generalism in this system. 288
The evolution of specialization and its underlying traits
289
Our first conclusion is that both A. rigaudi and E. artemiae display a robust pattern of specialization: the 290
fitness of both microsporidians was higher in the matched hosts than in the mismatched hosts, even 291
after extended passaging on the latter (Fig. 5). This result is consistent with our previous ecology- and 292
life history-based findings (Lievens et al. 2018, 2019), and aligns with the general host-conservative 293
behavior of microsporidians (Smith 2009). 294
A. rigaudi’s specialization for A. parthenogenetica was caused by a disparity in spore production. This
295
parasite produced many more spores in A. parthenogenetica. Neither infectivity nor spore production 296
changed detectably during the serial passages, but the passaging treatment did affect virulence (Fig. 4). 297
When tested in A. parthenogenetica, A. rigaudi lines that had evolved on that host were less virulent 298
than lines that had evolved on A. franciscana. Whether this was due to an incidentally high virulence on 299
a ‘novel’ host, or to an adaptive decrease in virulence on a ‘known’ host, is unknown, but both are 300
plausible (Woolhouse et al. 2001, Alizon et al. 2009). The effect of virulence on overall fitness was minor, 301
however, so the parasite stayed equally specialized for A. parthenogenetica in all treatments (Fig. 5). 302
These results correspond well with previous findings (Lievens et al. 2018). 303
For E. artemiae, specialization was apparent for spore production and infectivity. E. artemiae spores had 304
a higher chance of infecting A. franciscana, and E. artemiae infections also produced more spores in A. 305
franciscana (Fig. 4). Compounded, these two traits produce a clear pattern of specialization (Fig. 5).
306
Unlike that of A. rigaudi, however, E. artemiae’s fitness did evolve in some treatments. E. artemiae lines 307
whose passaging history included A. parthenogenetica had a higher fitness on this host, while their 308
fitness in A. franciscana was not detectably changed (compare cross & circle to triangle in Fig. 5). E. 309
artemiae can thus evolve a more generalist strategy without a detectable trade-off. This observation
310
supports the mounting evidence that “costs” of adaptation to different environments may not always be 311
present, as expected theoretically (Lenormand et al. 2018) and observed empirically (Falconer 1990, 312
Agrawal 2000, Kassen 2002, Nidelet and Kaltz 2007, Magalhães et al. 2009, Bedhomme et al. 2012, 313
Remold 2012, Gallet et al. 2014, Messina and Durham 2015). E. artemiae’s fitness change was driven by 314
a change in infectivity, while virulence and spore production were static. Interestingly, changes in 315
infectivity have also been found to drive the evolution of specialists and generalists in the 316
microsporidian Brachiola algerae, although in this case there was a correlated loss of infectivity in other 317
hosts (Legros and Koella 2010). 318
The difference in infectivity among the evolved lines of E. artemiae can be interpreted in two ways: its 319
infectivity in A. parthenogenetica either decreased when the parasite was no longer exposed to this 320
host, or increased when the parasite was forced to persist in it. We consider the second to be more 321
likely. The first possibility could be achieved by the accumulation of conditionally deleterious alleles 322
(neutral in A. franciscana, deleterious in A. parthenogenetica, Kawecki 1994) or through a loss of genetic 323
diversity (Yourth and Schmid-Hempel 2006). However, given the size of the initial inoculum and the 324
limited timeframe of the experiment, we doubt that such processes occurred. It would be easier for E. 325
artemiae to accumulate beneficial mutations when passaged on A. parthenogenetica. This hypothesis is
326
also supported by previous experimental results, which describe the infectivity of the stock population 327
of E. artemiae as resembling that of the ‘A. f. host’ evolved lines (Lievens et al. 2018). If so, adaptation 328
likely occurred through an accumulation of mutations during passaging on A. parthenogenetica, which 329
are beneficial in that host and neutral in A. franciscana. Another possibility is that beneficial mutations 330
occurred in all passaging treatments, but that adaptation to A. parthenogenetica had an incidental 331
positive effect in A. franciscana that matched the adaptation to the ‘A. f. host’ treatment. 332
E. artemiae’s virulence did not differ among treatments at the end of the serial passaging, and we found
333
no evidence that it evolved over the course of the experiment. In particular, we found no evidence that 334
the high death rates caused by E. artemiae in A. franciscana between P4 and P6 were caused by a higher 335
virulence (Fig. 4). Instead, demographic effects were the likely culprit: A. franciscana does not limit E. 336
artemiae’s peak spore production to a certain maximum (Lievens et al. 2018), so a higher infective dose
337
in this combination might lead to a higher peak transmission rate, which would increase the infective 338
dose and so on, until the number of invading spores was so high that recipient hosts were overwhelmed 339
(e.g. Ebert et al. 2000). 340
Trade-offs in infectivity and spore production
341
An important advantage of this study is that A. rigaudi and E. artemiae share the same context: the two 342
parasites are ecologically similar, sympatric, and infect the same host species, so we can reasonably 343
expect that they are subject to similar life history and environmental constraints. Below, we take 344
advantage of this to compare the evolved changes in infectivity and spore production for the two 345
microsporidians, arriving at the compelling conclusion that the strength of their life history trade-offs is 346
trait-dependent, but that the traits respond similarly in the two species. 347
The observed changes in infectivity can be explained by the existence of a weak trade-off between 348
infectivity in A. franciscana and A. parthenogenetica. Consider first E. artemiae, whose ability to infect A. 349
parthenogenetica improved when passaged on that host, without attendant losses in A. franciscana.
350
Such cost-free adaptation could arise if the ancestral ‘A. franciscana-adapted’ infectivity of E. artemiae 351
was located slightly below the boundary of a weak trade-off curve (such as would be expected if the 352
ancestral population was not perfectly adapted to the conditions of the experiment, Fry 2003). There 353
would then be little improvement possible in E. artemiae’s fitness on A. franciscana, but a substantial 354
improvement in A. parthenogenetica could easily be achieved (blue arrow in Fig. 6)(Martin and 355
Lenormand 2015), as seen when E. artemiae was passaged on this host (Fig. 4). The infectivity of A. 356
rigaudi can be interpreted in the same context. A. rigaudi’s ancestral infectivity is largely generalist
357
(Lievens et al. 2018), so that the potential improvements in fitness would be small in either direction, 358
thus producing the unchanged infectivity that we observed across treatments (Fig. 4). 359
The weak trade-off model implies that the evolution of generalist infectivity should be straightforward, 360
begging the question of why E. artemiae’s ancestral population remained specialized for this trait. We 361
speculate that the specialization of the ancestral E. artemiae population is maintained by source-sink 362
dynamics in the natural host-parasite community. In the field, E. artemiae is present year-round, while 363
A. parthenogenetica are only present from late spring to fall, so its population predominantly infects,
364
and evolves on, A. franciscana (Lievens et al. 2019). In this case, adaptations towards increased 365
infectivity in the mismatched host may be continually eroded by selection in the matched host (Holt and 366
Hochberg 2002, Lenormand 2002). By forcing E. artemiae to evolve on A. parthenogenetica, we blocked 367
these source-sink dynamics, allowing generalist infectivity to evolve. In comparison, A. rigaudi almost 368
exclusively occur in communities containing both host species (Lievens et al. 2019), potentially 369
explaining why this microsporidian had already evolved generalist infectivity. 370
The second important trait for A. rigaudi and E. artemiae was spore production, which remained 371
strongly specialized in all treatments (Fig. 4). This result could be explained by the existence of a strong 372
trade-off in spore production between the hosts. Such a trade-off would allow small improvements in 373
the direction of increased specialization (black arrows in Fig. 6), but make improvements on the novel 374
host much more difficult to achieve (red arrows in Fig. 6); it would also prevent the emergence of a 375
generalist phenotype. Mechanistically, such a strong trade-off could be related to the distinct strategies 376
of host exploitation necessary to thrive in A. franciscana and A. parthenogenetica. The precise 377
physiology of the host species is likely to be different (they have been diverging for an estimated 40 378
million years, Baxevanis et al. 2006), and indeed the mechanisms of virulence and within-host regulation 379
employed by A. rigaudi and E. artemiae in their matched hosts differ (Lievens et al. 2018, Lievens et al. 380
unpublished data), with A. rigaudi causing more survival virulence, and E. artemiae more reproductive 381
virulence. Successful exploitation of A. franciscana and A. parthenogenetica could therefore require very 382
different toolkits, preventing the evolution of generalism and reducing the likelihood of a host switch 383
(cf. Gemmill et al. 2000).
384
Taken together, our results provide strong evidence that the microsporidians’ traits are constrained by 385
different trade-off shapes. Intriguingly, while the trade-offs are trait-specific, they are not species-386
specific. It seems that while A. franciscana and A. parthenogenetica are not physiologically similar 387
enough to allow the evolution of generalism, A. rigaudi and E. artemiae are ecologically similar enough 388
to share the same constraints. 389
Perspectives
390
Overall, we find that the natural semi-specialization of A. rigaudi and E. artemiae is primarily shaped by 391
a strong trade-off acting on spore production. Spore production is therefore a key trait blocking the 392
evolution of generalism. However, host availability did affect the degree of specialization, by allowing 393
the evolution of generalist infectivity. We therefore predict that the natural population of E. artemiae 394
may eventually evolve to become less specific, as A. rigaudi is, but that neither parasite is likely to 395
become a true generalist or to switch hosts. 396
It is worth noting that our conclusions would have been very different if we had not measured the 397
parasites’ traits separately. Based on the overall fitness (Fig. 5), we would have concluded that A. rigaudi 398
was unable to adapt to its mismatched host, while E. artemiae was able to evolve towards generalism 399
after exposure to A. parthenogenetica. This would have suggested that the two parasites had 400
asymmetrical fitness trade-offs between hosts: a strong trade-off for A. rigaudi, and a weaker trade-off 401
for E. artemiae. Ignoring the individual traits, therefore, can have important consequences for the 402
interpretation of field patterns, and for the prediction of a parasite’s future evolution. Our results 403
suggest that more theoretical studies of specialization should be set in a multi-trait context, with each 404
trait able to exhibit weak or strong trade-offs and evolve accordingly. Such studies would be better 405
equipped to describe the continuum between generalist and specialist strategies, and to single out the 406
traits favoring their evolution. 407
A
CKNOWLEDGEMENTS 408We thank C. Gilliot for her help establishing the stock populations, and C. Gilliot and T. Mathieu for their 409
help designing the experimental equipment. We are also grateful to R. Zahab for her assistance with 410
PCRs, and to R. Zahab, L. Olazcuaga, and J. Pantel for helping out in times of need. E. J. P. L. received 411
financial support from a French Ministry of Research fellowship. TL and YM acknowledge support from 412
CNRS and IRD. 413
R
EFERENCES 414Agrawal, A. A. 2000. Host-range evolution: Adaptation and trade-offs in fitness of mites on alternative 415
hosts. Ecology 81:500–508. 416
Alizon, S., A. Hurford, N. Mideo, and M. Van Baalen. 2009. Virulence evolution and the trade-off 417
hypothesis: history, current state of affairs and the future. Journal of Evolutionary Biology 22:245– 418
59. 419
Amat, F., F. Hontoria, O. Ruiz, A. J. Green, M. I. Sánchez, J. Figuerola, and F. Hortas. 2005. The American 420
brine shrimp as an exotic invasive species in the western Mediterranean. Biological Invasions 7:37– 421
47. 422
Antonovics, J., M. Hood, and J. Partain. 2002. The ecology and genetics of a host shift: Microbotryum as 423
a model system. The American Naturalist 160:S40–S53. 424
Bates, D., M. Maechler, B. Bolker, and S. Walker. 2015. Fitting Linear Mixed-Effects Models Using lme4. 425
Journal of Statistical Software 67:1–48. 426
Baxevanis, A. D., I. Kappas, and T. J. Abatzopoulos. 2006. Molecular phylogenetics and asexuality in the 427
brine shrimp Artemia. Molecular Phylogenetics and Evolution 40:724–738. 428
Bedhomme, S., G. Lafforgue, and S. F. Elena. 2012. Multihost experimental evolution of a plant RNA 429
virus reveals local adaptation and host-specific mutations. Molecular Biology and Evolution 430
29:1481–1492. 431
Bell, G., and X. Reboud. 1997. Experimental evolution in Chlamydomonas II. Genetic variation in strongly 432
contrasted environments. Heredity 78:1–11. 433
Benmayor, R., D. J. Hodgson, G. G. Perron, and A. Buckling. 2009. Host Mixing and Disease Emergence. 434
Current Biology 19:764–767. 435
Bruns, E., M. L. Carson, and G. May. 2014. The jack of all trades is master of none: A pathogen’s ability to 436
infect a greater number of host genotypes comes at a cost of delayed reproduction. Evolution 437
68:2453–2466. 438
Ching, J., S. A. Musheyev, D. Chowdhury, J. A. Kim, Y. Choi, and J. J. Dennehy. 2013. Migration enhances 439
adaptation in bacteriophage populations evolving in ecological sinks. Evolution 67:10–17. 440
Cleaveland, S., M. K. Laurenson, and L. H. Taylor. 2001. Diseases of humans and their domestic 441
mammals: pathogen characteristics, host range and the risk of emergence. Philosophical 442
Transactions of the Royal Society B: Biological Sciences 356:991–9. 443
Ebert, D., C. D. Zschokke-Rohringer, and H. J. Carius. 2000. Dose effects and density-dependent 444
regulation of two microparasites of Daphnia magna. Oecologia 122:200–209. 445
Falconer, D. S. 1990. Selection in different environments: effects on environmental sensitivity (reaction 446
norm) and on mean performance. Genetical Research 56:57. 447
Fellous, S., G. Angot, M. Orsucci, A. Migeon, P. Auger, I. Olivieri, and M. Navajas. 2014. Combining 448
experimental evolution and field population assays to study the evolution of host range breadth. 449
Journal of Evolutionary Biology 27:911–919. 450
Fry, J. D. 1996. The evolution of host specialization: are trade-offs overrated? The American Naturalist 451
148:S84–S107. 452
Fry, J. D. 2003. Detecting ecological trade-offs using selection experiments. Ecology 84:1672–1678. 453
Futuyma, D. J., and G. Moreno. 1988. The Evolution of Ecological Specialization. Annual Review of 454
Ecology and Systematics 19:207–233. 455
Gallet, R., Y. Latour, B. S. Hughes, and T. Lenormand. 2014. The dynamics of niche evolution upon abrupt 456
environmental change. Evolution 68:1257–1269. 457
Gemmill, A. W., M. E. Viney, and A. F. Read. 2000. The evolutionary ecology of host-specificity: 458
experimental studies with Strongyloides ratti. Parasitology 120:429–437. 459
Hall, S. R., C. R. Becker, J. L. Simonis, M. A. Duffy, A. J. Tessier, and C. E. Cáceres. 2009. Friendly 460
competition: evidence for a dilution effect among competitors in a planktonic host-parasite 461
system. Ecology 90:791–801. 462
Hereford, J. 2009. A quantitative survey of local adaptation and fitness trade-offs. The American 463
Naturalist 173:579–88. 464
Holt, R. D., and M. S. Gaines. 1992. Analysis of adaptation in heterogeneous landscapes: implications for 465
the evolution of fundamental niches. Evolutionary Ecology 6:433–447. 466
Holt, R. D., and M. E. Hochberg. 2002. Virulence on the edge: a source-sink perspective. Pages 104–119 467
in U. Dieckmann, J. A. J. Metz, M. W. Sabelis, and K. Sigmund, editors. Adaptive dynamics of
468
infectious diseases: in pursuit of virulence management. Cambridge University Press, Cambridge, 469
UK. 470
Hothorn, T., F. Bretz, and P. Westfall. 2008. Simultaneous Inference in General Parametric Models. 471
Biometrical Journal 50:346–363. 472
Jaenike, J., and I. Dombeck. 1998. General-purpose genotypes for host species utilization in a nematode 473
parasite of Drosophila. Evolution 52:832–840. 474
Kassen, R. 2002. The experimental evolution of specialists, generalists, and the maintenance of diversity. 475
Journal of Evolutionary Biology 15:173–190. 476
Kawecki, T. J. 1994. Accumulation of deleterious mutations and the evolutionary cost of being a 477
generalist. The American Naturalist 144:833–838. 478
Kelly, D. W., R. A. Paterson, C. R. Townsend, R. Poulin, and D. M. Tompkins. 2009. Parasite spillback: A 479
neglected concept in invasion ecology? Ecology 90:2047–2056. 480
Legros, M., and J. C. Koella. 2010. Experimental evolution of specialization by a microsporidian parasite. 481
BMC Evolutionary Biology 10:159. 482
Lenormand, T. 2002. Gene flow and the limits to natural selection. Trends in Ecology and Evolution 483
17:183–189. 484
Lenormand, T., N. Harmand, and R. Gallet. 2018. Cost of resistance: an unreasonably expensive concept. 485
Rethinking Ecology 3:51–70. 486
Lievens, E. J. P., J. M. A. Perreau, P. Agnew, Y. Michalakis, and T. Lenormand. 2018. Decomposing 487
parasite fitness reveals the basis of specialization in a two-host, two-parasite system. Evolution 488
Letters 2:390–405. 489
Lievens, E. J. P., N. O. Rode, J. Landes, A. Segard, R. Jabbour-Zahab, Y. Michalakis, and T. Lenormand. 490
2019. Long-term prevalence data reveals spillover dynamics in a host (Artemia), multi-491
parasite (Microsporidia) community. International Journal for Parasitology. 492
Magalhães, S., E. Blanchet, M. Egas, and I. Olivieri. 2009. Are adaptation costs necessary to build up a 493
local adaptation pattern? BMC Evolutionary Biology 9:182. 494
Magalhães, S., A. Cailleau, E. Blanchet, and I. Olivieri. 2014. Do mites evolving in alternating host plants 495
adapt to host switch? Journal of Evolutionary Biology 27:1956–1964. 496
Martin, G., and T. Lenormand. 2015. The fitness effect of mutations across environments: Fisher’s 497
geometrical model with multiple optima. Evolution 69:1433–1447. 498
Messina, F. J., and S. L. Durham. 2015. Loss of adaptation following reversion suggests trade-offs in host 499
use by a seed beetle. Journal of Evolutionary Biology 28:1882–1891. 500
Nidelet, T., and O. Kaltz. 2007. Direct and correlated responses to selection in a host-parasite system: 501
testing for the emergence of genotype specificity. Evolution 61:1803–1811. 502
Poullain, V., S. Gandon, M. A. Brockhurst, A. Buckling, and M. E. Hochberg. 2008. The evolution of 503
specificity in evolving and coevolving antagonistic interactions between a bacteria and its phage. 504
Evolution 62:1–11. 505
Prenter, J., C. MacNeil, J. T. A. Dick, and A. M. Dunn. 2004. Roles of parasites in animal invasions. Trends 506
in Ecology and Evolution 19:385–390. 507
R Core Team. 2014. R: A language and environment for statistical computing. R Foundation for Statistical 508
Computing, Vienna, Austria. 509
Ravigne, V., U. Dieckmann, and I. Olivieri. 2009. Live where you thrive: joint evolution of habitat choice 510
and local adaptation facilitates specialization and promotes diversity. The American Naturalist 511
174:E141–E169. 512
Reeve, M. R. 1963. The filter-feeding of Artemia I. In pure cultures of plant cells. The Journal of 513
Experimental Biology 40:195–205. 514
Refardt, D., and D. Ebert. 2006. Quantitative PCR to detect, discriminate and quantify intracellular 515
parasites in their host: an example from three microsporidians in Daphnia. Parasitology 133:11–8. 516
Remold, S. 2012. Understanding specialism when the Jack of all trades can be the master of all. 517
Proceedings of the Royal Society of London, Series B 279:4861–9. 518
Rode, N. O., J. Landes, E. J. P. Lievens, E. Flaven, A. Segard, R. Jabbour-Zahab, Y. Michalakis, P. Agnew, C. 519
P. Vivarès, and T. Lenormand. 2013a. Cytological, molecular and life cycle characterization of 520
Anostracospora rigaudi n. g., n. sp. and Enterocytospora artemiae n. g., n. sp., two new
521
microsporidian parasites infecting gut tissues of the brine shrimp Artemia. Parasitology 140:1168– 522
85. 523
Rode, N. O., E. J. P. Lievens, A. Segard, E. Flaven, R. Jabbour-Zahab, and T. Lenormand. 2013b. Cryptic 524
microsporidian parasites differentially affect invasive and native Artemia spp. International Journal 525
for Parasitology 43:795–803. 526
Ronce, O., and M. Kirkpatrick. 2001. When sources become sinks: migrational meltdown in 527
heterogeneous habitats. Evolution 55:1520–1531. 528
Schmid-Hempel, P. 2011. Evolutionary parasitology: the integrated study of infections, immunology, and 529
genetics. Oxford University Press, Oxford, UK. 530
Smith, J. E. 2009. The ecology and evolution of microsporidian parasites. Parasitology 136:1901–1914. 531
Streicker, D. G., A. Fenton, and A. B. Pedersen. 2013. Differential sources of host species heterogeneity 532
influence the transmission and control of multihost parasites. Ecology Letters 16:975–984. 533
Therneau, T. M. 2014. A Package for Survival Analysis in S. 534
Turner, P. E., and S. F. Elena. 2000. Cost of host radiation in an RNA virus. Genetics 156:1465–1470. 535
Woolhouse, M. E. J., L. H. Taylor, and D. T. Haydon. 2001. Population Biology of Multihost Pathogens. 536
Science 292:1109–1112. 537
Yourth, C. P., and P. Schmid-Hempel. 2006. Serial passage of the parasite Crithidia bombi within a colony 538
of its host, Bombus terrestris, reduces success in unrelated hosts. Proceedings of the Royal Society 539
of London, Series B 273:655–659. 540
TABLES 542
Table 1. Parasite lines that were lost during the experiment. Underlined are the hosts from which we collected a
543
backup spore sample.
544
Parasite line Lost between
A. rigaudi × ’A. f. host’ – Repl. 2 P6 & P7
A. rigaudi × ’A. f. host’ – Repl. 3 P4 & P6
A. rigaudi × ’Alternating hosts’ – Repl. 4 P1 & P4
E. artemiae × ’A. p. host’ – Repl. 3 P6 & P7
545
Table 2. Parasite lines that had exceptionally high mortality during one or more transmission events (≤ 5 new hosts
546
survived). To prevent the loss of these lines, we added five extra new hosts to the group at the beginning of the
547
incubation period. If all new hosts died, the transmission step was repeated for that line. Underlined are the hosts
548
from which we collected a backup spore sample.
549
Parasite line Passage Details
A. rigaudi × ’A. f. host’ – Repl. 1 P6 → P7 ≤ 5 P7 hosts survived; 5 hosts added
A. rigaudi × ’A. f. host’ – Repl. 2 P5 → P6
P6 → P7
≤ 5 P6 hosts survived; 5 hosts added ≤ 5 P7 hosts survived; 5 hosts added
A. rigaudi × ’A. f. host’ – Repl. 3 P6 → P7 ≤ 5 P7 hosts survived; 5 hosts added
E. artemiae × ’A. f. host’ – Repl. 1 P5 → P6
P6 → P7
≤ 5 P6 hosts survived; 5 hosts added ≤ 5 P7 hosts survived; 5 hosts added
E. artemiae × ’A. f. host’ – Repl. 2 P4 → P5
P6 → P7
0 P5 hosts survived; transmission repeated ≤ 5 P7 hosts survived; 5 hosts added
E. artemiae × ’A. f. host’ – Repl. 4 P4 → P5
P5 → P6 P5 → P7
≤ 5 P5 hosts survived; 5 hosts added
0 P6 hosts survived (three repetitions); eventually skipped ≤ 5 P7 hosts survived; 5 hosts added
Table 3. Evolved lines used for the final assays. Abbreviations: Y, yes; N, no.
551
Parasite species/Treatment Replicate Used? Notes
A. rigaudi × ’A. f. host’ 1 Y
2 revived Y Lost, but revived from P6 backup sample.
3 N Lost.
4 Y
A. rigaudi × ’Alternating hosts’ 1 Y
2 Y
3 Y
4 N Lost.
A. rigaudi × ’A. p. host’ 1 Y
2 Y
3 Y
4 Y
E. artemiae × ’A. f. host’ 1 + 1 revived Y Revived from P6 to compare virulence.
2 + 2 revived Y Revived from P6 to compare virulence.
3 + 3 revived Y Revived from P6 to compare virulence.
4 + 4 revived Y Revived from P5 to compare virulence.
E. artemiae × ’Alternating hosts’ 1 Y Attempted revival from P6 was unsuccessful.
2 + 2 revived Y Revived from P6 to compare virulence.
3 Y
4 Y
E. artemiae × ’A. p. host’ 1 Y
2 Y
3 N Lost, attempted revival from P6 was unsuccessful.
4 Y
552
Table 4. Detection of infection in the second assay. Only hosts that died after day 10 are included here, to allow for
553
the delay in detection time (see Supplementary Methods).
554
Parasite species Infected hosts
A. rigaudi A. franciscana 66 % A. parthenogenetica 70 % E. artemiae A. franciscana 68 % A. parthenogenetica 34 % 555 556
F
IGURES 557Figure 1. Experimental evolution protocol. Serial passages: [1] Passage 1 (P1): a group of 40 uninfected hosts was
558
exposed to a saturating dose of stock A. rigaudi or E. artemiae spores, and [2] the infections were allowed to
559
incubate. [3] Passaging (P1 P2): the infection was transmitted naturally, by placing the surviving P1 hosts in a
560
strainer above a new group of uninfected hosts. [4] The incubation and passaging steps were repeated for P2-P10.
561
[5] After passaging, the surviving old hosts were counted (P1-P10) and used to estimate the population size of the
562
parasite (P1, P4, P7), produce backup spore samples (P6), or produce the spores for the final assays (P10). Final
563
assays: [1st] An uninfected host was exposed to a low dose of evolved A. rigaudi or E. artemiae spores, and
PCR-564
tested for the presence of the microsporidian after a short incubation period. [2nd] An uninfected host was
565
exposed to a saturating dose of evolved A. rigaudi or E. artemiae spores, and mortality and spore production were
566
tracked for 90 days.
567
568 569
Figure 2. Host survival during the serial passage experiment (a compound of background host mortality and
570
parasite-induced mortality). Colors denote the parasite treatment (blue, A. rigaudi; red, E. artemiae); symbols
571
denote the passaging treatment (triangles, ‘A. f. host’; crosses, ‘Alternating hosts’; circles, ‘A. p. host’); vertical bars
572
represent the 95% CIs.
573
574
Figure 3. Parasite population size, as estimated for each passaging line (ln scale). Colors denote the parasite
575
treatment (blue, A. rigaudi; red, E. artemiae); symbols denote the passaging treatment (triangles, ‘A. f. host’;
576
crosses, ‘Alternating hosts’; circles, ‘A. p. host’); vertical bars represent the 95% CIs. Lost lines (lines with an
577
estimated population size of 0) are not included in the figure.
578
579 580
Figure 4. Infectivity, virulence, and spore production during the final assays. Infectivity is the percentage of hosts
581
infected during the first assay. Virulence and spore production were measured in the second assay: virulence is the
582
acceleration factor (the ratio of time-until-death) compared to the unexposed controls of the same species, spore
583
production is the number of spores produced per (surviving) infected host at the time of passaging (ln scale).
584
Vertical bars represent the 95% CIs. Annotations in gray represent significant differences: asterisks above the
585
dashed lines indicate significant Assay host : Treatment interactions, grouped differences represent significant
586
Assay host differences.
587
588 589
Figure 5. Fitness during the final assays (projected number of infections at passaging, ln + 1 scale). Vertical bars
590
represent the 95% CIs. Annotations in gray represent significant differences: asterisks above the dashed lines
591
indicate significant Assay host : Treatment interactions, grouped differences represent significant Assay host
592
differences.
593
594
Figure 6. We speculate that the observed patterns of specialization in infectivity and spore production are
595
determined by weak and strong trade-offs in performance between A. franciscana and A. parthenogenetica (see
596
text for more information). Symbols: A. rigaudi, circle; E. artemiae; triangle. Black arrows, small changes are
597
possible; blue arrow, a large change is possible; red arrows, changes in the direction of selection are not possible
598
unless preceded by reverse specialization.
599


![Figure 1. Experimental evolution protocol. Serial passages: [1] Passage 1 (P1): a group of 40 uninfected hosts was 558](https://thumb-eu.123doks.com/thumbv2/123doknet/13617063.425236/23.918.72.627.447.847/figure-experimental-evolution-protocol-serial-passages-passage-uninfected.webp)