ISCI, Volume17
Supplemental Information
Strigolactones Play an Important Role
in Shaping Exodermal Morphology
via a KAI2-Dependent Pathway
Guowei Liu, Marina Stirnemann, Christian Gübeli, Susanne Egloff, Pierre-Emmanuel Courty, Sylvain Aubry, Michiel Vandenbussche, Patrice Morel, Didier Reinhardt, Enrico Martinoia, and Lorenzo Borghi
Supplemental figures and legends
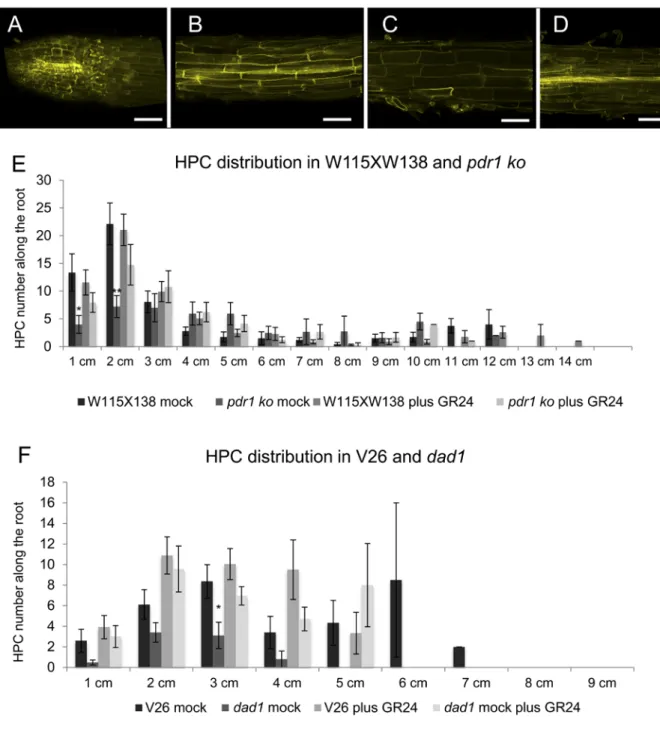
Figure S1. Related to Figure 1. Fluorol yellow staining of petunia roots and HPC distribution along the main root in dad1, pdr1 and relative WT backgrounds.
(A-D) Fluorol yellow staining in root tips (a), hypodermis (b), cortex (c) and stele (d). (E) HPC distribution in WT and pdr1 roots, mock or 10 µM GR24 treated.
(F) HPC distribution in WT and dad1 roots, mock or 10 µM GR24 treated.
Stars above the bars indicate statistically significant difference (T-TEST, * P ≤ 0.05, ** P ≤ 0.01). Error bars are ±SEM. Scale bars = 50 µm
Figure S2. Related to Figures 1 and 2. ‰ HPC / total number of hypodermal cells (thc), root lengths and cell lengths.
(A) ‰ HPC/thc in V26 (WT) and dad1 roots.
(B) ‰ HPC/thc in W115xW138 (WT) and pdr1 ko roots. (C) ‰ HPC/thc in V26 (WT) and dad2 roots.
(D) ‰ HPC/thc in W115 (WT) and 35S:IaaL roots. (E) ‰ HPC/thc in W138 (WT) and kai2a roots. (F) Main root lengths in cm.
(G) HPC cell lengths in µm.
Figure S3. Related to Figures 3 and 4. Effects of hormones on HPCs and isolation of max2a lines.
(A) PDR1 and DAD1 gene expression levels in W115xW138 plus GR24 or ABA (B) PDR1 and DAD1 gene expression levels in V26 plus GR24 or ABA
(C) Effects of low levels of karrikin and auxin on HPC density.
(D) Phenotyping of max2a plants compared to their WT background. max2a mutant plants are bushy (yellow arrows = lateral branches) and dwarf
(E) Graphic representation of the insertion positions in MAX2A
(F) Mycorrhization rates (%) 6 weeks after inoculation (w.a.i.) in WT and kai2a plants.
(G) DAD1 expression levels relative to GAPDH after mock, KAR1 and KAR2 1 µM or 100 nM treatments.
Different letters above the bars indicate statistically significant difference (P < 0.05, by one way ANOVA, n ≥ 30). Stars above the bars indicate statistically significant difference (Student’s T-test p-value < 0.05 = *; ≤ 0.01 = **; <0.0005 = ***). Error bars are ±SEM.
Figure S4. Related to Figures 3 and 4. Isolation of kai2a lines.
(A) Phylogenetic analyses (phylogeny.fr, maximum likelihood, bootstraps n = 100) of 6 Petunia
hybrida sequences homologue to Arabidopsis KAI2 (AtKAI2) and Arabidopsis DWARF14-LIKE2
(AtDLK2).
(B) Quantitative PCR analysis of PhKAI2a-e in leaves and roots. (C) Leaf blade widths in WT and kai2a plants.
(D) Plant phenotypes of independent, 6 weeks old kai2a lines compared to W138 (WT). (E) Graphic representation of the insertion positions in KAI2a.
Stars above the bars indicate statistically significant difference (Student’s T-test p-value < 0.0005 = ***). Error bars are ±SEM.
Transparent methods
Cloning of DAD1-OE
Total RNA from mycorrhizal Petunia roots was isolated using the RNeasy Plant Mini kit (Qiagen). RNA extracts were DNase treated with the DNA-freeTM Kit, DNase Treatment and Removal Reagents (AMBION® by Life Technologies). Total RNA was quantified and purity was estimated using the Nanodrop (ND-1000, Witec). Full-length doubled-stranded cDNAs were obtained using the SMART–PCR cDNA Synthesis Kit (Clontech). PCR amplification of the full-length cDNA, from the start to the stop codon, with primers designed using the nucleotide sequences was performed on a T3 thermocycler (Biometra) using the Advantage 2 Polymerase Mix (Clontech). Amplified products were cloned in the pJet1.2 vector (Thermo Fisher Scientific) and sequenced (Microsynth) by cDNA walking. PCR amplicons generated with the KAPA HiFi HotStart (Roche) were cloned into pDONR221 generating pENTR_DAD1 clones and, subsequently, cloned together with the constitutive Arabidopsis Ubiquitin10 promoter (PUbq10) in pDONRP4P1R and the OCS terminator (the 3′ sequences of the octopine synthase gene, including polyadenylation and presumptive transcription termination sequences) in pDONRP2RP3 into pKGW-MGW using the multiple Gateway cloning kit (Invitrogen). The pENTR clones were made by carrying out a BP-Reaction II overnight. DH5α competent cells (Invitrogen) were transformed by heat shock with 5 μl of the BP Reaction II mixture (Invitrogen). Cells were selected on LB medium with kanamycin (50 mg/ml). pENTR of positive colonies was extracted and used to perform a multiple Gateway LR cloning reaction (Invitrogen). DH5α competent cells (Invitrogen) were transformed by heat shock with 5 μl of the LR reaction mixture. Cells were selected on LB medium with spectinomycin (100 mg/ml). Colonies were
checked by PCR for the presence of the correct inserts. Expression vector of positive colonies were grown overnight in LB medium with spectinomycin (100 mg/ml) and sequences were verified by sequencing. The final expression vector was transferred to A. tumefaciens GV3101 through electroporation (Biorad). Positive colonies were selected after two days of growth on LB medium with spectinomycin (100 mg/ml) and tetracycline (12.5 mg/ml) overnight at 30°C.
Seedlings growth and hormonal treatments for investigation on hypodermal passage cell
Petunia hybrida lines used with W115 (Mitchell cultivar) background: W115 wild type, 35S::IAAL
(Romano et al., 1991); DAD1-OE; with W115XW138 background: W115XW138 wild type, pdr1,
max2a; with V26 background: V26 wild type, dad1, dad2; with W138 background: W138 wild
type, kai2. All seeds were germinated on plates that contain 2.2 g/L MS medium (half strength Murashige and Skoog medium, Duchefa, The Netherlands) and 0.85% (w/v) Phyto Agar (Duchefa, The Netherlands) without sucrose at 21 °C, long day conditions (16 hours light / 8 hours darkness). Seedlings showing the same stage of development were transferred after 7 days to new plates for different hormonal treatments: mock, 10 µM rac-GR24 (Chiralix, The Netherlands), 100 nM to 1 µM GR245DS or GR24ent5DS (Olchemin, Czech Republic), 1 µM ABA (Sigma-Aldrich, Switzerland), 100 nM and 1µM 1-naphthaleneacetic acid (NAA) (Sigma-Aldrich, Switzerland), 100 nM and1 µM Karrikin1 (Olchemin, Czech Republic), 10 nM, 100 nM and 1 µM Karrikin2 (Olchemin, Czech Republic), 1 µM ethephon (Sigma-Aldrich, Switzerland) or 5 µM ACC (1-aminocyclopropane-1-carboxylic acid, ethylene precursor) (Sigma-Aldrich, Switzerland), each for 3 weeks.
We experienced some efficiency variability while testing the effects of racemic mixtures of GR24 and its single enantiomers, GR245DS and GR24ent-5DS on HPC abundances. For example, 10 µM
rac-GR24 was sufficient to recover HPC abundances in dad1 mutants, while 1 µM of the single
enantiomer GR245DS could only double the HPC numbers in dad1 and 100 nM had no effects. We hypothesize that different levels of purity of the two compounds, or different from 1:1 expected ratio of the enantiomers in rac-GR24 might be responsible for the different efficiencies of the recovery.
Trypan blue staining of HPCs and mycorrhization quantification
Trypan blue was chosen to stain HPCs instead of fluorol yellow (the method of choice for endodermal cells) because it gives the possibility of easily detecting a dark stained cell surrounded by transparent epidermal and cortex cells (Figure 1A-I). The fluorol yellow would stain instead all cell walls of the hypodermis with the exception of HPC, which are additionally
strongly auto fluorescent as previously reported in Petunia (Figure S1A-D) (Sasse et al., 2015) making it possible to recognize HPCs in single radial sections only and not, as required for this study, along the whole root length, where (longitudinal) sections would anyway not allow to follow the undulated root morphology. Roots of plate-grown plantlets were carefully separated from the gel and directly incubated for 1 min in 5% HCl. The acidified roots were stained for 2.5 h in trypan blue solution (2.5% glacial acetic acid; 47.5% ddH2O; 50% glycerol; 0.6 g/L trypan
blue). Afterwards, 5% acetic acid was used to wash and de-stain the roots overnight. The HPCs were counted under a binocular microscope. All HPCs from whole root (above the fully stained blue root tip) were calculated segment by segment of 1 cm each. The HPCs densities were showed as total HPCs number divided by total root length. The HPC/total number of hypodermal
cells (thc) per thousand (‰) was calculated as the ratio between the total number of HPCs
divided by the estimated total number of thc (the latter was calculated by the ratio of seedling root length / HPC length, this ratio then multiplied by 8, which is the average number of hypodermal cells around the stele in the different genotype/treatments). HPC lengths were quantified per genotype/treatment, n=15 per genotype/treatment.
Mycorrhization quantification as reported in (Kretzschmar et al., 2012) with no changes. In short, 5 to 8 biological replicates, 200 to 500 grid-root intersections each, were quantified for either the presence or absence of mycorrhization or specific mycorrhizal structure, i.e. vesicles, intraradical hyphae and arbuscules.
Fluorol yellow staining protocol was applied with no changes as reported in the website of Geldner’s group: wp.unil.ch/geldnerlab/files/2013/07/Fluorol-Yellow-staining.pdf
Petunia transformation
A bacterial suspension (pre-culture) was prepared from a 100 µL frozen glycerol culture in 5 mL of LB medium (10 g/l bacto-tryptone, 5 g/l bacto-yeast extract, 10 g/l NaCl, pH 7.5) supplemented with 50 mg/l kanamycin and 25 mg/l rifampicin and cultured overnight at 28 °C with shaking (250 rpm). Then 200µl of the pre-culture was added to 50 ml of LB medium supplemented with 50 mg/l kanamycin and 25 mg/l rifampicin and cultured for about 6h at 28 °C with shaking (250 rpm). The bacterial suspension with an OD600 = 0.6 was pelleted at 4,000 rpm for 15 min at 4 °C. The supernatant was discarded, and the pellet was re-suspended in 50 mL of half strength liquid MS medium supplemented with 150 µM acetosyringone.
Young Petunia leaves were harvested from growth chamber-grown plants, surface sterilised by soaking in 2 % (w/v) sodium hypochlorite with 0.1 % Tween 20 for 15 min, and subsequently
rinsed three times in sterile water. Young leaf explants were cut through the midrib to obtain 10 x 20 mmm rectangular explants (50-60 pieces) and submerged in the bacterial solution for 10 min. The Petunia explants were blotted dry on sterile filter paper and placed on co-cultivation media for 2 days: 2.2 g/l Murashige and Skoog (MS) medium supplemented with 20 g/l sucrose, 10 g/l glucose, 8 g/l plant agar (Duchefa). The pH was adjusted to 5.7 before autoclaving and 15 mg/l (75µM) acetosyringone is added after autoclaving.
After co-cultivation, in vitro shoot regeneration of the explants was performed on 10 cm diameter Petri dishes containing the shoot-inducing media (pH adjusted to 5.7 before autoclaving), that is a solid regeneration medium based on half strength MS medium (2.2 g/l) supplemented with 20 g/l sucrose, 10 g/l glucose, 8 g/l plant agar (Duchefa). After autoclaving and before pouring, the media was supplemented with MS vitamins, 500 mg/l cefotaxime, 300 mg/1 kanamycin, 2 mg/l 6-benzylaminopurin (BAP) and 0.2 mg/l 1-naphthaleneacetic acid (NAA). The explants were transferred into fresh media every 3 weeks. Once appeared, regenerated shoots were cut from the explant and transferred to a root-inducing MS medium containing half MS medium plus MS vitamins, hormone-free containing 500 mg/1 cefotaxime and 100 mg/1 kanamycin. The shoots were transferred into fresh media every 3 weeks until they were 4 to 8 cm high and produced a well-developed root system. Then, the plants were acclimatized and transferred to growth chamber conditions. Shoot regeneration and root induction were performed in a growth chamber at 24 °C with a 16 h photoperiod of 32 µmol m-2 s-1 illumination.
Free auxin quantification
Hormonal characterization in Petunia samples was a service performed by the Institute of Experimental Botany CAS, Prague (Czech Republic). Samples were freeze-dried, shipped and analyzed as previously reported (Dobrev and Vankova, 2012; Djilianov et al., 2013). Hormonal profiling was quantified on fresh and dry weight.
Quantitative PCR
RNA was extracted from petunia roots using the RNeasy Plant Mini Kit (Qiagen, Switzerland). Reverse transcription to cDNA was performed with M-MLV reverse transcriptase, RNase H minus, point Mutant (Promega, Switzerland) and oligo dT primers (Promega, Switzerland).
PhGAPDH served as housekeeping gene (Kretzschmar et al., 2012; Sasse et al., 2015). The
primer sequences used to quantify PDR1 and MAX1 expression are given in (Kretzschmar et al., 2012; Sasse et al., 2015). For DAD1 expression, the primers used were 5’ -GGC AAA ATT GTG GCA AGT GTA- 3’ and 5’ -ATC TCC CAA CCC TTG CAT CC- 3’. SYBR green PCR Master Mix
(Applied Biosystems) was used for quantitative PCR with a 7500 Fast Real Time PCR system (Applied Biosystem). Three biological replicates were performed for each experiment. For each single replicate, 30-40 seedlings were pooled for RNA extraction. The primers used to quantify gene expression of KAI2a-e follow (forward; reverse): PaKAI2a (TCTCCAAGGTACCTGAACGA;
CTACCGAGTCCATGTCACCT); PaKAI2b (TATGTTGGTCACTCTGTTTCTGCT; CATTCAAGAACCTGGGAGAAGCAC); PaKAI2c (CTTCTCCAAGGTTCATAAATGCAG, GCCACTGAATCCATGTCACC); PaKAI2d (TTTCTGTCCCAAGTTACTGTGCC; CTTTGTTTCCATCTCACTGCCTC); PaKAI2e (GCATTTATGTTGGTCACTCTGTC; CATGTCATTCAGATACCTGGGAG); PaDLK2-like (TTCTCCCAGGTTCATAAATTCGGA; CCTGTACTCCACACGTCATAGTC)
Petunia kai2a and max2a mutant genotyping
Petunia kai2a and max2a mutants were identified by searching a sequence-indexed dTph1 transposon database (Vandenbussche et al., 2008), which has been considerably expanded in recent years. All identified mutant alleles are dTph1 insertions in the coding sequence (Figure S3E, S4E), and are likely to disrupt gene function because the 284bp dTph1 element contains multiple stop codons in all six possible reading frames. Exact insert positions (expressed in base pairs downstream of the ATG start codon with the coding sequence as a reference) were determined by aligning the dTph1 flanking sequences with the genomic and cDNA sequences. All in silico-identified candidate insertions were confirmed by PCR-based genotyping of the progeny from the selected insertion lines, using primers flanking the dTph1 transposon insertions. The following thermal profile was used for segregation analysis PCR: 10 cycles (94°C for 15 s, 68°C for 20 s minus 1°C/cycle, 72°C for 30 s), followed by 40 cycles (94°C for 15 s, 58°C for 20 s, and 72°C for 30 s). The different insertion mutants were further systematically genotyped in subsequent crosses and segregation analyses. PCR products were analyzed by agarose gel electrophoresis. The primers used to identify homozygote plants follow (forward; reverse): KAI2-315 (TTGGACATTCTGTTTCTGCCATG; GAACCAGAGACGGTGACAAG); KAI2-565 (TTCAACATGAGACCAGACATAGC; ATGAGGCAACAAATGTCTTAAATCAC); MAX2A-1177(CAAGTTTGAGGTCCAAGGTTG; GCTCCAAGATTCTTGCAGCA); MAX2A-1344 (TTGATTGTGTGTGGGATAGTG; TGCTTGAAGCTTCACATCCAT); MAX2A-1541 (GGCAATGGATATAGTGGACG; GTCTTCAAGACCTGCAGCTG).
Statistical analyses
Experiments were repeated a minimum of three times (three biological replicates). For each biological replicate, 30-40 seedlings were collected for qPCR analyses; 8-15 roots per line per
treatment were analyzed for HPC numbers. The sample size was chosen accordingly to the equally distributed and stable growth conditions in our greenhouse, as well as to the homogeneity of our already published transgenic lines. In the case kai2 transgenic lines, we quantified morphology and phenotype in 2 independent lines to avoid insertion position effects. No samples were excluded, no criteria were pre-established. The locations of plants in the greenhouse were randomized to avoid any position effect. Blinding was applied in quantifying HPCs. Statistical tests, one-way Anova or Students's T-test (two-sided), are justified as appropriate because of the chosen sample size and the assumed normal distribution of samples, the latter confirmed by the data collected.
Supplemental References
Djilianov, D.L., Dobrev, P.I., Moyankova, D.P., Vankova, R., Georgieva, D.T., Gajdošová, S., and Motyka, V. (2013). Dynamics of Endogenous Phytohormones during Desiccation and Recovery of the
Resurrection Plant Species Haberlea rhodopensis. J Plant Growth Regul 32, 564-574.
Dobrev, P.I., and Vankova, R. (2012). Quantification of Abscisic Acid, Cytokinin, and Auxin Content in Salt-Stressed Plant Tissues. In Plant Salt Tolerance: Methods and Protocols, S. Shabala and T.A. Cuin, eds (Totowa, NJ: Humana Press), pp. 251-261.
Romano, C.P., Hein, M.B., and Klee, H.J. (1991). Inactivation of auxin in tobacco transformed with the indoleacetic acid-lysine synthetase gene of Pseudomonas savastanoi. Genes Dev 5, 438-446. Vandenbussche, M., Janssen, A., Zethof, J., van Orsouw, N., Peters, J., van Eijk, M.J.T., Rijpkema, A.S.,
Schneiders, H., Santhanam, P., de Been, M., van Tunen, A., and Gerats, T. (2008). Generation of a 3D indexed Petunia insertion database for reverse genetics. Plant Journal 54, 1105-1114.