Publisher’s version / Version de l'éditeur:
Journal of Glaciology, 3, 23, pp. 218-222, 1958-05-01
READ THESE TERMS AND CONDITIONS CAREFULLY BEFORE USING THIS WEBSITE.
https://nrc-publications.canada.ca/eng/copyright
Vous avez des questions? Nous pouvons vous aider. Pour communiquer directement avec un auteur, consultez la
première page de la revue dans laquelle son article a été publié afin de trouver ses coordonnées. Si vous n’arrivez pas à les repérer, communiquez avec nous à [email protected].
Questions? Contact the NRC Publications Archive team at
[email protected]. If you wish to email the authors directly, please see the first page of the publication for their contact information.
NRC Publications Archive
Archives des publications du CNRC
This publication could be one of several versions: author’s original, accepted manuscript or the publisher’s version. / La version de cette publication peut être l’une des suivantes : la version prépublication de l’auteur, la version acceptée du manuscrit ou la version de l’éditeur.
Access and use of this website and the material on it are subject to the Terms and Conditions set forth at
Changes in a shallow snow cover subject to a temperate climate
Gold, L. W.
https://publications-cnrc.canada.ca/fra/droits
L’accès à ce site Web et l’utilisation de son contenu sont assujettis aux conditions présentées dans le site LISEZ CES CONDITIONS ATTENTIVEMENT AVANT D’UTILISER CE SITE WEB.
NRC Publications Record / Notice d'Archives des publications de CNRC:
https://nrc-publications.canada.ca/eng/view/object/?id=60685cc0-a4b4-4ad8-b390-e567f0ca6d30 https://publications-cnrc.canada.ca/fra/voir/objet/?id=60685cc0-a4b4-4ad8-b390-e567f0ca6d30Ser
TH1
N21r2
no.
5 5
NATIONAL
RESEARCH
CANADACOUNCIL
c *
2
BLDG
DIVISION OF BUILDING RESEARCH
-
L I B R A R Y
-
CHANGES IN A SHALLOW SNOW COVER SUBJECT TO A
TEMPERATE CLIMATE
BY
L.
W.
GOLD
REPRINTED FROM JOURNAL O F GLACIOLOGY
VOL. 3, NO. 23, MARCH 1958, P.218-222
RESEARCH PAPER NO. 5 5
O F T H E
DIVISION
OF BUlLDING RESEARCH
OTTAWA
MAY
1958
PRICE 1 0 C E N T S
This p u b l i c a t i o n
i s
being d i s t r i b u t e d
by
t h e Division of Building Research of t h e National
Research Council a s a c o n t r i b u t i o n towards b e t t e r
b u i l d i n g i n Canada.
It
should not be reproduced
i n whole o r i n p a r t , without permission of t h e orP-
g i n a l publisher.
The Division would be glad t o
be
of a s s i s t a n c e i n o b t a i n i n g such permission,
Publications of t h e Division of Building:
Research
may be obtained by mailing t h e a p p r o p r i a t e
remittance,
( a Bank, Express, o r Post Office Money
Order o r a cheque made payable a t p a r i n Ottawa,
t o t h e Receiver General of Canada, c r e d i t National
Research council) t o t h e Natior-a1 Research Council,
Ottawa.
Stamps a r e not acceptable,
A
coupon system has been introduced Lo
make payments
f o r p u b l i c a t ions r e l a t i v e l y s h p l e
.
Coupons a r e a v a i l a b l e i n denominations of
5,
25,
and
50
cents,
and
may
be obtained by making
a
r e -
mittance as indicated above,
These coupons
m a y
be
used f o r t h e purchase of
a l l National Research
Council p u b l i c a t i o n s including s p e c i f i c a t i o n s
of
.
>gas
&LJ
zf~.
JOURNAL O F G L A C I O L O G Y
C H A N G E S I N A S H A L L O W S N O W C O V E R S U B J E C T T O
A
T E M P E R A T E C L I M A T E
By L. W. GOLD
(Snow and Ice Section, Division of Building Research, National Research Council, Canada)
ABSTRACT. Observations were carried out on each significant layer of the snow cover a t Ottawa (lat. 450 24' N., long. 7go 43' W.) on the thickncss of the layer, and the density, grain size distribution and degree of bonding of the snow in each layer. A logarithmic dependence on time was found for the layer thickness, and the density and grain size distribution. The product of layer thickness times the corresponding snow density was found to be constant when no melting occurred.
R~suMB. O n a cffectuC des observations sur chaque couche importante d'une couverture de neige B
Ottawa (lat. 45' 24' N, long. 75" 43' 0 ) . O n a enregistre les modifications chronologiques d e 1'Cpaisseur des couches, de la densitt de la neige, de la dimension des cristaux et de leur rkpartition. L'assemblage des cristaux, aprks le passage au tamis, a fait l'ol~jet d'une etude. Dcs relations logarithmiques ont CtC ttablies en fonction d u temps 6coule. O n s'est aperGu que le produit de l'epaisseur d'une couche et de la densite correspondante de la neige est constant lorsque la neige ne fond pas.
DURING February and March of 1956, a number of observations were carried out o n the snow cover a t Ottawa, Canada (lat. 45" 24' N., long. 75" 43' W.). This report records some of the observations that are of interest in understanding how a shallow snow cover is modified by a temperate climate. These observations are :
Height of each snow layer from the ground surface and the thickness of the layer; T h e density of the snow in each layer;
T h e grain-size distribution of the snow in each layer as found by sieving; and The grain type in each layer and the degree of bonding between grains after sieving. Near the observation area the air temperature was recorded in a Stevenson screen. Records were also kept of the precipitation and the sequence of cold a n d warm air masses.
Pits were dug in the snow cover
'
and 1000 cm.3 samples were taken from each layerusing the National Research Council snow sampler for layers greater than 5 cm. thick and a special spade-like sampler for the thinner layers. These samples were placed in waxed card- board containers and immediately removed to a cold room where they were weighed and sieved. Four sieve sizes were used which separated the snow grains into the following size ranges :
o to I .o mm.
I .o to 2 . 0 mm. 2 so to 3 -33 mm.
greater than 3 -33 mm.
'The weight of the snow in each size range was measured and recorded. The snow in each range was then observed with a small hand microscope; the grain type was recorded according to the International Snow Classification and a n estimate made of the degree of bonding which was still recognizable in the grains.
T h e technique for sieving was established at the outset and all sieving was carried out by the same person. I t was recognized that some degree of uncertainty would be introduced depending on how much trouble one took to break u p the snow. T h e technique finally adopted was to work the snow gently in each sieve with a gloved hand until further sieving would allow little more to pass through. I t was assumed that the uncertainty which was implicit in the method would result in a scattering in the results but would not mask a n y significant change in the grain-size distribution. This was later confirmed when the results were plotted.
C H A N G E S I N A S H A L L O W S N O W C O V E R 2'9
OBSERVATIONS AND DISCUSSION
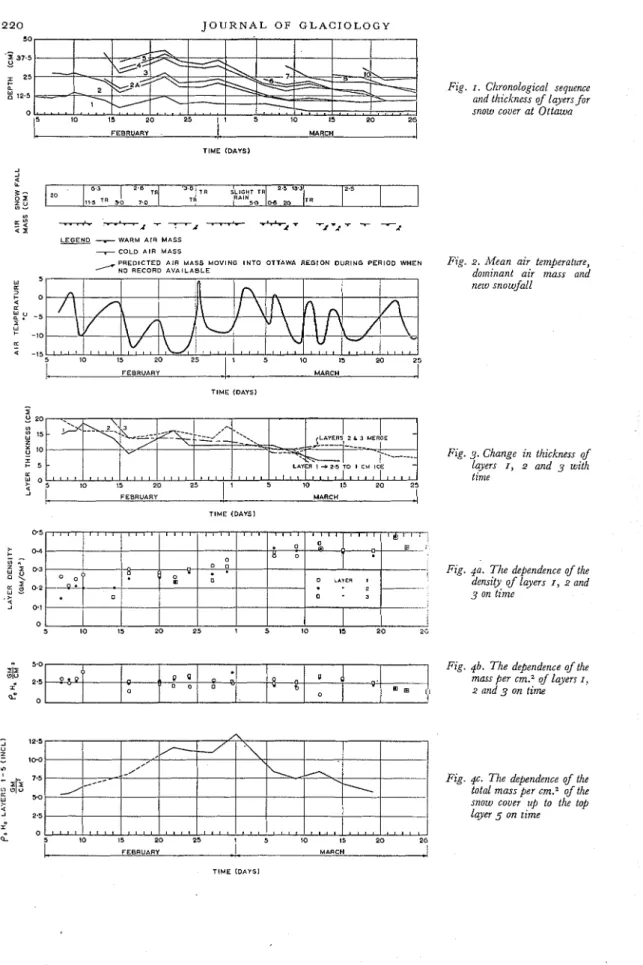
Fig. I (p. 2 2 0 ) shows the observed history of the snow layers, their age, height relative to
the ground, and thickness. Three well-defined layers developed during the first part of February (layers I , 2 and 3) on which measurements could be made well into March. It was possible to make observations on layers 2 and 3 from the time they were first formed, but
layer I was a number of days old before the first observations were made.
Fig. 2 shows the mean air temperature obtained from the temperature measured in the Stevenson screen, the sequence of warm and cold air masses, and the amounts of snowfall. The mean air temperature was obtained by drawing by eye a smooth curve through the continuously recorded air temperature record approximately midway between the daily maximum and minimum.
It is interesting to note the relationship between mean air temperature, the periods of snowfall, and the sequence of warm and cold air masses. These facts, though well known to a meteorologist, are mentioned here because they draw attention to the cycle of events which have a definite influence on the development of the snow cover.
Fig. 3 shows the change in the thickness of layers I , 2 and 3 with time. Fig. 4a is a plot of the density of layers I , 2 and 3 against time. I n Fig. qb the product of the layer thick-
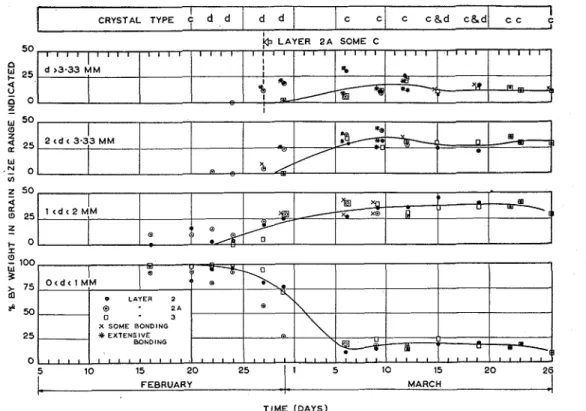
ness times the density is plotted. This should show the gain or loss of material in layers I , 2 and 3 over the period of observations. I n Fig. 4c the sum of the density times the layer thickness for all layers up to and including layer 5 is plotted. This indicates the gain or loss of mass in the snow cover up to the top of layer 5 over the observation period. In Fig. 5 (p. 221) is plotted the grain-size distribution in per cent against time for layers na, 2 and 3. The estimated degree of bonding of the particles after sieving and the observed crystal type are also indicated.
Fig. 5 shows that the change in grain-size distribution was fairly rapid and occurred at approximately the same time for all layers even though the age of the layers differed. I t is also seen that a significant portion of the change occurred during a thaw which took place from
I to
7
March. For three days prior to the thaw the weather was clear and the days sunny. O n24 and 25 February a disturbance occurred which produced some rain and above-freezing temperatures. The evidence thus points to mild weather as the cause for the sudden change in grain-size distribution. After 28 February, the grains in the size ranges greater than I mm.
were mainly type C and showed medium to extensive bonding. Though this is evidence of melting and the change in the grain-size distribution coincides with a definite mild spell, the part of the change which took place between 25 February and I March was during pre-
dominantly cold weather. The importance of temperature gradients in the metamorphism of snow has been pointed out by de Quervain 3 ~ 4 and it is significant that the gradient through
the snow cover from I 5 February to I March was always between o
.
I and o 2" C/cm,From Fig. 3 one could say that a major change in layer thickness, particularly layers I
and 2, occurred during the mild spell. The I -25 to 2 . 5 cm. ice layer into which layer I was
transformed was certainly a result of this period. The change in thickness of layer 3, which was near the air-snow surface, is fairly uniform.
It must be emphasized that it is impossible to draw firm conclusions from data such as those shown in Fig. 3 because of the natural variability which exists in the thickness of a snow layer. For instance, the effect of the wind could easily develop undulations in the surface of the snow which later appear as variations in layer thickness. This is obvious in Fig. I where
variations in layer thicknesses are reflected in the over-all snow depth.
I n Fig. 4a a gradual increase in the density of layers I , 2 and 3 is seen. Again, one could
attribute the jump from a density of approximately 0 . 3 gm.lcm.3 to 0.4 gm.lcm.3 to the mild spell of I to
7
March. One interesting feature is seen in Fig. q b in which the product ofdensity times the layer thickness is shown to be approximately constant over the period of observation. T h e product for layer I drops off after the mild spell of 8 March but it was
2 2 0 J O U R N A L OF G L A C I O L O G Y
L
FEBRUARY 1 MARCH1
T l M E (DAYS1
6 I ' 77,
-
Tx-iT T TiLEGEND -WARM A I R MASS
-
COLD A I R MASS
/ P R E D I C T E D A I R MASS MOVING I N T O OTTAWA R E G I O N DURING PERIOD WHEN NO RECORD A V A I L A B L E LII 3 0 z ;!J - 5 W + - I 0 'L -15 7 10 15 2 0 2 5 / 1 5 10 15 2 0 2p
Fig. I . Chronological sequence
and thickness of layers for snow cover at Ottawa
Fig. 2. itfean air temperature, dominant air mass and nezu snowfall
T l M E (DAYS)
-
I
Fi.?. 3. Change in thickness of layers I , 2 and 3 with time ( 5 10 15 2 0 2 5 10 15 2 0 2 5 J r FEBRUARY MARCH T l M E (DAYS) 0 5 * 0 4 c
-
"7 I I 0 3X p - Ftg. #a. The dependence of the
rr g 0 2
.
-
2 dens10 of layers I , 2 andw.. 3 on time Q J 0 1 0 5 10 15 2 0 2 5 1 5 I 0 15 2 0 2 i Y) -/'
__---
\ Fig. 46. The dependence of the total mars per dm.= of the snow cover Z$J to the top Q2.5
1
iwi on time" 5.0
35 Fig. 46. The dejendence of the
.I
T I M E (DAYS1.
2.5 I e' 0 -2-6 P 0 . . P a " D O o0 :- 8 ; 0 o1 mass per cm.= of layers I ,
- 2 100 W 3 > 75 m $ 5 0 @ 2 A 0 - 3 X SOME BONDING 2 5 0 5 10 15 2 0 25 1 1 5 10 15 2 0 26 FEBRUARY MARCH I c c
!
T l M E (DAYS)Fig. 5 . The dependence of grain-size distribution for layer3 r, r a and 3 on time
LAYER 2A SOME C 5 0 I l l 1 1 1 1 I I I I I I I I 1 1 1 I f 1 1 I l l 1 I I I I I ) I I I I I I 1C 1 %
9
- P
/<
e
*El*-,
W re, 4,B
O I 1 c c a d c a d 5 4-
m 5 $ 3 II) . a > k V) 2 2 W n W4
1 0 5 10 15 20 25 30 35 T l M E (DAYS)Fig. 6 (above). The dependence of the lajer density on time Fig. 7 (right). T h e increme with time in the amount of
snow of grain size greater than r mm.
0 5 10 15 20 25 3 0 3 5
T l M E (DAYS)
c c
CRYSTAL TYPE d d d d
J O U R N A L O F G L A C I O L O G Y
difficult to make observations on this layer at this time because of the presence of free water and later of ice. The product for layers 2 and 3 also drops off when the spring thaw sets in
after the middle of March. I n Fig. qc the sum of the product for all layers shows a decided drop during the mild periods but seems to hold approximately constant during cold periods
(i.e. 6 to 1 2 March). There are some indications in Fig. qb that the total mass in layers I , 2
and 3 may actually increase during a cold spell but the evidence is far from conclusive. The drop during a mild spell is probably due to water from melting snow draining out of the layers.
If the changes in density and grain-size distribution depend primarily on the time for any particular climatic region, Figs. 6 and 7 indicate that this dependence may be logarith- mic. For density the equatiori is of the form p,= poeut where p, is the density of the snow at time t in days.
po and a are constants. A line drawn by eye through the points gives:
The percentage size ranges is given size range of o to I
by weight of snow that is lost from the size range o to I mm. to the larger
by ~ o o - A = A , e p ~ where A is the percentage by weight of snow in grain- mm. a t time t in days. A, and @ are constants. From a line fitted by eye to the data:
Fig. qb, which shows the product of density and layer depth to be approximately constant, indicates that the layer thickness varies inversely as the density. Therefore the layer thickness varies according to an equation of the form: H,=Hoe-ut where a=o.o268/day. The calculated values of a and
@,
if valid, would probably apply only to a climatic region of which the Ottawa area is an example.Appreciation is extended to Mr. R. Armour who made the measurements on which this report is based.
This is a contribution from the Division of Building Research of the National Research Council and is published with the approval of the Director of the Division.
MS. received I I D e c e m b e r 1957
R E F E R E N C E S
I . Hein, G. J., Pearce, D. C., and Gold, L. W . Method of measuring the significant characteristics of a snow
cover. Associate Committee on Soil and Snow Mechanics, National Research Council of Canada, Technical Memoran- dum No. 18, November 1950.
2. International classification for snow (with special reference to snow on the ground). Issued by the Commission on Snow and Ice of the International Association of Hydrology, Associate Committee on Soil and Snow ~bfecechanics, Technical Memorandum No. 3 I , August 1954.
3. de Quervain, M. O n Metamorphism and Hardening of Snow under Constant Pressure and Temperature Gradient. Paper presented at the X I General Assembly of the I.U.G.G., Toronto, September 1957. 4. de Quervain, M. Schnee als Kristallines Aggregat. Experientia, Vol. I , 1945, p. 1-17. (Also published in English
as S.I.P.R.E. Translation No. 2 1 , May 1954.)