HAL Id: hal-00317804
https://hal.archives-ouvertes.fr/hal-00317804
Submitted on 27 Jul 2005
HAL is a multi-disciplinary open access
archive for the deposit and dissemination of
sci-entific research documents, whether they are
pub-lished or not. The documents may come from
teaching and research institutions in France or
abroad, or from public or private research centers.
L’archive ouverte pluridisciplinaire HAL, est
destinée au dépôt et à la diffusion de documents
scientifiques de niveau recherche, publiés ou non,
émanant des établissements d’enseignement et de
recherche français ou étrangers, des laboratoires
publics ou privés.
World first complex optical instrumental observations of
aurora in the Arctic in 1899?1900
S. A. Chernouss, G. V. Starkov, L. S. Yevlashin
To cite this version:
S. A. Chernouss, G. V. Starkov, L. S. Yevlashin. World first complex optical instrumental observations
of aurora in the Arctic in 1899?1900. Annales Geophysicae, European Geosciences Union, 2005, 23
(5), pp.1523-1531. �hal-00317804�
Annales Geophysicae, 23, 1523–1531, 2005 SRef-ID: 1432-0576/ag/2005-23-1523 © European Geosciences Union 2005
Annales
Geophysicae
World first complex optical instrumental observations of aurora in
the Arctic in 1899–1900
S. A. Chernouss, G. V. Starkov, and L. S. Yevlashin
Polar Geophysical Institute of the Kola Science Centre RAS, Apatity, Murmansk Region, Russia
Received: 14 January 2005 – Revised: 14 April 2005 – Accepted: 21 April 2005 – Published: 27 July 2005 Part of Special Issue “Atmospheric studies by optical methods”
Abstract. This report presents data and analysis of visual, photographic and auroral spectral data, obtained by the Rus-sian astronomer J. Sykora from the RusRus-sian-Swedish expe-dition to Spitsbergen during the 1899–1900 winter season, which are historically significant for auroral studies. These data seem to be the first instrumental observations of auro-ral spectra in the Arctic and some of the emissions discov-ered have world priority. The second known photos in the world of aurora from the Arctic and undoubtedly the first ones for geomagnetic latitudes of about 75◦in the Spitsber-gen Archipelago were obtained. The results of the expedi-tion are discussed from a modern point of view and com-pared with our knowledge of the 21st century. A descrip-tion of the equipment and methods that were used by Rus-sian astronomers is presented. Both photographic and spec-tral devices using registration by photographic plates were used, along with special methods of their development and enhancement. Some statistical analysis was done on the ba-sis of the expedition reports and diaries. This analyba-sis shows that by using Sykora’s data it was possible to discover the au-roral oval or instantaneous auau-roral distribution over the polar region. Analysis of photographic samples and sketches of the aurora demonstrate typical auroral form outlines as they are described today. Spectral plates exposed for several hours to auroral lights revealed not only the main auroral emis-sions, which were well-known at that time, but several other unidentified weak emissions, which were rediscovered and interpreted years later.
Keywords. History of geophysics (Atmospheric sciences, instruments and techniques)
1 Introduction
Auroral physics is closely connected both with man’s pene-tration into the Arctic and technological progress in optical imaging and spectroscopy.
Correspondence to: S. A. Chernouss
The discovery of the auroral zone or auroral belt (re-gion of maximum statistical probability of auroral appear-ances within the polar region around the magnetic pole) and the auroral oval (instantaneous probability of aurora occur-rence within the polar region) are usually connected with the names of Hansteen (Sandholt et al., 2002), Muncke, Loomis, and Fritz et al. (Muncke, 1837; Loomis, 1860; Fritz, 1881). All these references are concerned with the au-roral belt. The instantaneous auau-roral oval concept was pre-sented by Khorosheva (1962); Feldstein (1963); and Feld-stein and Starkov (1967). However, there were plenty of observations before these discoveries, which are described and referenced in the reviews of Chamberlain (1961), Aka-sofu (1979), Brekke and Egeland (1979), and Eather (1980). Some of these early data would have permitted the formula-tion of the auroral belt and instantaneous oval concepts. For example, Alfv´en (1967) noted that the auroral oval position could be calculated on the basis of visual observations of the aurora carried out from Spitsbergen.
The history of auroral photography started with the first photos taken by Tromholt (1885) in Christiania, but he never published these photos. The first photos were obtained using an exposure of about 8 min. The first images of aurora from the Arctic were obtained by Martin Brendel from the expedi-tion of Baschin to Bossekop (Finmark) in 1891–1892, which used shorter exposures from 7 s to several minutes. These were the first published auroral photographs (Baschin, 1900; Schroder, 2004). Supposedly Birkeland tried to take auroral photos during the 1899–1900 expedition to Hallde (Brekke and Egeland, 1979) but the authors are unable to find any publications of his photographs. Several years later auroral photography started to be an ordinary instrument in auroral physics.
The pioneer of auroral spectroscopy was the Swedish physicist Angstrom, who performed the first observations of the main auroral emission lines in the green, red and blue re-gions of the spectrum from Uppsala by visual spectroscope (Angstrom, 1869, 1874). His work established that the phys-ical nature of the aurora was connected with atmospheric
1524 S. A. Chernouss et al.: Observations of aurora in the Arctic in 1899–1900
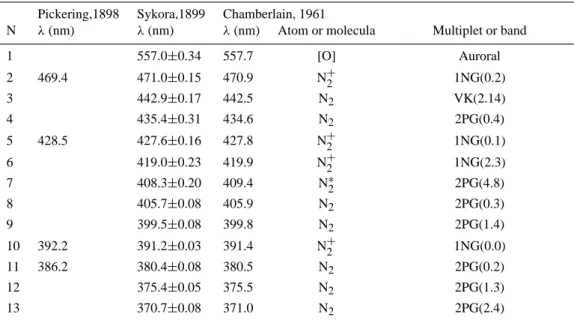
Table 1. Comparison of auroral emissions spectral positions on the basis of spectrographic data.
Pickering,1898 Sykora,1899 Chamberlain, 1961
N λ(nm) λ(nm) λ(nm) Atom or molecula Multiplet or band
1 557.0±0.34 557.7 [O] Auroral 2 469.4 471.0±0.15 470.9 N+2 1NG(0.2) 3 442.9±0.17 442.5 N2 VK(2.14) 4 435.4±0.31 434.6 N2 2PG(0.4) 5 428.5 427.6±0.16 427.8 N+2 1NG(0.1) 6 419.0±0.23 419.9 N+2 1NG(2.3) 7 408.3±0.20 409.4 N∗2 2PG(4.8) 8 405.7±0.08 405.9 N2 2PG(0.3) 9 399.5±0.08 399.8 N2 2PG(1.4) 10 392.2 391.2±0.03 391.4 N+2 1NG(0.0) 11 386.2 380.4±0.08 380.5 N2 2PG(0.2) 12 375.4±0.05 375.5 N2 2PG(1.3) 13 370.7±0.08 371.0 N2 2PG(2.4) 13
Figure 1. Map of Spitsbergen Archipelago with position of the Russian-Swedish expedition base Konstantinovka at Hornsund.
Fig. 1. Map of Spitsbergen Archipelago with position of the Russian-Swedish expedition base Konstantinovka at Hornsund.
gas emissions and not with reflected or diffracted lights, nor glowing macroscopic particles. Priority for the first photo-graphic spectrum of the aurora belongs to the American re-searcher E. C. Pickering, whose assistant E. King obtained spectra during bright auroras from Harvard College observa-tory (Pickering, 1898). He registered several lines in the deep violet region of the spectrum, which are difficult to see with the naked eye. Auroral spectral observations were obtained from relatively low latitudes during strong aurora, whose ap-pearance is rather seldom. We could not find any other pub-lished instrumental spectral observations of the aurora from the Arctic before the 20th century. Unfortunately, the world community of auroral scientists missed the auroral images and spectra which were published (see Fig. 1) by Russian as-tronomers in the French (Sykora, 1901, 1903) and German (Sykora, 1901) languages.
2 Russian-Swedish expedition to Spitsbergen in 1899–
1900
The Russian-Swedish cooperative expedition to Spitsbergen in 1898–1902 was organised primarily for Arc-of-Meridian measurements, to establish the exact shape of the Earth and more precisely, its flattening toward the pole (Wrakberg, 2001). After official scientific approval, this bilateral co-operative project received high level national importance. Members of both the Swedish Royal Family and the Rus-sian Imperial Family engaged in official diplomatic connec-tions. The undertaking was financed by the Swedish and Russian States. The Russian-Swedish measurements were the first bilateral and the most closely co-ordinated scien-tific work ever performed in the Arctic until this time. One scientific task for the Russian team of the expedition was to study the nature of the aurora. The Russian astronomer J. Sykora, from Kharkov University, was involved with the expedition team from Pulkovo Observatory especially for this purpose. The world’s best optical equipment was pur-chased in Germany to provide quality investigations of au-rora. Results from the Russian part of the expedition, con-cerning the auroral observations, were partially reported by Sykora in the Memories of Russian Imperial Academy of Sciences. The expedition was based at Hornsund on the western part of the Spitsbergen Archipelago in the settle-ment of Konstantinovka (geographic latitude ∼76.8◦N, ge-ographic longitude∼15.4◦E; geomagnetic latitude∼73.9◦N, geomagnetic longitude∼112◦E ) (see Figs. 2 and 3). The task of the Russian expedition was to register and describe the aurora, search for regularities in their appearance and map the phenomenon onto astronomical charts. The years 1899–1900 correspond to years of solar activity minimum, according to the 11-year sunspot astronomical cycle.
S. A. Chernouss et al.: Observations of aurora in the Arctic in 1899–1900 1525
14
Figure 2. Photo of the Russian-Swedish expedition base with equipment for auroral observations in the Konstantinovka settlement at Hornsund.
Fig. 2. Photo of the Russian-Swedish expedition base with
equip-ment for auroral observations in the Konstantinovka settleequip-ment at Hornsund.
15
Figure 3. Cover of J. Sykora’s report in the Russian Imperial Academy proceedings. Fig. 3. Cover of J. Sykora’s report in the Russian Imperial Academy
proceedings.
3 Equipment and methods
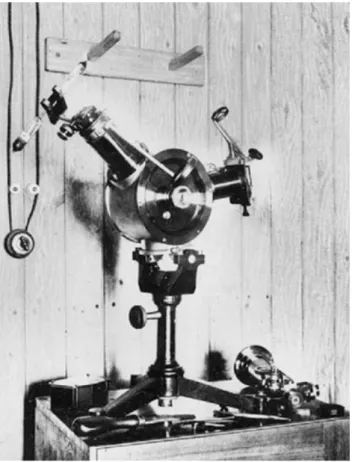
Auroral images and spectra were obtained by a photographic camera equipped with a Planar-Zeiss lens of F=110 mm and D/F=1/3.6. The camera could be mechanically rotated both in zenith and azimuth angles to view the aurora in different positions (Fig. 4). Orthochrome photographic plates were used as the most sensitive material that was available in the 19th century. The exposure used for auroral photography var-ied from 3 to 25 min. More than 70 negatives of the aurora were obtained during October 1899 to February 1900. Opti-cal spectroscopy of the aurora was based on a spectrograph coupled to the camera (Fig. 5). Both camera and collima-tor lenses had F=110 mm and D/F=1/3.6. The spectrograph
16
Figure 4. Auroral photocamera of the Russian expedition to Spitsbergen.
Fig. 4. Auroral photocamera of the Russian expedition to
Spitsber-gen.
used two prisms in a visible region of the spectrum and a slit width of <0.3 mm. Spectral calibration of the device was done periodically during the measurements by Geissler vac-uum tube (Fig. 5) hydrogen emissions of 486.15, 434.07 and 410.18 nm, together with the 406.73 nm emission and solar spectrum emissions of 486.15, 430.8 and 393.38 nm. The spectral resolution deviation was estimated at about 1 nm based on the position of spectral lines obtained by special spectral calibration lamps. Five negatives of auroral spec-tra with an exposure from 4 to 28 h were obtained. Some statistical data from visual auroral observations and drawing sketches, including shape, movement, colour and intensity from more than 1100 events, supported the instrumental ob-servations to obtain a complete picture of the phenomenon.
4 Data and results
4.1 Morphology features of aurora
Visual observations of aurora were carried out by the Rus-sian astronomers J. Sykora and M. Beyer from 17 September 1899 to 27 March 1900. Beyer was responsible for meteo-rological observations and the occurrence of aurora was ob-served each hour by his programme. The observational meth-ods and some results were published by Sykora (1903). In
1526 S. A. Chernouss et al.: Observations of aurora in the Arctic in 1899–1900
17
Figure 5. Auroral spectrograph of the Russian expedition to Spitsbergen.
Fig. 5. Auroral spectrograph of the Russian expedition to
Spitsber-gen.
addition, a journal of observations was enclosed with the pa-per and some diaries and letters of Sykora were made avail-able in the St. Petersburg archive of the Russian Academy of Sciences. Results from the processing of these data are presented below. Sykora noted the position of aurora, their forms, movement of features and angular velocities, together with the exact time of the observations. The author also pro-vided a description of the colours for bright aurora. Many sketches of auroral forms were made (see Fig. 6). About 70 photos of different types of auroras were analysed, too. Sykora used his own scale based on several points to note the auroral intensity range: 1) great aurora; 2) intensive aurora; 3) moderate aurora; 4) weak aurora; 5) subvisual aurora. Be-ing a professional astronomer, Sykora compared the inten-sity of the aurora with sky objects, including the moon in different phases and nightglow, and the stars. Some observa-tions, photos and sketches of aurora clearly demonstrate the variation and movement of auroral forms, which are typical for an auroral substorm (Akasofu, 1968) (see Figs. 6 and 7). Sykora observed and noted all the main auroral forms, such as diffuse and rayed arcs, diffuse glow and pulsating patches, loops, vortices and folds, etc. (Stormer, 1955; Chamber-lain, 1961; Akasofu, 1968; Deehr and Egeland, 1972; Davis, 1978). Moreover, he noted auroral arcs whose direction was unusual, for example, along latitude from South to North. The intensity of these arcs were weak and their orientation
18
Figure 6. Sketches of different auroral forms observed by the J. Sykora expedition team.
Fig. 6. Sketches of different auroral forms observed by the J. Sykora
expedition team.
coincide with the orientation of the polar cap arcs, which can be observed at Spitsbergen latitudes (Sandholt et al., 2002). This kind of aurora was described for 2 December 1899 at
∼01:00 LMT; 5 February 1900 at ∼02:00 LMT; and 28 February 1900 at ∼03:00 LMT. The so-called black aurora (Nadubovich and Starkov, 1962; Davis, 1978; Kornilova et al., 1982) consisting of structured black forms inside a dif-fuse auroral background were also noted by Sykora. His di-ary for 29 December 1899 notes that a “Smooth arc is in the South, its intensity is 3 units. There it is possible to see black structures inside the arc but the nature of those structures is not clear. Detail observations show that cloudiness cannot be a reason for the black regions. Similar events have been observed before, too”.
4.2 Statistics of auroral observations and auroral oval We reconstruct the daily variation of aurora occurrence and its dependence on local time and position of the aurora on the basis of the Russian expedition visual and photographic observations. It is impossible to calculate the daily varia-tion of the aurora occurrence probability because the data on the absence of aurora during clear skies were rarely noted in expedition diaries. To overcome this difficultly, we have calculated the aurora occurrence number for each hour of
S. A. Chernouss et al.: Observations of aurora in the Arctic in 1899–1900 1527
19
Figure 7. Auroral photos obtained from the Spitsbergen Archipelago in 1899.
Fig. 7. Auroral photos obtained from the Spitsbergen Archipelago
in 1899.
observation (N). The results of this calculation are presented in Fig. 8. A sharp increase of the N/hour parameter is ob-served near 23:00 MLT. More than 60% of the observations occur in the 22:00–01:00 MLT time span. Daily variations of the hourly occurrence rate of auroras of different intensity were also computed. All three curves are similar, with a max-imum at 23:00 MLT but the occurrence rate of intense auro-ras is less than that for average intensity auroauro-ras, which, in turn, is less than that for weak intensity auroras. The occur-rence rate of different intensity auroras versus the planetary aa index has been calculated for 2 months of 1899, for which the aa index data were available. The aa index was calculated using magnetic data from two stations situated at about 50◦ geomagnetic latitude, one in the Northern and the other in the Southern Hemisphere, with a longitude difference of about 180◦. The location of the magnetic observatories avoids the regular daily variation and permits estimated variations due global geomagnetic storms only.
Figure 9 shows the relationship between the number of hours of different auroral intensity, shown in Sykora’s unit scale, and median values of the aa index. A near linear de-pendence between these two parameters exists. An increase of auroral intensity follows increasing geomagnetic activity on a planetary scale. The normalised daily variation of au-roral appearances for different observer look directions has
20
Figure 8. Daily variation of auroral occurrence at Spitsbergen.
N 0 10 20 30 40 50 60 MLT 12 14 16 18 20 22 0 2 4 6 8 10 12
Fig. 8. Daily variation of auroral occurrence at Spitsbergen.
21
Figure 9. The dependence of auroral intensity on planetary geomagnetic activity at Spitsbergen for two winter months of 1899.
Fig. 9. The dependence of auroral intensity on planetary
geomag-netic activity at Spitsbergen for two winter months of 1899.
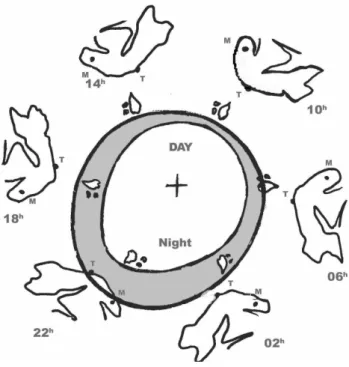
been computed (Ni/N), where Ni is the number of auroral observations in a defined direction (North, South and Zenith) during one hour and N is the total number of observations for all directions. The normalised daily variation of auroral events gives a more realistic representation because it is in-dependent of N. The daily variations of Ni/N are shown in Fig. 10. Clearly, the relative occurrence of aurora towards the south has a maximum near midnight, decreasing both towards the morning and evening hours. The relative oc-currence of aurora towards the north has the opposite statis-tics, with a minimum near midnight and a maximum near midday. The zenithal daily variation of relative aurora oc-currence has two maxima: one in morning and the other in the evening hours. Thus, according to Sykora’s data, the zone of maximum probability of auroral occurrence is sit-uated at 80<74◦during the nighttime and at 80>74◦during the daytime. The latitude of this zone during the morning
1528 S. A. Chernouss et al.: Observations of aurora in the Arctic in 1899–1900
22
Figure 10. Daily variation of relative occurrence of aurora for different look directions at Spitsbergen. N(i)/N 0 0,1 0,2 0,3 0,4 0,5 0,6 0,7 0,8 0,9 MLT N(S)/N N(N)/N N(Z)/N 12 14 16 18 20 22 0 2 4 6 8 10 12
Fig. 10. Daily variation of relative occurrence of aurora for different
look directions at Spitsbergen. 23
Figure 11. Position of Spitsbergen relative to the auroral oval during solar activity minimum.
Fig. 11. Position of Spitsbergen relative to the auroral oval during
solar activity minimum.
and evening hours coincides with the latitude of the observer (i.e. 80∼74◦). Therefore, according to Sykora’s data, the
zone of maximum probability of auroral occurrence is rep-resented by a continuous ring with its center shifted north-ward relative to the North Pole. This represents the same instantaneous continuous auroral oval, which was conceived by Khorosheva (1962), Feldstein (1963), and Feldstein and Starkov (1967). Spitsbergen’s position relative to the auroral oval during solar minimum is shown in Fig. 11. It is clear that Spitsbergen is an unusual place, which can be inside, outside and under the auroral oval. It is exactly this feature of the Spitsbergen Archipelago’s geographic position which is unique compared to other arctic stations, which allows the
instantaneous auroral oval to be mapped out using visual ob-servations. The first attempt of a similar interpretation of visual observations of the aurora at Spitsbergen as the auro-ral oval was performed by Alfv´en (1967), using data from Carlheim-Gillenskiold (1886). However, their published fig-ure of the daily variation of auroral occurrence, which does not contradict the oval concept, does not allow any conclu-sion about the continuity of the instantaneous auroral zone to be drawn.
4.3 Auroral colours and spectra
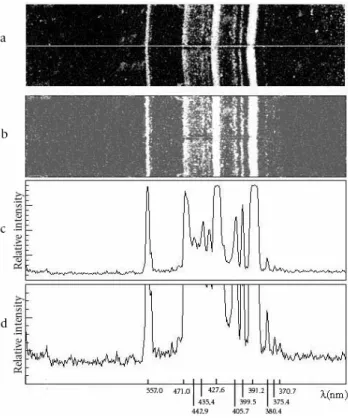
The colours of the aurora were carefully documented by Sykora and all the main features of the coloured aurora are to be found in observational data. Most of the observed au-roras had yellow-green colours, but violet and red colours were also observed. The observations give us the possibil-ity to separate all so-called “B” type aurora (Chamberlain, 1961), which have a bright red lower border in discrete au-roral forms. Sykora noted in his observations from 23 Oc-tober 1899: “The arc appears near the horizon. The inten-sity is 1–2. The arc and flashes inside the arc are red with a rather sharp lower border and green at higher altitude with a smooth border”. Sometimes it was possible to observe red and green arcs or bands simultaneously: “The auroras appear behind the Tschebischew Mountain. The intensity is 1, 2, 3. There are single rays and rayed bands with flashes. Some of them are bright green, others consist of three colours: au-roras with sharp lower borders are red, smooth upper con-tours of the auroras are green and the middle part is violet”. Just two auroral events with only a red emission from lower to highest border were observed: “A mass of red lights in the form of fired tongues with rose details streamed from the Tschebischew Mountain to the Savich Mountain. The inten-sity is 2.” This description of the aurora on 2 January 1900 is in accordance with type “A” aurora, which usually are inter-preted as magnetospheric cleft or cusp signatures nowadays (Yevlashin, 1968; Sandholt et al., 2002). Pulsating patches were named by Sykora as “auroral clouds, which switched on and disappeared”. They had a low intensity with the colour similar to ordinary atmospheric clouds. The auroral spec-tra recorded in 1899 reveal not only the 4 main emissions of the aurora but 9 other emissions in the blue and violet regions of the auroral spectrum. Unfortunately, the spec-tral sensitivity of the photographic plates used was insuffi-cient to register the red 630.0 nm emission, which is typical in the cleft region. Only 5 acceptable negatives were ob-tained using exposures of 4h49m, 4h, 24h, 11h, and 28h7m. A photograph of the auroral spectrum obtained by Sykora is shown in Fig. 12. This example of the auroral spectrum was registered using a 28-h exposure and the spectral image was enhanced using the Belopolsky (1900) method, based on preparation of high contrast dia-negatives, which permits viewing of the weak emissions. The primary spectrum image is imprinted in the central part of figure. The main auroral emissions at 555.7 nm, 470.9 nm, 427.8 nm, and 391.4 nm are clearly distinguished. Moreover, it is possible to see
S. A. Chernouss et al.: Observations of aurora in the Arctic in 1899–1900 1529 24
Figure 12. Examples of auroral spectra obtained from the Spitsbergen Archipelago in 1899.
Fig. 12. Examples of auroral spectra obtained from the Spitsbergen
Archipelago in 1899.
25
Figure 13. Synthetic spectrum constructed by Sykora on the basis of his data.
Fig. 13. Synthetic spectrum constructed by Sykora on the basis of
his data.
some additional emissions in blue − violet part of the spec-trum. According to Sykora (1901) there are spectral lines at 442.9, 435.4, 419.0, 408.3, 405.7, 399.5, 380.4, 375.4, and 370.7 nm. Thus, 9 rather weak emission lines of the au-rora were registered by Sykora. From Chamberlain (1961), the only photographs of the auroral spectrum performed ear-lier were at Harvard College Observatory during a strong au-rora event (Pickering, 1898). He registered emissions in the band 389.2–392.5 nm or near 392.2 nm, near 428.5 nm, near 469.4 nm, near 428.8 nm, and near 386.2 nm. It is unclear why Pickering did not register the most intense auroral emis-sion at 557.7 nm. The synthetic auroral spectrum created and published by Sykora (1901) is shown in Fig. 13. To check the validity of Sykora’s presentation we have used modern pro-cessing methods of the original spectra photographs (Fig. 14, panel a), which we have obtained as secondary photos of the exposed plates. After digitisation, the curved spectral lines
26
Figure 14. Auroral spectrum obtained by Sykora with 28 hours exposure and recovered by modern methods
Fig. 14. Auroral spectrum obtained by Sykora with 28 hours
expo-sure and recovered by modern methods.
have been straightened (Fig. 14, panel b) and integrated to produce photometric curves (Fig. 14, panels c and d). The calculated photometric “cross sections” are in arbitrary lin-ear units using two different scales (Fig. 14, panels c and d) because of the high dynamic range of the data. Figure 14 shows that secondary analysis of Sykora’s data confirms his observations of auroral spectral lines.
5 Discussion
The study performed by the Russian astronomers in 1899–1900 demonstrated a high level of optical experiments, which permitted the discovery of new features in the au-rora. This is the first example of an international collabo-ration investigating the auroral phenomenon by different op-tical methods. Detailed morphological observations of the auroral forms and their dynamics, using both regular visual and occasional photographic recordings, were carried out. A more or less detailed description of all existing types of the aurora was performed. The most impressive details of this study was the discovery of polar cap arcs and the existence of black aurora. The statistics from these observations per-mit us to reconstruct the instantaneous auroral oval. This is possible due to the special position of the Russian expe-dition base at Konstantinovka at about 74◦ N geomagnetic latitude (see Fig. 11), which permits viewing of the aurora in different directions for different local times. The most im-pressive results are the spectral measurements of the aurora
1530 S. A. Chernouss et al.: Observations of aurora in the Arctic in 1899–1900 using a prism spectrograph and photographic plates. Table 1
gives the spectral line wavelengths obtained by Sykora in comparison with those by Pickering (1898) and Chamber-lain (1961). The same emissions are present in the table but Sykora’s data is more precise since his spectrograph had a higher resolution. In addition, Sykora discovered and pub-lished (Sykora, 1901) some auroral emissions previously un-documented. Most probably Sykora’s photographic spec-tra with 557.7 nm present are one of the first ever recorded. Sykora knew that these spectra were not from the nightglow but from auroral emissions, because spectrograph was only switched on when the aurora appeared and was directed into the aurora during the exposure. Sykora tried to interpret his spectra as nitrogen lines because they are similar to spectra from vacuum tube experiments. He wrote: “It is most natu-ral to connect the bands in the auronatu-ral spectrum with nitro-gen emissions. The wavelengths of several bands coincide with nitrogen bands but we do not have enough data to make a definite conclusion. In general, simple comparison of the wavelengths is not so important to understand the nature of the aurora as study of air and nitrogen spectra for variable conditions is. . . .. All that we can say is that the phenomenon of aurora is very similar to the luminosity of rare gas in a vacuum tube. It could be very interesting to study the ni-trogen spectra in a vacuum tube without any electrodes by quartz prism or grating spectrograph. In future experiments we should vary the gas temperature and density, which could influence the spectrum and spectral line positions”.
Sykora also had plans to carry out precise measure-ments of the auroral emission altitudes and talked about a link with fluctuations of the geomagnetic field dur-ing even weak aurora. Most of these ideas were re-alised only years later, first of all by the great Norwe-gian auroral scientists Birkeland (1908); Vegard (1913) and Stormer (1955), as well as Feldstein and Starkov (1967) and others, whose papers are referenced by Chamber-lain (1961); Hultqvist (1967); Omholt (1971); Brekke and Egeland (1979) and Eather (1980).
6 Conclusion
Data from the first complex instrumental investigation of aurora in the Arctic by the Russian-Swedish expedition to Spitsbergen in 1899–1900 are reviewed from a modern point of view. The results of this analysis demonstrate that it was possible to reconstruct the instantaneous auroral oval from the data obtained by this expedition. Almost all typical au-roral forms were described in detail on the basis of system-atic visual high temporal resolution observations. Auroral photographs first obtained in large quantity are the second known in all of the world publications. Photographic spectra of the aurora obtained by the Russian astronomers (includ-ing the green line) are one of the first worldwide. Moreover, investigations of the auroral spectrum by photographic spec-trograph permitted discovery of several emissions never ob-served before.
We know nothing about J. Sykora and his further research destiny after 1903 but his name should undoubtedly be in the cohort of pioneers of auroral studies.
Acknowledgements. The authors thank the St.-Petersburg depart-ment of the Archive of the Russian Academy of Science, N. Shefov from the Moscow Institute of Physics of Atmosphere of RAS and V. Ivanov, V. Shabalin, B. Kozelov as well as V. Kozelov, I. Ko-rnilov and O. Antonenko from the Polar Geophysical Institute of KSC RAS, Apatity for assistance and useful discussions.
Topical Editor U.-P. Hoppe thanks J. M. Bosqued and S. J. Schwartz for their help in evaluating this paper.
References
Akasofu, S. I.: Polar and Magnetospheric Substorms, D. Reidel Publ., 1–318, 1968.
Akasofu, S. I.: Aurora Borealis, Alaska Geographic, 6, 2, 1–95, 1979.
Alfv´en, H.: Note on the “auroral oval”, J. Geophys. Res., 72, 3503, 1967.
Angstrom, A. J.: Spectrum des Nordlichts, Ann. Geophys., 137, 161, 1869.
Angstrom, A. J.: Of the spectra of the Aurora Borealis, J. Phys. Theor. Appl., 3, 210, 1874.
Baschin, O.: Die ersten Nordlichtfotografien, aufgenommen in Bossekop (Lapland), Meteorol, Z.: 17, 278, 1900.
Birkeland, K.: The Norwegian Aurora Polaris Expedition, 1902– 1903, H. Archebourg Co., Christiania, 1908.
Brekke, A. and Egeland A.: Nordlyset, Grondahl and Son Forlag A. S., 1–142, 1979.
Belopolsky, A. A.: Bulletin de l‘Academie Imperial des Sciences de St.-Petersburg, T.XII, 2, Fevrier, 1900.
Carlheim-Gyllenskiold, Expl.Int.Polarires 1882–1883, Exp. Sue-dose, Aurorae boreale, Stockholm, 1886.
Chamberlain, J. W.: Physics of the Aurora and Airglow, Academic Press, New York and London, 1–661, 1961.
Davis, T. N.: Observed characteristics of auroral forms, Space Sci. Rev., 22, 1, 77–113, 1978.
Deehr, C. S. and Egeland A.: Auroral morphology, Ann. Geophys., 28, 415–425, 1972.
Eather, R. H.: Majestic Lights. The Aurora in Science, History and the Art., AGU, Washington D.C., 1–323, 1980.
Feldstein, Ya. I.: Some aspects of the auroral morphology and ge-omagnetic disturbances in the high latitudes (in Russian), Geo-magnetism and Aeronomy, 3, 2, 227–239, 1963.
Feldstein, Ya. I. and Starkov G. V.: Dynamics of auroral belt and polar geomagnetic disturbances, Planet. Sp. Sci., 15, 2, 209–229, 1967.
Fritz, H.: Das Polarlicht, Brockhaus, Leipzig, 1881.
Hultqvist, B.: Introduksjon til Geokosmofysikken, Natur och Kul-tur, Stockholm, 1967.
Khorosheva, O. V.: Daily drift of continuous auroral ring, Geomag-netism and Aeronomy, 2, 5, 839–850, 1962.
Kornilova, T. A., Chernouss S. A., and Pudovkin M. I.: Black Aurora, Proceedings of 10th Annual Meeting on Upper Atmo-spheric Studies by Optical Methods, Grass, France, 198–206, 1982.
Loomis, E.: On the geographical distribution of auroras in the Northern Hemisphere, Amer. J. Sci. Arts, 30, 89, 1860.
S. A. Chernouss et al.: Observations of aurora in the Arctic in 1899–1900 1531 Muncke, G. W.: Nordlicht, Physikaliches W¨orterbuch, 7, edited by:
Schwickert, E. B., Leipzig, 113, 1837.
Nadubovich, Yu. A., Starkov, G. V.: Filament structure of the weak homogeneous auroral arcs, Geomagnetism and Aeronomy, 2, 1, 71–73, 1962.
Omholt, A.: The optical aurora, Springer–Verlag, 1971.
Pickering, E. C. : Photographic spectrum of the aurora, Astron. Nachr., 146, 175, 1898.
Sandholt, P. E., Carlson, H. C., and Egeland A.: Dayside and Polar Cap Aurora, Kluver academic publishers, Dor-drecht/Boston/London, 1–287, 2002.
Schroder, W.: Some aspects of the earlier history of solar-terrestrial physics, WP Druck and Verlag Darmstadt, 1–148, 2004. Stormer, C.: The Polar Aurora, Clarendon Press, Oxford, 1955. Sykora, J.: Sur la Photographie du Spectre de L‘Aurore
Bore-ale, Memoires de L‘Academie Imperiale des Sciences de St.-Petersbourg, Vol. 11, 9, 1–9, 1901.
Sykora, J.: Die Wellenl¨angen der photographisch erhaltenen Linien des Nordlichtspectrum, Astronomische Nachrichten, 156, 326, 1901.
Sykora, J.: Observations Directes et Photographies des Aurores Bo-reales, Memoires de L‘Academie Imperiale des Sciences de St.-Petersburg, 14, 5, 1–50, 1903.
Tromholt, S.: Norwegian testimony of the aurora sounds, Nature, 32, 499, 1885.
Vegard, L.: On Spectra of the Aurora Borealis, Phys. Z., 14, 677, 1913.
Yevlashin, L. S.: On the character of auroral glow within the auroral region at periods of solar activity maximum and minimum, Ann. Geophys., 24, 2, 527–530, 1968.
Wrakberg, U.: Co-operation and achievements of the Swedish-Russian arc-of-meridian expedition in Spitsbergen 1898–1902, International scientific cooperation in the Arctic, Abstracts of the conference, Barentsburg, Spitsbergen Archipelago–Moscow, 61–62, 2001.