HAL Id: hal-00317377
https://hal.archives-ouvertes.fr/hal-00317377
Submitted on 1 Jan 2002
HAL is a multi-disciplinary open access
archive for the deposit and dissemination of
sci-entific research documents, whether they are
pub-lished or not. The documents may come from
teaching and research institutions in France or
abroad, or from public or private research centers.
L’archive ouverte pluridisciplinaire HAL, est
destinée au dépôt et à la diffusion de documents
scientifiques de niveau recherche, publiés ou non,
émanant des établissements d’enseignement et de
recherche français ou étrangers, des laboratoires
publics ou privés.
Location of Pc 1?2 waves relative to the magnetopause
R. E. Denton, J. Labelle, X. Zhu
To cite this version:
R. E. Denton, J. Labelle, X. Zhu. Location of Pc 1?2 waves relative to the magnetopause. Annales
Geophysicae, European Geosciences Union, 2002, 20 (11), pp.1763-1767. �hal-00317377�
Annales
Geophysicae
Location of Pc 1–2 waves relative to the magnetopause
R. E. Denton, J. LaBelle, and X. Zhu
Department of Physics and Astronomy, Dartmouth College, Hanover, NH 03755, USA Received: 21 May 2002 – Revised: 15 July 2002 – Accepted: 17 July 2002
Abstract. Spacecraft-borne and ground-based
magnetome-ters frequently detect magnetospheric micropulsations in the period range 0.2–10 s, termed Pc 1–2, and attributed to electromagnetic ion cyclotron waves driven by temperature anisotropy (T⊥ > Tk). Previous surveys of Pc 1
occur-rence locations have been limited to L ≤ 9. We present AMPTE/IRM observations of the distribution of Pc 1 waves out to the magnetopause, for a limited region of MLT = 10–14. The probability of wave occurrence Pwav is large
(> 0.15) between L = 7–12, peaking at L = 8–10 (Pwav∼
0.25). When the L-value is normalized to the magnetopause position Lmp, however, the highest probabilities of Pc 1 wave
occurrence are close to the magnetopause, with Pwav∼0.25
for Lnorm ≡ L/Lmp =0.8–1.0. These results are
consis-tent with increased convective growth rate at large L and with the greater effect of magnetosphere compression close to the magnetopause. On the other hand, we only directly observe magnetic field compression for at most about 25% of the wave events.
Key words. Magnetospheric physics (magnetospheric
con-figuration and dynamics; MHD waves and instabilities; plasma waves and instabilities)
1 Introduction
Magnetospheric micropulsations in the period range 0.2– 10 s, termed Pc 1-2, are commonly observed on the ground and in space, and are thought to be associated with electro-magnetic ion cyclotron (EMIC) waves driven by temperature anisotropy (T⊥> Tk) (Anderson et al., 1996). As discussed
by Anderson et al. (1992a) and Fraser and Nguyen (2001), early theoretical considerations favored the region just in-side the plasmapause as the most likely location for the pro-duction of EMIC waves. This outer region of the plasma-sphere would overlap with the ring current population (which
Correspondence to: R. E. Denton
drives the instability), yet would have small group velocity
vg ∼ VA ∼ ρ−1/2, where VAis the Alfv´en speed and ρ is
the mass density. Thus, the convective growth rate S ∼ γ /vg
would be large, where γ is the temporal growth rate. Nevertheless, some early models (Criswell, 1969; Perraut et al., 1976) indicated that there could be significant wave amplification at L > 7, depending on the plasma model. Indeed, spacecraft observations show that EMIC waves are prevalent in the outer magnetosphere L > 7 (Erlandson et al., 1990), consistent with the results of some earlier ground-based data (Fraser, 1968). Anderson et al. (1992a, b) provide the most extensive statistical survey of Pc 1 wave properties using spacecraft data, showing that the occurrence frequency of Pc 1 waves peaks in the early afternoon and increases out to the outermost L-shell sampled by AMPTE/CCE ∼ 9. They explain this increase with a simple magnetospheric model in which the decrease in magnetic field B (dipole model) at large L contributes significantly to a decrease in
vg ∼VA ∼B. Fraser and Nguyen (2001) studied Pc 1
spa-tial occurrance using the CRRES satellite, which includes electron density measurements, allowing the plasmapause position to be identified. They found a slight enhancement of Pc 1 wave power at the plasmapause, but concluded that Pc 1 occurrence does not maximize at the plasmapause; in-stead it predominates in the afternoon and increases with ra-dial distance, consistent with the results of Anderson et al. (1992a).
Olson and Lee (1983) reviewed ground magnetometer ob-servations which connect the occurrence of Pc 1 waves with sudden compressions of the magnetosphere (or sudden im-pulse SI). From double adiabatic theory, they show that com-pressions lead to an increase in the hot particle anisotropy
A ≡ (T⊥−Tk)/Tk−1, which in turn leads to the
stimula-tion of Pc 1 waves. In fact, Anderson et al. (1996) showed that EMIC instability can be roughly predicted if Aβk1/2∼>1, where βk is the ratio of the parallel plasma pressure to the
magnetic pressure. The model of Olson and Lee (1983) shows that compressions do not significantly change βk, but
1764 R. E. Denton et al.: Location of Pc 1–2 waves relative to the magnetopause
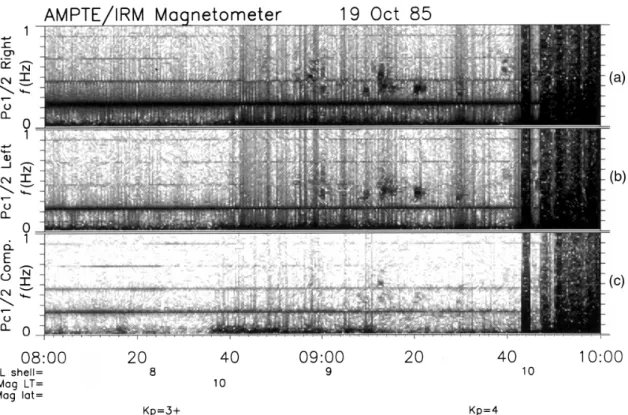
Fig. 1. Survey spectrogram of right-hand polarized (top panel), left-hand polarized (middle panel), and compressional (bottom panel) Pc 1
waves detected by the IRM flux-gate magnetometer on 19 October 1985. In this example, Pc 1 waves occur starting at 08:54 UT and continue to be detected intermittently until the IRM passes into the magnetosheath at about 09:48 UT. The strong line at 0.22 Hz is due to satellite spin and should be ignored.
present an example of a compression-induced Pc 1 event as-sociated with a magnetospheric substorm in which the Pc 1 waves turn on and off with the precise timing of the com-pression. Anderson and Hamilton (1993) show that the prob-ability of observing Pc 1 waves in space is significantly en-hanced during magnetospheric compressions. In their view, the magnetosphere is usually near marginal stability to EMIC waves, and magnetospheric compressions lead to increased anisotropy A and readily switch the magnetosphere to the un-stable state. This model explains the higher occurrence rates of Pc1 waves at large L by Anderson et al. (1992a) (up to the maximum L-value sampled by AMPTE/CCE), because compressions have a larger effect on the region close to the magnetopause than on the inner magnetosphere.
Engebretson et al. (2002) examined the set of Pc 1 events observed simultaneously by an array of ground stations in Antarctica and by the Polar spacecraft during the first 18 months of satellite operation. They found that 75% of these events occurred at the same time as magnetospheric com-pressions, although about half of these events are associated with spatially localized distribution functions (apparently an-other cause of EMIC waves). Several of their spatially local-ized events are not correlated with magnetospheric compres-sions. They showed evidence that these distribution func-tions may result from convergence of drift paths from in-jection on the nightside or stagnation of flow along certain drift paths. Furthermore, some Pc 1 events, though perhaps
only a small percentage, are directly associated with par-ticle interactions associated with substorms (Erlandson and Ukhorskiy, 2001).
Anderson et al. (1992a) and Fraser and Nguyen (2001) in-dicate that Pc 1 waves are more likely at large radii but do not determine the distribution of waves at very large L due to the orbits of the spacecraft used (apogee of R ∼ 9REfor
AMPTE/CCE and ∼ 7REfor CRRES). In this paper, we use
magnetometer data from the AMPTE/IRM spacecraft (19RE
apogee) to examine the L-shell distribution of Pc 1 waves in the magnetic local time (MLT) range 10–14.
2 Data analysis
The AMPTE/IRM spacecraft, operated between August 1984 and August 1986, had an apogee of ≈ 19RE and an
inclination ≈ 27 deg. It included plasma, magnetic field, energetic particle, and wave experiments. The data used in this study are from the three-axis flux-gate magnetome-ter which measured the vector magnetic field 32 times per second (L¨uhr et al., 1985). Since the full vector is mea-sured, the magnetic field can be broken into right-hand, left-hand, and compressional components by transforming to mean field coordinates (with z along the mean field), Fourier-transforming, and recombining the complex Fourier trans-forms of the x and y components into BL,R = Bx±iBy
before computing the power spectrum. This procedure is outlined by Kodera et al. (1977) and used in many subse-quent papers (e.g. LaBelle and Treumann, 1992, who apply the technique to AMPTE/IRM data).
Figure 1 shows example Pc 1 wave survey spectrograms produced from the IRM vector magnetometer data from 08:00–10:00 UT on 19 October 1985, when IRM was located at approximately 10:00 MLT and moving outward, intersect-ing field lines correspondintersect-ing to L-shells rangintersect-ing from 7.4 to 10.3 RE. The L-shell values are determined by mapping the
field line of the spacecraft, assuming the dipole field model, and computing its equatorial stand-off distance. In Fig. 1, panels a–c represent right-polarized, left-polarized, and com-pressional waves, respectively. The horizontal line at 0.22 Hz (and harmonics) results from the spacecraft spin and should be ignored. On 19 October, the spacecraft encounters the magnetopause at 09:44–09:48 UT (L ≈ 10.2RE), and after
that time broadband, large amplitude fluctuations, character-istic of the magnetosheath, dominate all three components of magnetic field. Inside the magnetosphere, Pc 1 waves ap-pear as a series of ap-pearl-like emissions on frequencies 0.25– 0.60 Hz, starting at 08:54 UT (L = 8.8RE) and continuing
intermittently right up to the magnetopause. Such events are easily identified in the Pc 1 wave survey spectrograms archived at Dartmouth.
For a statistical study, we examined survey spectrograms similar to Fig. 1 for all times when AMPTE/IRM was within the magnetosphere for MLT in the range 10:00–14:00, and for which the satellite collected data during the nearest mag-netopause crossing either immediately before or immedi-ately after, providing an estimate of the magnetopause po-sition. For each ten minutes of data, we noted the L-value, the number of minutes of wave data (excluding data gaps), and the number of minutes during which Pc 1 waves (0.1– 1 Hz) were observed above the noise level of the survey plots. Each survey plot is independently scaled to optimize detec-tion of events, but power spectral densities as small as 0.5– 1.0 nT2/Hz are easily detectable (see, for example, Fig. 1 of LaBelle and Treumann, 1992). Altogether, there were 47 IRM orbits which met our criteria, and Pc 1 waves were observed for at least for some range of L during 37 of these. The upper limit of frequency sampled in our study is 1 Hz. The lower limit is harder to define, but is approximately 0.1 Hz. The question arises as to whether or not we are able to detect all EMIC waves occuring at a particular time. Based on the distribution of frequencies in Fig. 10 of Anderson et al. (1992a), and assuming a frequency bandwidth of ±30% typical of events in their study, our 1 Hz upper limit causes us to miss about 1% of the EMIC events for L = 5–6, and less for higher L-values. For L = 4–5, however, we detect only about half of EMIC events. This problem is accentuated for the MLT range 10–14, since the highest frequencies occur in that range (Fig. 9 of Anderson et al. (1992a)), yet even in that range, the vast majority of events occurring at L ≥ 6 have a frequency < 1 Hz. Therefore, the 1-Hz limit is not a prob-lem for L ≥ 6, but our study significantly underestimates the occurence probabilities for L < 5. As seen from Fig. 9 of
norm
obs
wav
wav
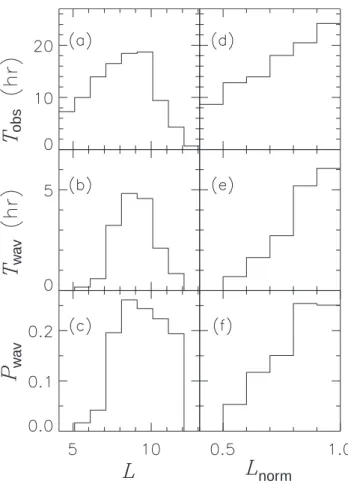
Fig. 2. (a) Total time of observations Tobsin hours, (b) total time
of Pc 1 wave activity Twav in hours, and (c) Pc 1 wave
occur-rence probability Pwav = Twav/Tobs in L bins 3.1–4.1, 4.1–5.1,
. . ., 12.1–13.1.
Panels (d), (e), and (f) show the same quantities as were plotted in (a), (b), and (c), respectively, but now plotted versus Lnorm ≡ L/Lmpfor Lnormbins 0.4–0.5, 0.5–0.6, . . ., 0.9–1.0.
Anderson et al. (1992a), the 0.1 Hz lower limit should not be a problem for MLT = 10–14.
Figure 2 shows the results of this statistical study. In Figs. 2a–c, we show the total time of observations Tobs, the
total time of Pc 1 wave activity Twav, and the wave
occur-rence probability Pwav=Twav/Tobs, respectively, for L bins
3.1–4.1, 4.1–5.1, . . ., 12.1–13.1. As discussed above, the probability of EMIC wave occurrence at L = 4–5 is not reli-able, and the probability at L = 5–6 may be slightly higher than we measure. Nevertheless, Fig. 2c clearly shows that the occurrence probability drops steeply at low L, as evidenced by the values of Pwavat L = 5–6 and 6–7. The actual
occur-rence rate for L = 4–5 is probably very small, though it may not be as low as zero, as was found in this study restricted to
f ≤1 Hz.
The uncertainties in Pwav are difficult to estimate.
Mod-elling after a Gaussian distribution, a rough estimate can be found by dividing the Pwavvalues by the square root of the
number of orbits (statistically distinct events). However, the data for a particular orbit did not always span all the L bins.
1766 R. E. Denton et al.: Location of Pc 1–2 waves relative to the magnetopause Typically, there were data from about 30 orbits averaged in
each bin. Thus, we estimate a 1/
√
30 = 18% uncertainty. The values of Pwav shown in Fig. 2c are consistent with
the results of Anderson et al. (1992a) up to the maximum L-value sampled in their survey ∼ 9. Figure 2c shows that
Pwavreaches its highest value at L = 8–10, and that it
de-creases for larger L. Such a result does not necessarily indi-cate that the wave probability decreases as the magnetopause is approached. The position of the magnetopause is not the same for all the data plotted in Fig. 2c. In fact, the nominal magnetopause location is roughly at L = 10, and the largest L-values in Fig. 2c (12.1–13.1) will only be within the mag-netosphere (inside the magnetopause) when the solar wind pressure is low and the magnetopause is relatively uncom-pressed. Under such conditions, the Pc 1 wave occurrence probability might be low, as discussed in Sect. 1.
In order to determine the distribution of Pc 1 wave proba-bility with respect to the magnetopause location, Figs. 2d–e show the same quantities as were shown in Figs. 2a–c, but plotted versus Lnorm ≡ L/Lmp, where Lmp is the L-value
of the magnetopause for the particular orbital pass. In some cases, there were a number of closely spaced magnetopause crossings and we chose the average position among these crossings. In most cases, the difference in the L-value be-tween the closest value (smallest L) and this “average” value was small (∼ 0.1RE), although it sometimes ranged to be as
much as 0.5 RE. Figure 2f shows that for the probability of
Pc 1–2 wave occurrence Pwavincreases for locations near the
magnetopause. The value of Pwavis the same for the 0.8–0.9
and 0.9–1.0 bins within the statistical uncertainty.
Finally, we examined the magnitude of the magnetic field observed during the Pc 1 events of this survey in an effort to determine whether they are associated with compressions of the magnetosphere. At most, about 25% of the observed Pc1 events were associated with enhancements (of at least
∼15%) in the magnetic field, which may indicate compres-sions. Anderson and Hamilton (1993) observed that when the AMPTE/CCE data are screened to include only times of magnetospheric compressions, the Pc 1 occurrence rate was enriched from the normal value ∼ 20–25% to 63%. Our data would be consistent with those of Anderson and Hamilton if such compressions occur about 10% of the time. On the other hand, our fraction of compression related events seems to be significantly less than that found by Engebretson et al. (2002).
3 Summary
The most comprehensive survey of Pc 1 occurrence locations to date is that of Anderson et al. (1992a), but their survey is limited to L ≤ 9. Using AMPTE/IRM data, we measure the distribution of Pc 1 waves out to larger L for a limited region of MLT = 10–14. We find that the probability of wave occur-rence Pwavis large (> 0.15) between L = 7–12, peaking at
L =8–10 (Pwav ∼0.25). When the L-value is normalized
to the magnetopause position Lmp, the highest probabilities
of Pc 1 wave occurrence are close to the magnetopause, with
Pwav ∼0.25 for Lnorm ≡L/Lmp =0.8–1.0. These results
are consistent with increased convective growth rate at large
L (Anderson et al., 1992a), and with the greater effect of magnetosphere compression close to the magnetopause (An-derson and Hamilton, 1993). On the other hand, we only di-rectly observe magnetic field compression for at most about 25% of the wave events.
Acknowledgements. We acknowledge the help of Thaddeus Law
with this research. Work at Dartmouth was supported by NASA grant NAG5-11712.
Topical Editor G. Chanteur thanks A. Potapor and another ref-eree for their help in evaluating this paper.
References
Anderson, B. J. and Hamilton, D. C.: Electromagnetic ion cyclotron waves stimulated by modest magnetospheric compressions, J. Geophys. Res., 98, 11 369–11 382, 1993.
Anderson, B. J., Erlandson, R. E., and Zanetti, L. J.: A statistical study of Pc 1-2 magnetic pulsations in the equatorial magneto-sphere, 1, Equatorial occurrence distributions, J. Geophys. Res., 97, 3075–3088, 1992a.
Anderson, B. J., Erlandson, R. E., and Zanetti, L. J.: A statistical study of Pc 1-2 magnetic pulsations in the equatorial magneto-sphere, 2, Wave properties, J. Geophys. Res., 97, 3089–3101, 1992b.
Anderson, B. J., Denton, R. E., Ho, G., Hamilton, D. C., Fuselier, S. A., and Strangeway, R. J.: Observational test of local proton cyclotron instability in the Earth’s magnetosphere, J. Geophys. Res., 101, 21 527–21 544, 1996.
Criswell, D. R.: Pc 1 micropulsation activity and magnetospheric amplification of 0.2- to 5.0-Hz hydrodynamic waves, J. Geophys. Res., 74, p. 205, 1969.
Engebretson, M. J., Peterson, W. K., Posch, J. L., Klatt, M. R., Anderson, B. J., Russell, C. T., Singer, H. J., Arnoldy, R. L., and Fukunishi, H.: Observations of two types of Pc 1-2 pulsations in the outer dayside magnetosphere, J. Geophys. Res., in press, 2002.
Erlandson, R. E. and Ukhorskiy, A. J.: Observations of electromag-netic ion cyclotron waves during geomagelectromag-netic storms: Wave oc-currence and pitch angle scattering, J. Geophys. Res., 106, 3883– 3896, 2001.
Erlandson, R. E., Zanetti, L. J., Potemra, T. A., Block, L. P., and Holmgren, G.: Viking magnetic and electric field observations of Pc 1 waves at high latitudes, J. Geophys. Res., 95, 5941–5955, 1990.
Erlandson, R. E., Zanetti, L. J., Engebretson, M. J., Arnoldy, R. L., B¨osinger, T., and Mursula, K.: Pc 1 waves generated by a mag-netospheric compression during the recovery phase of a geomag-netic storm, in: Solar Wind Sources of Magnetospheric Ultra-Low-Frequency Waves, (Eds) Engebretson, M. J., Takahashi, K., and Scholer, M., AGU, Washington D. C., 1994.
Fraser, B. J.: Temporal variations in Pc 1 geomagnetic micropulsa-tions, Planet. Space Sci., 16, p111, 1968.
Fraser, B. J. and Nguyen, T. S.: Is the plasmapause a preferred source region of electromagnetic ion cyclotron waves in the mag-netosphere?, J. Atmos. Solar-Terr. Phys., 63, 1225–1247, 2001.
Kodera, K., Gendrin, R., and De Villedary, C.: Complex represen-tation of a polarized signal and its application to ULF waves, J. Geophys. Res., 82, 1245–1255, 1977.
LaBelle, J. and Treumann, R. A.: Poynting vector measurements of electromagnetic ion cyclotron waves in the plasmasphere, J. Geophys. Res., 97, 13 789–13 797, 1992.
L¨uhr, H., Kl¨ocker, N., Oelschl¨agel, W., H¨ausler, B., and Acu˜na, M.:
The IRM fluxgate magnetometer, IEEE Trans. Geosci. Remote Sens., GE-23, p. 259, 1985.
Olson, J. V. and Lee, L. C.: Pc 1 wave generation by sudden im-pulses, Planet. Space Sci., 31, p. 295, 1983.
Perraut, S., Gendrin, R., and Roux, A.: Amplification of ion-cyclotron waves for various typical radial profiles of magneto-spheric parameters, Atmos. Terr. Phys., 38, p. 1191, 1976.