E-logpO2 diagrams for ironmaking by molten oxide electrolysis
W.D. Judge1, A. Allanore2, D.R. Sadoway2, and G. Azimi1,3,*
1Department of Materials Science and Engineering, University of Toronto, 184 College street,
Toronto, Ontario M5S3E4 Canada
2Department of Materials Science and Engineering, Massachusetts Institute of Technology, 77
Massachusetts Avenue, Cambridge, MA 02139, USA
3Department of Chemical Engineering and Applied Chemistry, University of Toronto, 200
College street, Toronto, Ontario M5S3E5 Canada
*Correspondence to: Gisele Azimi ([email protected])
Abstract
Molten oxide electrolysis is a promising approach to sustainable iron extraction, where direct electrolytic decomposition of iron ore proceeds to yield liquid metallic iron and pure oxygen gas. Here, through fundamental investigations, we constructed thermodynamic E-logpO2 diagrams for systems containing iron and its oxides to elucidate the chemistry of the electrolysis cell at
various electric potentials and oxygen partial pressures. Two isotherms, 1473 and 1873 K, were investigated, representing the conditions of the frozen electrolyte sidewall and molten oxide electrolyte in the electrolysis cell, respectively. Stability regions of solid and liquid oxides were determined and the effect of electric potential and oxygen partial pressure on their stoichiometry was explored. The results would enable further development of the electrolysis cell through providing a means for improving the design of the electrolyte to maximize current efficiency.
Keywords: Molten oxide electrolysis; Ironmaking; E-logpO2 diagram; Iron oxide; Phase stability
1. Introduction
Iron and steel are among the most widely used structural materials in construction,
transportation, piping, and other advanced applications. The conventional production process entails the carbothermic reduction of iron ore in a blast furnace to produce pig iron, which is further treated to remove harmful impurities before forming the basis for primary steel [1]. Although high throughput is realized, the process remains carbon- and energy-intensive and, over the past few decades, the steel industry has been investing in breakthrough technologies to reduce environmental impacts and improve energy efficiency [2].
A promising environmentally sustainable alternative technology for ironmaking is molten oxide electrolysis whereby metal is produced upon passing current through a molten system of metal oxides capable of dissolving iron ore [3-6]. During electrolysis, an electric current is imposed between two electrodes to provide the electromotive force necessary to decompose the ore to iron metal and oxygen gas. The use of a molten oxide electrolyte allows iron ore, typically hematite (Fe2O3), to be directly fed to the cell and the operating temperature to be set above the melting point of iron metal (1811 K) without concern for volatilization. In the overall cell reaction, liquid iron metal is obtained at the cathode and oxygen gas is evolved at the anode according to the following reaction:
The premise of this process is similar to that of other molten salt electrolytic processes used for commercial production of many reactive metals, such as aluminum, magnesium, and the rare earths [7-9]. Metal extraction by molten salt electrolysis is a proven technology utilized on the commercial scale for over a century, however, there are unique challenges in developing electrolysis for iron extraction [10].
The electrical conductance of molten iron oxides is primarily electronic in nature, which precludes direct electrolysis due to low current efficiency [11]. To improve current efficiency, covalent network-forming oxides, such as silica have been used as a basis for supporting electrolytes, but these also lead to prohibitive increases in bath viscosity. To help flux the system, ionic oxides, such as calcia or magnesia, must be incorporated into the electrolyte, but these also tend to increase electronic conduction; thereby reducing current efficiency [12]. Electronic conduction is believed to arise from the balance of Fe(II) and Fe(III) ions developed in the melt. In these systems, a complex equilibrium contingent upon the composition of the electrolyte (‘free’ O2–) and partial pressure of oxygen is established according to
½ O2(gas) + 2 Fe2+(melt) = 2 Fe3+(melt) + O2–(melt) (2)
In the electrolysis cell, the composition of the electrolyte remains mostly unchanged, but the partial pressure of oxygen varies over a wide range, from 1 atm at the anode to about 10–9 atm at the cathode. Determining the thermodynamics of the Fe(II) and Fe(III) distribution in the melt would enable better optimization of the electrolyte for higher current efficiencies as well as improvements in cell design for interelectrode spacing and overpotential distribution. Here, we establish thermodynamic E-logpO2 diagrams for iron and its oxides to provide electrochemists with a means for improved process design in molten oxide electrolytes.
Considering their importance in ferrous metallurgy, thermodynamic properties of iron and its oxides have been studied extensively in the literature and their T-logpO2 diagrams have been established [13,14]. However, as the molten electrolysis cell operates in thermal balance, it is of greater interest to establish isothermal E-logpO2 relationships. Here, we present theory and procedures to construct E-logpO2 diagrams from existing thermodynamic data for metal oxides systems, with a focus on iron and its oxides. These diagrams are thermodynamic in nature, and provide no information regarding kinetics, although the latter is presumably fast at the
temperatures under consideration.
2. Theory
The decomposition of a generic metal oxide, MO, to metal and oxygen gas may be described by
MO(s or l) → M(s or l) + ½ O2(g) (3)
and the free energy change of the reaction is given by
∆ GT=∆ GTo+RT lnaMpO 2 1/ 2
aMO (4)
In this expression, ∆ GTo represents the free energy of reaction when all products and reactants
are in their standard states at the temperature under consideration. The choice of standard state is arbitrary; however, chemical activities of species must be expressed with respect to this
designated state. Here, aMO and aM represent the chemical activities of the metal oxide and metal, respectively; while the chemical activity of oxygen gas is represented by its partial
pressure, pO 2 , signifying its behaviour as an ideal gas. In this treatment, it is implied reaction
(3) takes place under isothermal and isobaric conditions.
The free energy change for reaction (3) is related to the electromotive force ET through the Nernst equation [15], ∆ GT=−nF ET , where n is the number of electrons transferred and F is the Faraday constant. Based on the Nernst equation, the reduction potential of the metal oxide is expressed according to ET=−∆ GT nF =ET o −RT nF ln aMpO 2 1/ 2 aMO (5)
In this work, we are interested in the relationship between the reduction potential and the partial pressure of oxygen gas; thus, we rearranged equation (5) to express this variable in the common logarithm by ET=ETo+2.303 RT nF log aMO aM −2.303 RT 2 nF log pO 2 (6)
E-logpO2 diagrams are constructed using expressions in the form of equation (6). Calculations must also be performed for any reduction reactions involving other thermodynamically stable oxides. For a complete description of the reduction potential, the chemical activities of the condensed phases must be known or estimated.
3. Methodology
Here, we are interested in the thermodynamic stability of iron and its oxides at various electric potentials and oxygen partial pressures at constant temperature and a total pressure of 1
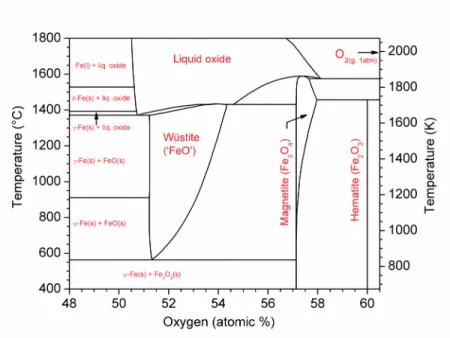
atmosphere. We first analyzed phase relations in the system with the aid of FactSage 7.0 software [16]. The schematic iron-oxygen phase diagram, presented in Figure 1, reveals iron forms three well-defined solid oxides: hematite (Fe2O3), magnetite (Fe3O4), and wüstite (‘FeO’), each characterized by different oxidation states of iron [17].
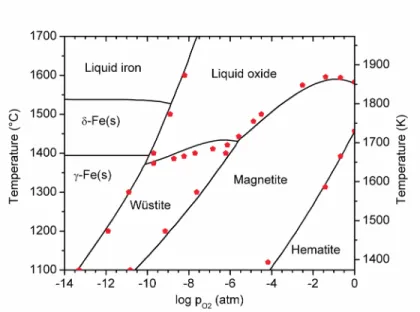
Figure 1 – Schematic iron-oxygen phase diagram at constant pressure of 1 atmosphere. Hematite is a virtually stoichiometric oxide, where iron is present as Fe(III), while magnetite contains iron as a mixture of Fe(II) and Fe(III), and exhibits some solubility of oxygen in excess of Fe3O4 stoichiometry. In wüstite, iron is present as Fe(II) with some amount of Fe(III), and the oxide is highly non-stoichiometric with formulae varying from FeO1.05 to FeO1.20; hence its descriptor ‘FeO’. Each of these oxides are characterized by a region of stability under different oxygen partial pressures and temperatures, as shown by the T-logpO2 diagram in Figure 2, but this provides no information regarding the influence of electric potential.
Figure 2 – T-logpO2 diagram for iron and its oxides. Experimental data are from Refs. [13,14].
To determine the effect of electric potential, E-logpO2 diagrams must be constructed. Here, the 1473 K (1200 °C) and 1873 K (1600 °C) isotherms were considered. The former is necessary as the postulated commercial electrolysis cell operates with a protective ‘skull’ of frozen electrolyte around the periphery of the cell, whose chemistry must be elucidated, while the latter is
representative of the operational temperature for the molten electrolysis cell, which is set above the melting point of iron metal.
3.1 Scenario One: 1473 K Isotherm
At this temperature, iron may exist as austenite (-Fe(s)) or form different solid oxides depending on the oxygen partial pressure, as shown in Figure 2. To determine the phase stability regions in the E-logpO2 domain, the following phase boundary reactions are considered:
FeOx(s )=γ Fe(s)+x 2O2 (g) (7) Fe3O4(s )=3 FeOx+ y(s)+4−3(x + y ) 2 O2( g) (8) 3 Fe2O3 (s)=2 Fe3O4+ y(s)+1−2 y 2 O2 (g) (9)
The reduction potentials for reactions (7), (8), and (9) are given by equations (10), (11), and (12), respectively. As these reactions involve non-stoichiometric oxides, the number of electrons transferred depends on the values of x and y.
E7=E1473o + 2.303 RT 2 xF log aFeOx (s) aFe(s) −2.303 RT 4 F log pO 2 (10) E8=E1473o + 2.303 RT 2(4−3 (x+ y ))Flog aFe 3O 4( s) aFeOx + y (s )3 − 2.303 RT 4 F log pO2 (11) E9=E1473o + 2.303 RT 2(1−2 y) Flog a3Fe2 O 3(s) aFe 3 O 4 + y(s) 2 − 2.303 RT 4 F log pO 2 (12)
The phase boundary reactions represent a situation where two solid phases and one gas phase co-exist in equilibrium at constant temperature and pressure. To satisfy Gibbs’ phase rule, the compositions of the solid oxides, and by extension their activity, are fixed in these reactions. Between the phase boundaries, the situation is not so restricted and a range of stoichiometry is possible according to
FeOx+ y (s)=FeOx(s)+ y
Fe3O4+ y(s)=Fe3O4 (s)+ y
2O2 (g) (14)
The effect of the changes in stoichiometry on the reduction potential is given by
E13=E1473 o +2.303 RT 2 yF log aFeOx+ y(s) aFeOx (s) −2.303 RT 4 F log pO 2 (15) E14=E1473o + 2.303 RT 2 yF log aFe 3O 4+ y(s) aFe3 O 4 (s) −2.303 RT 4 F log pO 2 (16)
Evidently, to evaluate the effect on the reduction potential, the activities of the solid oxides must be known relative to a standard state.
3.2 Scenario Two: 1873 K Isotherm
At this temperature, liquid iron, liquid oxide, and oxygen gas are in equilibrium at the phase boundary shown in Figure 2 and described by
FeOx(l)=Fe(l)+x
2O2(g ) (17)
To satisfy Gibbs’ phase rule, the composition of the liquid oxide, and by extension its activity, must be constrained to one value and has no degree of freedom in reaction (17). To construct the
E-logpO2 diagram, the reduction potential was calculated according to
E17=E1873o + 2.303 RT 2 xF log aFeOx(l) aFe(l ) −2.303 RT 4 F log pO 2 (18)
As this reaction involves a non-stoichiometric liquid oxide, the number of electrons transferred depends on the singular value of x where equilibrium is attained with liquid iron and oxygen gas. As we move away from the phase boundary into the liquid oxide domain, liquid iron can no longer co-exist in equilibrium with its liquid oxide. Here, new equilibria are established between liquid iron oxide and oxygen gas, according to
FeOx+ y (l )=FeOx (l )+ y
2O2 (g) (19)
The composition of the liquid oxide in reaction (19) is not constrained and varies with the partial pressure of oxygen. The effect of the change in stoichiometry on the reduction potential of the liquid oxide is given by
E19=E1873o +2.303 RT 2 yF log aFeOx+ y(l) aFeOx (l ) −2.303 RT 4 F log pO 2 (20)
To evaluate the effect on reduction potential, the activities of liquid oxides must be known relative to a standard state.
4. Results and Discussion
The system of iron and its oxides represents a complex situation where the composition of solid and liquid oxides is subject to change through forming solutions with oxygen. To construct the
E-logpO2 diagrams, the thermodynamic properties of the oxides must be known over different compositions. To reconcile thermodynamic data from different investigations in the literature, we have adopted the standard states listed in Table 1 for constructing E-logpO2 diagrams, and converted existing data as necessary, based on measured oxygen pressures over the components.
The system under investigation here comprise iron and oxygen only; thus at a given temperature and oxygen partial pressure, this system can only consist of one or two of the components in Table 1 and oxygen gas. With a preliminary glance, it could appear that none of the components listed in Table 1 could deviate from their standard states; because they are always ‘pure’ in the usual sense that they are not part of a mixture containing any other elements than iron and oxygen. However, as we know from the iron-oxygen phase diagram [17], the oxide components listed in Table 1, whether solid or liquid, do not have a fixed composition. For example, at the 1473 K isotherm, the composition of the wüstite phase can vary from about 51.2 at% to 53.8 at% oxygen and between these limits, ‘wüstite’ remains ‘wüstite’, but each composition has different thermodynamic properties. As customary, we account for the change in thermodynamic
properties arising from the change in composition by utilizing the concept of activity; hence we defined the standard state of wüstite to include an arbitrary composition, as was done in Table 1. Here we chose to define the standard state of liquid iron oxide in Table 1 with respect to pure metallic iron as a convenience for the main objective, i.e., electrowinning of metallic iron. Solid metallic iron and liquid metallic iron are the only components in Table 1 that remain
substantially ‘pure’ in the sense that their composition is virtually fixed, owing to the negligible solubility of oxygen [17].
In the present work, we are examining the fundamental systems comprising iron and oxygen only. In the case other elements are included in the system, then the composition and the concentration of the components listed in Table 1, will determine their chemical activity. For a more detailed discussion on the matter, the reader is referred to reference work on the topic [18].
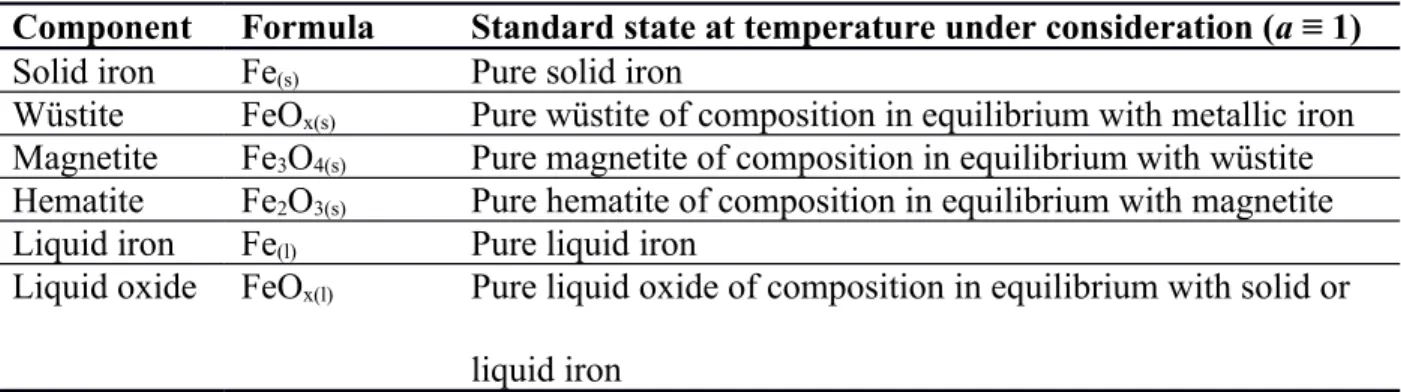
Table 1 – Standard states of components used in constructing E-logpO2 diagrams for iron and its oxides.
Component Formula Standard state at temperature under consideration (a ≡ 1)
Solid iron Fe(s) Pure solid iron
Wüstite FeOx(s) Pure wüstite of composition in equilibrium with metallic iron
Magnetite Fe3O4(s) Pure magnetite of composition in equilibrium with wüstite
Hematite Fe2O3(s) Pure hematite of composition in equilibrium with magnetite
Liquid iron Fe(l) Pure liquid iron
Liquid oxide FeOx(l) Pure liquid oxide of composition in equilibrium with solid or
liquid iron
4.1 1473 K Isotherm
To construct the E-logpO2 diagram at 1473 K, the stoichiometric boundaries of each oxide must be known in addition to the activities of the oxides in between. At this temperature, the wüstite field ranges from a composition of FeO1.0495 at the iron-rich boundary to FeO1.1656 at the oxygen-rich one [17]. To determine the standard reduction potential, equilibrium at the austenite-wüstite phase boundary must be known.
At the iron-rich boundary, wüstite decomposes to austenite under an oxygen partial pressure of 1.16×10⁻¹² atm [13]. The composition of austenite produced in this reaction is saturated with oxygen; however, the terminal solubility of oxygen is so low that the activity of austenite is safely assumed to be unity. With this treatment, the reduction potential of wüstite, in volts, is given by EFeO x( s)=−0.872+ 0.1462
(
NO NFe−1.0495)
log aFeO x(s )−0.07308 log pO 2 (21)To express the composition of the oxide in the usual way, the stoichiometric placeholder x becomes the molar ratio of NO/NFe. This expression is valid over the range of the wüstite field: 1.0495 ≤ NO/NFe ≤ 1.1656. When wüstite is in its standard state, i.e. NO/NFe = 1.0495, no
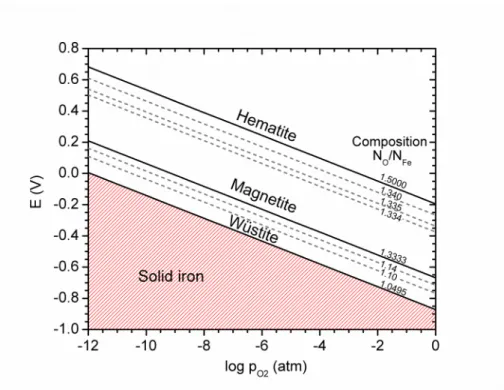
correction for its activity is needed and the second term in equation (21) should be ignored. Here, the standard state of wüstite defines the boundary between wüstite and solid iron metal, as presented in the E-logpO2 diagram of Figure 3.
To use equation (21) beyond the standard state of wüstite, it is required to determine the activity of wüstite experimentally for different compositions. There have been several such investigations across the wüstite field at 1473 K [13,19-22], and some of these data are included in Figure 3. In the electrolysis cell, the location and composition of wüstite in the sidewall of frozen electrolyte can be predicted in the vicinity of 1473 K by the electric potentials and oxygen pressures given in Figure 3. When the composition of wüstite reaches FeO1.1656, further increase in oxygen partial pressure or electric potential results in transformation to magnetite.
The magnetite field at this temperature ranges from stoichiometric Fe3O4 at the iron-rich boundary to Fe3O4.0644 at the oxygen-rich one [17]. At the iron-rich boundary, magnetite
decomposes to oxygen-saturated wüstite (FeO1.1656) under an oxygen partial pressure of 7.21×10 -10 atm [13], which was used to determine the standard reduction potential of magnetite. The
complete reduction potential of magnetite, in volts, is given by
EFe3O 4+ y(s )=−0.668+ 0.1462
(
NO NFe−1.3333)
logaFe3O 4+ y (s)−0.07308 log pO 2 (22)Again, to express the composition of the oxide in the usual way, the molar ratio of NO/NFe was used. This expression is valid over the range of the magnetite field: 1.3333 ≤ NO/NFe ≤ 1.3548.
When magnetite is in its standard state, i.e. NO/NFe = 1.3333, no correction for its activity is
needed and the second term in equation (22) should be ignored. In our treatment, the standard state of magnetite defines the boundary between magnetite and wüstite, as presented in the E-logpO2 diagram in Figure 3.
To use equation (22) beyond the standard state of magnetite, it is required to determine the activity of magnetite experimentally for different compositions. There have been several investigations across the magnetite field at 1473 K [14,23-26], and we have included some of these data in Figure 3. Magnetite predominates over a large range of electric potentials and oxygen pressures in the E-logpO2 diagram, and this suggests that magnetite may comprise a major portion of the sidewall of frozen electrolyte in the electrolysis cell. Magnetite should not become electro-magnetized nor affect iso-potential lines in the electrolysis cell, since the
temperature remains above its Curie point of 848 K [27]. However, the electronic conductivity of magnetite may pose a short-circuiting problem if it exists as a continuous phase throughout the sidewall. Therefore, the composition of the solids, which precipitates from the melt upon cooling, becomes an important consideration in the design of the supporting oxide electrolytes. When the composition of magnetite reaches Fe3O4.0644, further increases in oxygen partial pressure or electric potential results in transformation to hematite.
Hematite is a virtually stoichiometric compound with the formula Fe2O3 and no ability to solubilize excess oxygen [17]. At this temperature, hematite decomposes to oxygen-saturated magnetite (Fe3O4.0644) under an oxygen partial pressure of 2.15×10⁻³ atm (Figure 2), which was used to determine the standard reduction potential of hematite. Since its stoichiometry is
constant, the activity of hematite, by extension, will also remain constant across different partial pressures of oxygen. With this treatment, the reduction potential of hematite, in volts, is given by
EFe2O3( s)=−0.195−0.07308 log pO 2 (23)
This equation defines the boundary between hematite and magnetite in the E-logpO2 diagram in Figure 3. Any increase in oxygen partial pressure beyond this boundary only changes the composition of the gas phase over hematite. In the electrolysis cell, hematite can be expected in the crust of frozen electrolyte at relatively noble potentials and high oxygen partial pressures, perhaps forming near the anode.
Figure 3 – E-logpO2 diagram for iron and its oxides for the 1473 K isotherm. The solid lines indicate phase boundaries, while the dashed lines indicate iso-activity lines for some solid solutions of oxygen in the oxides.
4.2 1873 K Isotherm
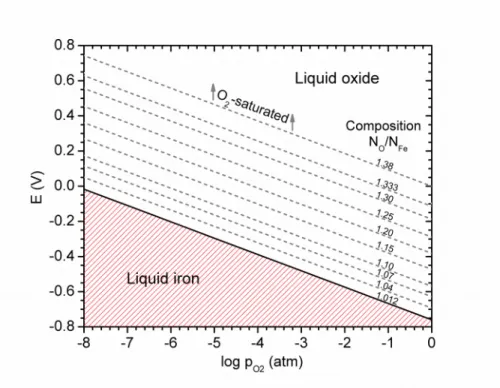
To construct the E-logpO2 diagram at 1873 K, the stoichiometric boundaries of the liquid oxide must be known in addition to the activities of the liquid oxides in between. At this temperature, the liquid oxide field ranges from a composition of FeO1.012 at the iron-rich boundary to FeO1.38 at the oxygen-saturated one [17]. At the iron-rich boundary, liquid oxide decomposes to liquid metallic iron under an oxygen partial pressure of 6.64×10⁻⁹ atm (Figure 2), which was used to determine the standard reduction potential of liquid iron oxide.
The composition of metallic iron produced by this decomposition is saturated with oxygen; however, the activity of metallic iron may still be satisfactorily set to unity, since the terminal solubility of oxygen here is a sparing 0.23 wt%, and furthermore; the activity of oxygen exhibits negative deviation from Raoultian law [28]. An important implication of this treatment is the use of an inert cathode, which is founded upon the postulated commercial cell where the denser iron metal is deposited in a pool beneath the oxide electrolyte and is periodically tapped or siphoned, similar to aluminum electrolysis. Laboratory investigations sometimes dictate the use of
refractory metal cathodes, whereby iron deposits as an alloy; hence, its activity can not be considered unity.
With the above considerations, the reduction potential of liquid oxide, in volts, is given by
EFeOx(l)=−0.760+ 0.1858
(
NONFe−1.012
)
log aFeOx(l)−0.09292 log pO 2
(24)
To express the composition of the liquid oxide in the usual way, the stoichiometric placeholder x becomes the molar ratio of NO/NFe. This expression is valid over the range of the liquid oxide
field: 1.012 ≤ NO/NFe ≤ 1.38. When the liquid oxide is in its standard state, i.e., NO/NFe = 1.012,
no correction for its activity is needed and the second term in equation (24) should be ignored. Here, the standard state of the liquid oxide defines the boundary between liquid iron oxide and liquid metallic iron, as presented in the E-logpO2 diagram in Figure 4.
To use equation (24) beyond the standard state of the liquid oxide, it is required to determine the activity of this component experimentally for different compositions. There has been such investigation across the liquid oxide field at 1873 K [14], and we have included some of these data in Figure 4. It should be noted that the thermodynamic decomposition potential considered here would represent only a portion of the total cell potential as electrolysis is conducted.
In practice, the decomposition potential is augmented by overpotentials arising from polarization at the electrode interfaces as well as Ohmic potential drops through the electrolyte, electrodes, and external connections. Therefore, the total cell potential during electrolysis should not be speculated before a commercial prototype is available. The decomposition potential, however, is fundamental and independent of cell design, and provides a reference point for which other design parameters are adjusted. The total cell potential characterizes the heat and energy balance of the cell and is regulated by adjusting, for example, current density, interelectrode spacing, and iron oxide concentration. Of course, interelectrode spacing must also allow a certain Ohmic potential drop to be maintained through the electrolyte to provide internal heating of the electrolysis cell.
In the electrolysis cell, the composition of the liquid oxide in contact with the cathode is always thermodynamically constrained to one value, but the partial pressure of oxygen may vary with electric potential as indicated in the E-logpO2 diagram in Figure 4. Conversely, at the anode, the
partial pressure of evolving oxygen is generally fixed at 1 atm, but the composition of the liquid oxide in contact with the anode may vary with electric potential as indicated in Figure 4. In the bulk electrolyte, however, the composition of the liquid oxide is not as clearly defined and falls somewhere between the confines of the anode and cathode.
Figure 4 – E-logpO2 diagram for iron and its oxide for the 1873 K isotherm. The solid line indicates a phase boundary, while the dashed lines indicate iso-activity lines for some solutions of oxygen in the liquid oxide.
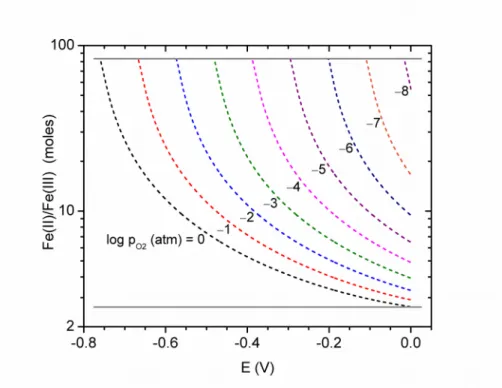
To elucidate the valence distribution between the anode and the cathode, we constructed a valence distribution diagram for iron, as presented in Figure 5. Here, we fitted an empirical curve to experimental measurements of liquid oxide composition against oxygen partial pressure [14] and used this curve to interpolate liquid oxide compositions at specified partial pressures of
oxygen and electric potentials. This allowed the relationship between valency and electric potential to be expressed with iso-pressure contours of oxygen, as indicated in Figure 5. The distribution between Fe(II) and Fe(III) at any point in the molten oxide electrolyte can be predicted if the electric potential and oxygen partial pressure are known to a reasonable degree. The ratio of Fe(II)/Fe(III) is a decisive factor in determining the electronic conduction of the melt, which limits the current efficiency during electrolysis. With the conditions of this
equilibrium thermodynamically specified, molten oxide electrolytes can be designed to optimize this ratio and maximize the current efficiency.
To design a supporting molten oxide electrolyte ideally requires thermodynamic properties of all components in the melt to be known for different oxygen partial pressures. In this case, the activity of iron oxides is all that is required to determine the decomposition potential and valency distribution, which is a predictor of electronic conductivity and current efficiency. However, in the absence of detailed thermodynamic data, the situation can be supplemented by overlaying E-logpO2 diagrams. Unlike iron oxides, most of the proposed electrolyte components are
stoichiometric oxides and, therefore, present simplified E-logpO2 relationships, which can be superimposed over the diagram for iron and its oxide to predict new phase stability regions, valencies, and the extent of oxygen solubility in the melt. Of course, the decomposition potential of the electrolyte components must remain greater than that of iron oxide and any compounds formed in the system, for example, silicates or aluminates, should be included in analyses. In an equivalent manner, the behaviour and destination of minor impurities in the melt can be
Figure 5 – Valence distribution diagram of iron in liquid oxide at the 1873 K isotherm. The solid lines indicate phase boundaries while the dashed lines indicate iso-pressure contours of oxygen.
5. Conclusions
Through fundamental investigations, we constructed thermodynamic E-logpO2 diagrams for iron and its oxides at two different isotherms. At 1473 K, the stability regions of metallic iron, wüstite, magnetite, and hematite were determined, and the effect of electric potential and oxygen partial pressure on their stoichiometry was explored. The practical implication of these results is predicting the solid-state chemistry of the sidewall of frozen electrolyte in the iron electrolysis cell. At 1873 K, the stability regions of liquid iron and its liquid oxide were determined, and the relationship between the electric potential and oxygen partial pressure and the valence
molten oxide electrolyte composition and cell configuration to maximize the current efficiency of the process.
6. Acknowledgements
The authors gratefully acknowledge the financial support of the Natural Sciences and Engineering Research Council (NSERC) of Canada (Grant number: 498382).
7. References
[1] E.T. Turkdogan. Fundamentals of Steelmaking. The Institute of Materials, London, (1996). [2] Y. Kim and E. Worrell. "International comparison of CO2 emission trends in the iron and
steel industry." Energy Policy 30(10): 827-838, (2002).
[3] D.R. Sadoway. "The electrochemical processing of refractory materials." JOM 43(7): 15-19, (1991).
[4] D.R. Sadoway. "New opportunities for metal extraction and waste treatment by electrochemical processing in molten salts." J. Mater. Res. 10(3): 487-492, (1995). [5] D. Wang, A.J. Gmitter and D.R. Sadoway. "Production of oxygen gas and liquid metal by
electrochemical decomposition of molten iron oxide." J. Electrochem. Soc. 158(6): E51-E54, (2011).
[6] H. Kim, J. Paramore, A. Allanore and D.R. Sadoway. "Electrolysis of molten iron oxide with an iridium anode: the role of electrolyte basicity." J. Electrochem. Soc. 158(10): E101-E105, (2011).
[7] J. Thonstad, P. Fellner, G.M. Haarberg, J. Hives, H. Kvande and A. Sterten. Aluminum
[8] G.J. Kipouros and D.R. Sadoway. "The chemistry and electrochemistry of magnesium production." Adv. Molten Salt Chem. 6: 127-209, (1987).
[9] N. Krishnamurthy and C.K. Gupta. Extractive Metallurgy of Rare Earths. CRC Press, Boca Raton, (2016).
[10] A. Allanore. "Features and challenges of molten oxide electrolytes for metal extraction." J.
Electrochem. Soc. 162(1): E13-E22, (2015).
[11] M.T. Simnad and G. Derge. "Note on the nature of conduction in liquid iron oxide and iron silicates." J. Chem. Phys. 21(5): 933-934, (1953).
[12] M. Barati and K.S. Coley. "Electrical and electronic conductivity of CaO-SiO2-FeOx slags at various oxygen potentials: Part I. experimental results." Met. Mater. Trans. B 37(1): 41-49, (2006).
[13] L.S. Darken and R.W. Gurry. "The system iron-oxygen. I. The wüstite field and related equilibria." J. Am. Chem. Soc. 67(8): 1398-1412, (1945).
[14] L.S. Darken and R.W. Gurry. "The system iron-oxygen. II. Equilibrium and
thermodynamics of liquid oxide and other phases." J. Amer. Chem. Soc. 68(5): 798-816, (1946).
[15] G.N. Lewis and M. Randall. Thermodynamics and the Free Energy of Chemical
Substances. McGraw-Hill Book Company, Inc., New York, (1923).
[16] C.W. Bale, E. Bélisle, P. Chartrand, S.A. Decterov, G. Eriksson, A.E. Gheribi, K. Hack, I.-. Jung, Y.-. Kang, J. Melançon, A.D. Pelton, S. Petersen, C. Robelin, J. Sangster, P. Spencer and M. Van Ende. "FactSage thermochemical software and databases, 2010–2016."
CALPHAD: Comput. Coupling Phase Diagrams Thermochem. 54: 35-53, (2016).
[18] L.S. Darken and R.W. Gurry. Physical Chemistry of Metals. McGraw-Hill Book Company, Inc., New York, (1953), pp. 235-282, 350-353.
[19] P. Vallet and P. Raccah. Mem. Sci. Rev. Metall. 62: 1-29, (1965).
[20] B. Swaroop and J.B. Wagner. "On the vacancy concentrations of wustite (FeOx) near the p to n transition." Trans. Am. Inst. Min. Metall. Eng. 239(8): 1215-1218, (1967).
[21] I. Bransky and A.Z. Hed. "Thermogravimetric determination of the composition-oxygen partial pressure diagram of wustite (Fe1-yO)." J. Am. Ceram. Soc. 51(4): 231-232, (1968). [22] R.A. Giddings and R.S. Gordon. "Review of oxygen activities and phase boundaries in
wustite as determined by electromotive-force and gravimetric methods." J. Am. Ceram. Soc. 56(3): 111-116, (1973).
[23] J.W. Greig, E. Posnjak, H.E. Merwin and R.B. Sosman. "Equilibrium relationships of Fe3O4, Fe2O3, and oxygen." Am. J. Sci. Series 5, Vol. 30(177): 239-316, (1935).
[24] J. Smiltens. "The standard free energy of oxidation of magnetite to hematite at temperatures above 1000°." J. Am. Chem. Soc. 79(18): 4877-4880, (1957).
[25] H.-. Sockel and H. Schmalzried. Ber. Bunsen-Ges. 72(7): 745-754, (1968).
[26] R. Dieckmann. "Defects and cation diffusion in magnetite (IV): Nonstoichiometry and point defect structure of magnetite (Fe3-ΔO4)." Ber. Bunsen-Ges. 86(2): 112-118, (1982).
[27] D.O. Smith. "Magnetization of a magnetite single crystal near the Curie point." Phys. Rev. 102(4): 959-963, (1956).
[28] J.F. Elliott, M. Gleiser and V. Ramakrishna. Thermochemistry for Steelmaking. Addison-Wesley Publishing Company, Inc., Reading, Massachusetts, (1963).