HAL Id: hal-02899317
https://hal.archives-ouvertes.fr/hal-02899317
Submitted on 15 Jul 2020HAL is a multi-disciplinary open access archive for the deposit and dissemination of sci-entific research documents, whether they are pub-lished or not. The documents may come from teaching and research institutions in France or abroad, or from public or private research centers.
L’archive ouverte pluridisciplinaire HAL, est destinée au dépôt et à la diffusion de documents scientifiques de niveau recherche, publiés ou non, émanant des établissements d’enseignement et de recherche français ou étrangers, des laboratoires publics ou privés.
Total Internal Reflection Tip-Enhanced Raman
Spectroscopy of Cytochrome C
David Talaga, Andrew Bremner, Thierry Buffeteau, Renaud Vallée, Sophie
Lecomte, Sébastien Bonhommeau
To cite this version:
David Talaga, Andrew Bremner, Thierry Buffeteau, Renaud Vallée, Sophie Lecomte, et al.. Total In-ternal Reflection Tip-Enhanced Raman Spectroscopy of Cytochrome C. Journal of Physical Chemistry Letters, American Chemical Society, 2020, 11, pp.3835-3840. �hal-02899317�
Total Internal Reflection Tip-Enhanced Raman
Spectroscopy of Cytochrome C
David Talaga,† Andrew Bremner,†,$ Thierry Buffeteau,† Renaud A.L. Vallée,‡ Sophie Lecomte, §
and Sébastien Bonhommeau*,†
† Univ. Bordeaux, CNRS, Bordeaux INP, ISM, UMR 5255, F-33400 Talence, France
$ Colorado School of Mines, Golden, CO 80401 USA
‡Univ. Bordeaux, CNRS, CRPP, UMR 5031, F-33600 Pessac, France
§Univ. Bordeaux, CNRS, CBMN, UMR 5248, F-33600 Pessac, France
* To whom correspondence should be addressed. E-mail: sebastien.bonhommeau@u-bordeaux.fr
ABSTRACT. Surface and tip-enhanced Raman spectroscopies in total internal reflection
(TIR-SERS and TIR-TERS) are used to characterize the oxidation, spin and ligation state of
cytochrome C (Cc) molecules electrostatically bound on hydrophilic thiol self-assembled
monolayer. TIR-SERS spectra of this model hemoprotein show marker bands typical of the 6cLS
ferric state of Cc. The performances of the TIR-TERS technique as a function of the incidence
angle are described, showing in particular a significant electromagnetic enhancement of the
Raman signal under p-polarized light excitation. TIR-TERS spectra of Cc confirm the 6cLS
probe with nanoscale spatial resolution the 6cLC oxidized form of Cc that is potentially
implicated in cell apoptotic processes. The minimal far-field contribution of the sample in
TIR-TERS also offers promising perspectives for future nanoscale chemical characterizations of
photosensitive biomolecules in complex biological media.
TOC GRAPHICS
KEYWORDS Tip-enhanced Raman spectroscopy, Surface-enhanced Raman spectroscopy,
Total internal reflection, Finite difference time domain, Cytochrome C.
TEXT. Tip-enhanced Raman spectroscopy (TERS) established itself as a powerful technique
to characterize many biomolecules, such as nucleic acids, peptides/proteins and complex
biological systems (cells, viruses, bacteria…).1 In TERS, a monochromatic propagative wave
excites resonantly a tapered noble metal probe in order to generate an enhanced and confined
electromagnetic field at the really end of this tip. The produced intense and localized evanescent
field results from two enhancement mechanisms, namely the resonant plasmonic effect that is
highly dependent on the material, the size, the shape and the surrounding medium of the TERS
addition, the resonant nanoantenna effect allows for the conversion of the evanescent (near) field
into propagative (far) field, at the origin of the detected TERS signal. In traditional bottom, side
or top-illumination configurations,1 a propagative-wave excitation lead to the irradiation of a tip
portion with diffraction-limited dimensions much larger than the nanoscale apex size, which may
induce the detection of parasitic signals generated by the tip sides. Furthermore, photosensitive
molecules, such as hemoproteins, may be damaged when they are resonantly excited by direct
light irradiation at the same time as the TERS tip, especially in bottom-illumination
configuration. In order to limit these issues, an incident excitation in total internal reflection
(TIR) geometry can be proposed. TIR-TERS has been recently applied to characterize a thin
layer of copper phthalocyanine.2 Not only did the authors demonstrate the feasibility of
TIR-TERS measurements with nanoscale (better than 40 nm) spatial resolution but they also revealed
that the signal enhancement is more than 20 times over side-illumination configuration.
However, in this case, TIR was realized through a prism instead of a high numerical aperture
objective currently used in bottom-illumination TERS instruments that are often employed to
probe biological specimens.1
Herein, we present a TIR-TERS technique implemented in a conventional bottom-illumination
AFM-TERS instrument, by probing cytochrome C (Cc) under resonant excitations. Cc is a
globular monoheme protein of relatively large size (ca. 3.4 nm in diameter) which acts as an electron carrier in the respiratory chain of aerobic organisms.3 It transfers electrons between the
Cc reductase and Cc oxidase enzyme complexes which are both embedded in the mitochondrial
membrane. It was shown to be implicated in the apoptotic processes via its transfer from the
intermembrane space to the cytosol, one of the main enzymes acting in the reaction cascades of
neuronal loss in the brain of persons suffering from Alzheimer's disease (AD). In the native
form, Cc exists in ferric and ferrous states and shows a six-coordinated low-spin (6cLS) heme
center. Only this native 6cLS state was suggested to characterize the form implicated in the
apoptotic processes.6 In this state, the heme is axially bound to a methionine (Met) and an
histidine (His) ligand. In non-native forms however, the axial Met ligand, that is the most labile
ligand, is replaced or removed to form either six-coordinated high-spin (6cHS) or
five-coordinated high-spin (5cHS) species, respectively.6 These non-native forms were observed in
both ferric and ferrous oxidation states. The oxidation, spin and ligation state of the Cc heme iron
can be clearly identified by Raman and surface-enhanced Raman scattering (SERS) experiments
under resonant excitation.6-14 These investigations showed that each Cc state was related to
specific Raman bands in the 1300-1700 cm-1,6,9-14 and may present an additional relevant feature
at 750 cm-1.10-12 SERS experiments on Cc molecules electrostatically bound to thiol self-assembled monolayers (SAMs) on Ag and Au electrodes (see Supporting Information for
explanations about the interest of Cc attachment on alkanethiol SAMs) revealed that the 6cLS
state of the adsorbed Cc prevails in the oxidized form while the 5cHS state seems to be
predominant in the reduced form.7,8,10 All the observed bands were assigned to specific heme
modes. However, amino acid bands were observed neither in RR nor in SERS.6,12 Only
resonance tip-enhanced Raman spectroscopy (TERS) allowed vibration modes assigned to
Histidine (His), Tyrosine (Tyr) and Phenylalanine (Phe) residues at 837, 932 and 1002 cm-1
respectively,12 and those characterizing the Cc oxidation and spin states,12-14 to be discerned.
Nevertheless, very few TERS data on Cc molecules in the pure ferric 6cLS state were reported
Prior to the description of TIR-TERS, resonance TIR-SERS measurements on Cc molecules
are presented to provide benchmark spectra for subsequent comparison with their TIR-TERS
counterparts. The advantages of TIR-TERS are then emphasized in the light of the performances
of TIR-Raman, using an experimental/theoretical approach. Finally, TIR-TERS is employed to
probe Cc and confirm its oxidation, spin and ligation state.
Determination of the Cc state by TIR-SERS. TIR-SERS measurements of Cc molecules
electrostatically bound to a SAM of 11-mercaptoundecanoic acid (MUA) covering a rough Ag
film (see experimental details in Supporting Information) were carried out at 532nm irradiation
wavelength. This allows for the resonant excitation of both Cc molecules and the localized
surface plasmon resonance (LSPR) of the SERS-active Ag substrate. The UV-visible absorption
spectrum of Cc in 0.2mM aqueous solution displays indeed a Soret band at 409nm, and a weaker
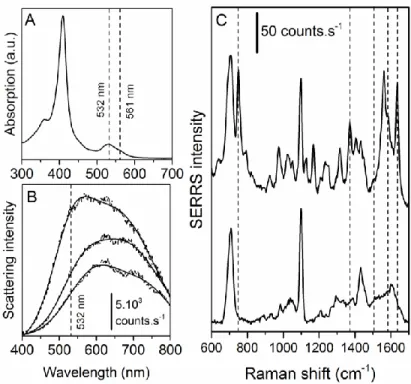
Q band at 530nm, both originating from the porphyrin chromophore of the heme group (Figure
1A). Moreover, dark-field Rayleigh scattering microscopy (DFRSM) spectra of uncoated SERS
substrates show LSPRs at 570 nm that are red shifted by 60 nm upon MUA coating (Figure 1B).
The addition of Cc on the thiol SAM does not affect further LSPRs. Only the scattering intensity
is progressively decreased upon increasing the thickness of the dielectric layer (Cc and thiols) on
top of the metal substrate (Figure 1B). For 532 nm excitation, the investigated 500-1800 cm-1
spectral range corresponds to the 546-588 nm region located near the maximum of the LSPR
band of SERS substrates. This irradiation wavelength is thus perfectly suited to achieve
resonance SERS measurements of Cc. In contrast, the excitation of the Soret band could lead to
very intense resonance Raman signals of the heme center of Cc, but the SERS enhancement of
Raman signatures associated with both Cc and the underlying thiols would be quite weak, and
Figure 1. A) UV-visible absorption spectrum of an 0.2mM aqueous solution of Cc. Laser
wavelengths used to excite the LSPR of the SERS substrates and the TERS tip are indicated. B)
From top to bottom, DFRSM spectra of uncoated and MUA-coated silver SERS substrates as
well as DFRSM spectrum of silver SERS substrate coated with MUA and Cc molecules. The
laser wavelength allowing for the excitation of these substrates is mentioned. C) Resonance
TIR-SERS spectra of MUA (bottom) and Cc deposited on a MUA SAM (top) for a 532 nm
irradiation. The dashed lines indicate the wavenumber of expected Cc marker bands.
Figure 1C presents resonance TIR-SERS spectra of pristine and Cc-covered MUA SAMs.
Hydrophilic MUA SAMs have been chosen to mimic the negatively-charged surface of Cc
oxidase, in order to obtain a good recognition of Cc and facilitate the direct electron transfer
process. For this reason, replacing MUA by a mixture of MUA and hydrophobic undecanethiol
molecules to better mimic the heterogeneity of real membranes reduces the SERS signal
Supporting Information). In the absence of Cc, the successful functionalization with MUA
molecules is revealed by the intense band centered at 706 cm-1 assigned to C-S stretching
vibrations as well as the band at 1099 cm-1 assigned to the C-O stretching vibration of the MUA
terminal -COOH/-COO- group.15 Carbonyl bands of MUA molecules expected in the 1700-1740
cm-1 were not observed. This may be related to their low Raman cross-section and to the
presence of negatively charged terminal carboxylate groups instead their hydrogenated
counterparts, thus confirming the relevance of MUA to mimic the surface of Cc oxidase. After
deposition of Cc molecules, many new SERS bands centered at 751, 1372, 1584 and 1636 cm-1
and assigned to the porphyrin ring appear. These four marker bands are assigned to the so-called
15, 4, 2 and 10 vibration modes of the heme group respectively, and are fully consistent with
the presence of Cc in the native ferric 6cLS state,6,12 as expected in the deposited neutral-pH Cc
aqueous solution and on SERS-active substrates at 0 V electrical potential.6 Previous Raman
measurements reported also a 3 band at 1502 cm-1 typical of this state,6 but it is hardly
discernable in our SERS spectra. It is important to point out that native and non-native forms of
Cc with different axial ligands (upon replacement of the labile Met residue by His for instance)
and biological activities may both be 6cLS species.6 Thus, only very subtle Raman shifts,
requiring a very high (< 1 cm-1) spectral resolution to be identified, allow them to be
distinguished from each other. However, conventional spectral resolutions are sufficient to
exclude indubitably the presence of other species such as 6cHS ferric, 5cHS ferric, 6cLS ferrous
and 5cHS ferrous states of Cc.
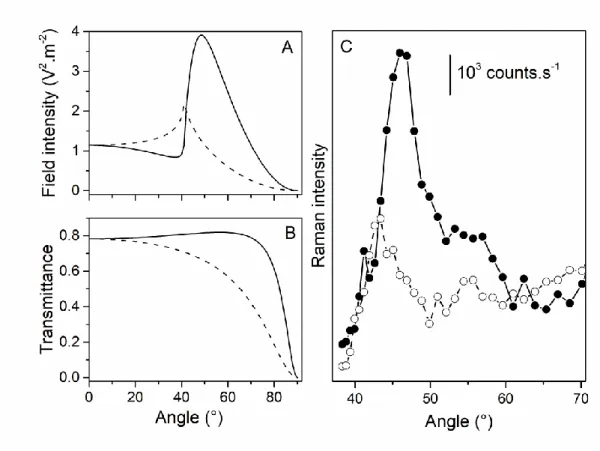
TIR-Raman characterization of Cc. For the study of Cc, a glass/Au (10 nm)/MUA/Cc (5-20 nm)
multilayer sample has been selected for three reasons. As explained in the preceding section, Cc
work in TIR, the critical angle must be precisely determined. However, as the refractive index of
Cc on glass is very close to that of borosilicate glass alone (1.44 vs. 1.518),16,17 it turns out to be
extremely difficult to identify the glass/Cc interface in the absence of Au interlayer, and thus to
identify the TIR regime. In practice, the intensity of the Raman signal associated with a glass/Cc
sample was found to be almost constant irrespective of the incidence angle, albeit slightly higher
(by 30% at most) under p-polarized than under s-polarized light excitation. Finally, the thickness
of the Au interlayer was optimized to lead to the strongest Raman signal in TIR configuration.
The determination of the ideal thickness not only requires the calculation of mean-square electric
fields within the 20 nm-thick Cc layer but also that of the transmittance of the Au interlayer,
since the collected Raman signal must traverse the Au film to be detected. Considering these two
quantities, the strongest TIR-Raman signal is found for 10-20 nm Au thicknesses under
p-polarized 561 nm excitation and 5 nm Au thickness under s-p-polarized 561 nm excitation (Figure
S3). Note that the 561 nm wavelength has been preferred to the 532 nm one for reference
TIR-Raman characterizations because it allows for the excitation of the LSPR of our Ag/Au TERS
probes18 and of Cc (Figure 1A), while their excitation would be inefficient at 532 nm. Figure 2A
presents mean-square electric fields inside a 20 nm-thick Cc layer covering a 10 nm-thick Au
layer under p-polarized and s-polarized light irradiation. Figure 2B shows the corresponding
transmittance of the same Au layer. The maximal mean-square electric field is found at 48° and
41° incidence angles for p-polarized and s-polarized excitations, respectively, considering the
41° critical angle in our configuration. On the experimental standpoint, the dependence of the
Raman intensity associated with a glass/Au (10 nm)/MUA/Cc multilayer sample as a function of
the incidence angle can be estimated by integrating the spectral regions centered either at 1600 cm-1 (Figures 2C and S4) or at 750 cm-1 (Figures S4 and S5) that are typical of Cc molecules.
Incidence angles leading to maximal Raman intensities appear to be 46-47° and 42-43° under
p-polarized and s-p-polarized 561 nm laser light, which is very close to aforementioned theoretical
values. Figure 2C also shows that the Raman intensity under p-polarized excitation is more than
twice as high as its counterpart under s-polarized excitation. As p polarization (with dominant
component in the z-direction perpendicular to the xy sample plane) is particularly convenient to
excite TERS tips in bottom-illumination configuration,19 the high mean-square electric field
under p-polarized excitation constitutes an obvious advantage to probe Cc in TIR-TERS.
Figure 2. A) Calculated mean-square electric fields in a 20 thick Cc layer on top of a 10
nm-thick Au film for p-polarized (straight line) and s-polarized (dashed line) incident light
excitations and different incidence angles. B) Calculated transmittance of a 10 nm-thick gold
different incidence angles. C) Raman intensity of the spectral region centered at 1600 cm-1 for a
5-20 nm-thick Cc layer on a 10 nm-thick Au film excited using p-polarized (straight line with
full circles) and s-polarized (dashed line with open circles) 561 nm incident laser light and
different incidence angles.
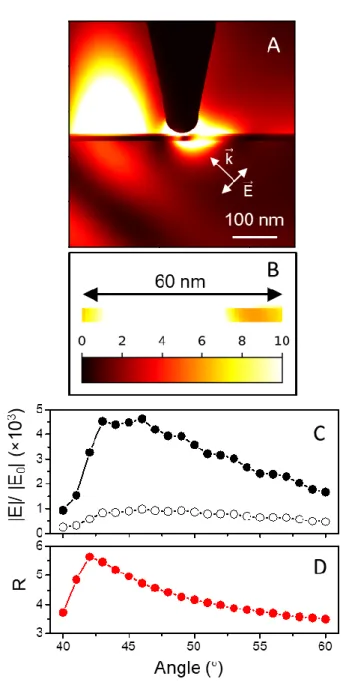
Performances of TIR-TERS. In order to optimize the intensity of the TERS signal by benefiting
especially from any potential gap mode,20 a noble metal tip must be placed a few nanometers
above the glass/Au/MUA/Cc multilayer sample, where the Cc coating is limited to a monolayer
(or even a submonolayer). The distance between the tip end and the Au layer is then ~6 nm,
owing to the ~5 nm MUA/Cc layer and the 1 nm tip-surface distance. Experimental
Ag(30nm)/Au(5nm) silicon tips are modelled by Ag tips showing a LSPR at 561 nm, as observed
in practice.18 FDTD simulations then reveal the occurrence of several phenomena (Figure 3).
Under p-polarized light excitation in TIR configuration (bottom-right side in Figure 3A), the
high intensity of the electromagnetic field on the left side of the tip originates from the surface
plasmon enhanced drag effect induced by the incident electric field (Figure 3A).21 In addition, a
significant electric field enhancement is generated in the 60nm-broad portion of the MUA/Cc
molecular layer below the tip end, which highlights the interest of TIR-TERS (Figure 3A and
3B). The highest value of the average electromagnetic enhancement induced by the Ag tip
(|E|/|E0|~5.64) is indeed obtained for a 42° incidence angle (Figures 3C and 3D), and corresponds
to a total electromagnetic enhancement of (|E|/|E0|)4~1.01×103. This 42° angle is very close to the
41° experimental critical angle. At that 42° value, a 250nm-long portion of the Ag tip should be
excited by the evanescent field (Figure S6). The resulting lightning-rod effect should thus be
increased with respect to the one arising from TIR excitations at wider incidence angles, for
42° in TIR configuration. This promising property is highly advantageous for TERS. As the laser
power density is ~560 times lower for TIR irradiation than for classical direct illumination (see
SI for deeper explanation), the far-field contribution is strongly reduced in TIR and can even be
undetectable, as it is the case for the present glass/Au/MUA/Cc multilayer sample (vide infra).
This low fluence avoids any degradation of light sensitive molecules, such as Cc that has to be
resonantly excited. Regarding the TERS (near-field) signal however, this fluence is at least partly
compensated by the significant enhancement of the electric field allowing for intense enough
Figure 3. A) FDTD spatial distribution of the electric field magnitude |E|/|E0| when a silver tip is
positioned 1 nm above a 5 nm-thick molecular layer deposited on a 10 nm-thick Au layer, for a
561 nm light excitation in TIR (with a 46° incidence angle). Directions of k⃗ and E⃗⃗ associated with the incident p-polarized light excitation are indicated. B) Electric field magnitudes in a 60
nm-broad portion of the molecular layer for TIR light excitation. C) Variation of the |E|/|E0|
the presence (full circles) and in the absence (open circles) of Ag tip. D) Ratio R=(|E|/|E0|)tip
engaged/(|E|/|E0|)tip withdrawn as a function of the incidence angle calculated from data plotted in C.
TIR-TERS characterization of Cc. On the experimental standpoint, the maximal TERS signal is
found just above the 41° critical angle (~42°), in excellent agreement with FDTD calculations.
Figure 4A presents five TIR-TERS spectra obtained with different TERS probes. The first
striking difference from one spectrum to another relates to relative intensities of TERS bands.
This is a common behavior in TERS due in particular to the nanoscale confinement of the
electromagnetic field at the tip apex and the imperfect homogeneity of the sample.19 Indeed, the
lateral spatial resolution is better than 10 nm using our metallized TERS probes, irrespective of
the curvature radius of the TERS tip apex.18,19 This relatively constant value suggests that the
size of TERS-active nanoparticles at the tip apex remains similar. However, depending on the
nanoparticle shape, different TERS signatures may appear owing to the sensitivity of the TERS
signal to the polarization of the excitation light and the orientation of molecular vibration modes.
Furthermore, the spatial resolution is larger than the size of a single Cc molecule and the Cc
coverage on the MUA SAM is slightly submonolayer. Thus, the contribution of MUA and Cc
molecules in TERS spectra may differ depending of the position of the TERS tip on the sample.
The resulting intensity fluctuations are also consistent with the distinct relative intensities
observed in TERS spectra reported in the literature for Cc.12-14 Despite this drawback, the 15, 4,
3, 2 and 10 vibration modes can be discerned in most TERS spectra (Figure 4B, Tables S1 and
S2 in SI). TERS wavenumbers of these Cc marker bands are very close to their SERS
counterparts (751±4 cm-1, 1375±3 cm-1, 1497±4 cm-1, 1588±3 cm-1 and 1632±2 cm-1 instead of
751 cm-1, 1372 cm-1, 1505 cm-1, 1584 cm-1 and 1636 cm-1 for 15, 4, 3, 2 and 10 vibration
-1, 1180±7 cm-1,1238±3 cm-1 and 1404±4 cm-1 assigned to
31, 30, 13 and 20 heme vibration
modes respectively, also emerge in several TERS spectra. A few TERS bands below 700 cm-1, at
~861 cm-1, ~1356 cm-1 and ~1482 cm-1 are not discerned in Raman and SERS spectra. They are
ascribed to amino acid residues, and especially to Tyr vibrations modes (Tables S1 and S2), that
can be efficiently probed in TERS.1,12 All the other TERS bands can be attributed to vibrations of
MUA molecules (Tables S1 and S2). Figure 4 thus demonstrates that SERS and TERS spectra of
Cc in its 6cLS state are consistent to each other, and confirm the often admitted law that SERS
vibration modes can be considered as good references to assign TERS bands of biomolecules.
Finally, this study also reveals the possibility to specifically identify the 6cLS ferric state of Cc
from other states with the nanoscale spatial resolution of TERS and the low-fluence excitation in
Figure 4. A) TIR-TERS spectra of a glass/Au/MUA/Cc sample obtained by using different
metal-coated tapping-mode AFM tips, for an incidence angle just above the critical angle.
Dashed lines are guides for the eye that indicates the position of 15, 4, 3, 2 and 10 vibration
modes. B) Variation of the Raman shifts associated with 15 (full squares), 4 (open triangles), 3
(full triangles), 2 (open circles) and 10 (full circles) vibration modes for the five spectra plotted
in A.
In summary, we have demonstrated that performing TERS in TIR configuration is an efficient
way to probe biomolecules with minimal incident laser power densities to avoid any sample
degradation. In the case of Cc, the native 6cLS form could be nicely characterized and its
spectral signature appeared to closely match that found in TIR-SERS experiments, performed for
the first time on a biomolecule as well. Our results thus suggest that 6cLS species of Cc,
potentially implicated in the apoptotic processes, could be detected on oxidized lipid membranes
with nanoscale spatial resolution. Finally, as TIR-SERS has been recently proven to be a
particularly promising technique for investigations in liquid medium,22 the next challenge would
be to develop the TIR-TERS technology for studies in this biologically relevant environment.
ASSOCIATED CONTENT
Supporting Information.
The following files are available free of charge.
Experimental and theoretical details, Interactions between Cc and thiol SAMs linked to electron
transfer, resonance SERS spectra of Cc deposited on mixed MUA/undecanethiol (UT) SAMs,
layers, Conventional Raman measurements in TIR geometry under p-polarized and s-polarized
light excitations, Calculation of the power density in TIR and classical Raman configurations,
Near-field nature of the excitation of the TERS probe showing the spatial extent of the
evanescent field as a function of the incidence angle, Comparison of TIR-Raman, TIR-SERS and
TIR-TERS vibration modes. (PDF)
AUTHOR INFORMATION Corresponding author *Email: sebastien.bonhommeau@u-bordeaux.fr ORCID Sébastien Bonhommeau: 0000-0002-9213-7201 Sophie Lecomte 0000-0001-8310-4849 Notes
The authors declare no competing financial interests.
ACKNOWLEDGMENT
This study has been carried out with financial support from the French State, managed by the French National Research Agency (ANR) in the frame of “the Investments for the future”
Programme IdEx Bordeaux – ANR-10-IDEX-03-02. All the Raman, SERS and TERS
measurements were performed at the platform SIV (Spectroscopie et Imagerie Vibrationnelle) at
the University of Bordeaux, funded by the European Union (FEDER) and the Nouvelle
Aquitaine region.
(1) Bonhommeau, S.; Lecomte, S. Tip-Enhanced Raman Spectroscopy: a Tool for Nanoscale Chemical and Structural Characterization of Biomolecules. ChemPhysChem 2018, 19, 8-18.
(2) Heilman , A.L.; Gordon, M.J. Tip-Enhanced Near-Field Optical Microscope with Side-on and ATR-mode sample excitation for super-resolution Raman imaging of surfaces. J.
Appl. Phys. 2016, 119, 223113.
(3) Fedurco, M. Redox Reactions of Heme-Containing Metalloproteins: Dynamic Effects of Self-Assembled Monolayers on Thermodynamics and Kinetics of Cytochrome C
Electron-Transfer reactions. Coord. Chem. Rev. 2000, 209, 263-331.
(4) Green, D.R. Apoptotic Pathways: the Roads to Ruin. Cell 1998, 94, 695-698.
(5) Hengartner, M.O. The Biochemistry of Apoptosis. Nature 2000, 407, 770-776.
(6) Oellerich, S.; Wackerbarth, H.; Hildebrandt, P. Spectroscopic Characterization of Nonnative Conformational States of Cytochrome C. J. Phys. Chem. B 2002, 106, 6566-6580.
(7) Murgida, D.H.; Hildebrandt, P. Proton-Coupled Electron Transfer of Cytochrome C. J.
Am. Chem. Soc. 2001, 123, 4062-4068.
(8) Murgida, D.H.; Hildebrandt, P.; Wei, J.; He, Y.-F.; Liu, H.; Waldeck, D.H. Surface-Enhanced Resonance Raman Spectroscopic and Electrochemical Study of Cytochrome C Bound on Electrodes through Coordination with Pyridinyl-Terminated Self-Assembled Monolayers. J. Phys. Chem. B 2004, 108, 2261-2269.
(9) Lecomte, S.; Hildebrandt, P., Soulimane, T. Dynamics of the Heterogeneous Electron-Transfer reaction of Cytochrome C552 from Thermus thermophilus. A Time-Resolved Surface-Enhanced resonance Raman Spectroscopic Study. J. Phys. Chem. B 1999, 103, 10053-10064.
(10) Hobara, D.; Niki, K.; Zhou, C.; Chumanov, G.; Cotton, T.M. Characterization of Cytochrome C Immobilized on Modified Silver and Gold Electrodes by
Surface-Enhanced Raman Spectroscopy. Colloid Surf A 1994, 93, 241-250.
(11) Xu, L.-J.; Zong, C.; Zheng, X.-S.; Hu, P.; Feng, J.M.; Ren, B. Label Free Detection of Native Proteins by Surface-Enhanced Raman Spectroscopy Using Iodide-Modified Nanoparticles. Anal. Chem. 2018, 86, 2238-2245.
(12) Yeo, B.-S.; Mädler, S.; Schmid, T.; Zhang, W.; Zenobi, R. Tip-Enhanced Raman Spectroscopy Can See More: The Case of Cytochrome C. J. Phys. Chem. C 2008, 112, 4867-4873.
(13) Tanabe, I.; Egashira, M.; Suzuki, T.; Goto, T.; Ozaki, Y. Prevention of Photooxidation of Deoxymyoglobin and Reduced Cytochrome C during Enhanced Raman Measurements: SERRS with Thiol-Protected Ag nanoparticles and a TERS Technique. J. Phys. Chem. C 2014, 118, 10329-10334.
(14) Böhme, R.; Mkandawire, M.; Krause-Buchholz, U.; Rösch, P.; Rödel, G.; Popp, J.; Deckert, V. Characterizing Cytochrome C States – TERS Studies of Whole
Mitochondria. Chem. Commun. 2011, 47, 11453-11455.
(15) Socrates, G. Infrared and Raman Characteristic Group Frequencies: Tables and
Charts; John Wiley & Sons Ltd.: Chichester, 2001.
(16) Runge, A.F.; Rasmussen, N.C.; Saavedra, S.S.; Mendes, S.B. Determination of Anisotropic Optical Constants and Surface Coverage of Molecular Films Using Polarized Visible ATR Spectroscopy. Application to Adsorbed Cytochrome c Films. J. Phys.
Chem. B 2005, 109, 424-431.
(17) Dadafarin, H.; Konkov E.; Omanovic, S. Electrochemical Functionalization of a 316L Stainless Steel Surface with a 11-mercaptoundecanoic Acid Monolayer: Stability Studies. Int. J. Electrochem. Sci. 2013, 8, 369-389.
(18) Najjar, S.; Talaga, D.; Schué, L.; Coffinier, Y.; Szunerits, S.; Boukherroub, R.; Servant, L.; Rodriguez, V.; Bonhommeau, S. Tip-Enhanced Raman Spectroscopy of Combed Double-Stranded DNA Bundles. J. Phys. Chem. C 2014, 118, 1174-1181.
(19) Talaga, D.; Smeralda, W.; Lescos, L.; Hunel, J.; Lepejova-Caudy, N.; Cullin, C.; Bonhommeau, S.; Lecomte, S. PIP2 Phospholipid-Induced Aggregation of Tau Filaments
Probed by Tip-Enhanced Raman Spectroscopy. Angew. Chem. Int. Ed. 2018, 57, 15738-15742.
(20) Stadler, J.; Oswald, B.; Schmid, T.; Zenobi, R. Characterizing Unusual Metal Substrates for Gap-Mode Tip-Enhanced Raman Spectroscopy. J. Raman Spectrosc. 2013,
44, 227-233.
(21) Vengurlekar, A.S.; Ishihara, T. Surface plasmon enhanced photon drag in metal films. Appl. Phys. Lett. 2005, 87, 091118.
(22) Plissonneau, M.; Madeira, A.; Talaga, D.; Bonhommeau, S.; Servant, L.; Vallée, R.A.L.; Labrugère, C.; Goldthorpe, I.A.; Pautrot-D’Alencon, L.; Lemercier, T.; Treguer-Delapierre, M. Efficient Passivation of Ag Nanowires with 11-Mercaptoundecanoic Acid Probed Using In Situ Total-Internal-Reflection Surface-Enhanced Raman Scattering Spectroscopy. ChemNanoMat 2019, 5, 1044-1049.