Penalty Shaper to Enforce Assured Service for TCP Flows
Emmanuel Lochin 1 , Pascal Anelli 2 , and Serge Fdida 1
1 LIP6 - Universit´e Paris 6, 2 IREMIA - Universit´e de la R´eunion, France {emmanuel.lochin, serge.fdida}@lip6.fr, [email protected]
Abstract. Many studies have explored the TCP throughput problem in DiffServ networks. Several new marking schemes have been proposed in order to solve this problem. Even if these marking schemes give good results in the case of per-flow conditioning, they need complex measure- ments. In this paper we propose a Penalty Shaper (PS) which is able to profile a set of TCP flows so as to improve its conformance to a de- sired target. The main novelty of this shaper is that the shaping applies a penalty delay which depends on the out-profile losses in a DiffServ network. This penalty shaping can be used with any classic conditioner such as a token bucket marker (TBM) or a time sliding window marker (TSWM). We made an evaluation of the Penalty Shaper on a real testbed and showed that the proposed scheme is easily deployable and allows for a set of TCP flows to achieve its target rate.
Key words: Edge to Edge QoS, Assured Service, TCP.
1 Introduction
The Differentiated Services architecture [1] proposes a scalable means to deliver IP Quality of Service (QoS) based on handling of traffic aggregates. This archi- tecture advocates packet tagging at the edge and lightweight forwarding routers in the core. Core devices perform only differentiated aggregate treatment based on the marking set by the edge devices. Edge devices in this architecture are responsibles for ensuring that user traffic conforms to traffic profiles. The ser- vice called Assured Service (AS) built on top of the AF PHB is designed for elastic flows. The minimum assured throughput is given according to a nego- tiated profile with the user. Such traffic is generated by adaptive applications.
The throughput increases as long as there are available resources and decreases
when a congestion occurs. The throughput of these flows in the assured service
breaks up into two parts. First, a fixed part that corresponds to a minimum
assured throughput. The packets of this part are marked like inadequate for loss
(colored green or marked IN). Second, an elastic part which corresponds to an
opportunist flow of packets (colored red or marked OUT). These packets are
conveyed by the network on the principle of ”best-effort” (BE). In the event of
congestion, they will be dropped first. Thanks to an Penalty Shaper, we show
that it is possible to provide service differentiation between two source domains, on a set of TCP flows, based on its marking profile. In this paper we evaluate the solution with long-lived TCP flows. The proposed solution provides the advan- tage of neither needing RTT(Round Trip Time) evaluation nor loss probability estimation. The solution takes care of the behavior of TCP flows only. Conse- quently, as it is easily deployable, it has been experimented on a real testbed.
This paper is organized as follows. Section 2 presents related work. In section 2.1 we present the algorithm. Testbed and scenarios are presented in section 3. Section 4 presents the results obtained and their analysis. Finally, section 5 concludes the paper.
2 Related work
There have been a number of studies that focused on assured service for TCP flows but also on the aggregate TCP performance. In [2], five factors have been studied (RTT, number of flows, target rate, packet size, non responsive flows) and their impact has been evaluated in providing a predictable service for TCP flows.
In an over-provisioned network, target rates are achieved regardless of these five factors. This result is corroborated by [3]. However the distribution of the excess bandwidth depends on these five factors. When responsive TCP flows and non- responsive UDP flows share the same class of service, there is unfair bandwidth distribution and TCP flow throughputs are affected. The fair allocation of excess bandwidth can be achieved by giving different treatment to out-of-profile traffic of two types of flows [3]. Recently [4] demonstrates the unfair allocation of out- of-profile traffic and concludes that the aggregate that has the smaller/larger target rate occupies more/less bandwidth than its fair-share regardless of the subscription level. In [5], a fair allocation of excess bandwidth has been proposed based on a traffic conditioner. The behavior of the traffic conditioner has a great impact on the service level, in terms of bandwidth, obtained by TCP flows.
Several markers have been proposed to improve throughput insurance [6–9].
These algorithms propose to mark aggressive TCP flows severely out-of-profile so that they are preferentially dropped. Even if these marking strategies work well in simulation, their main disadvantage is their implementation complexity.
Indeed, these algorithms need to measure a flow’s RTT, its loss probability, have a per-state information of the flows or require a complex signaling algorithm.
2.1 The Penalty Shaper (PS)
Let r(i) AS be the assured rate of the flow i (i.e. in-profile packets throughput), n the number of AS TCP flows in the aggregate at the bottleneck level and C the link capacity. Precisely, this capacity corresponds to a bottleneck link in the network. If a number of i flows cross this link, the total capacity allocated for assured service R AS is : P n
i=1 r(i) AS . Let C AS be the resource allocated to the assured service.
R AS < C AS (1)
Throughput
RTT Target Rate
(a)
RTT A
B Target Rate Throughput
(b)
Target Rate Throughput
RTT
(c)
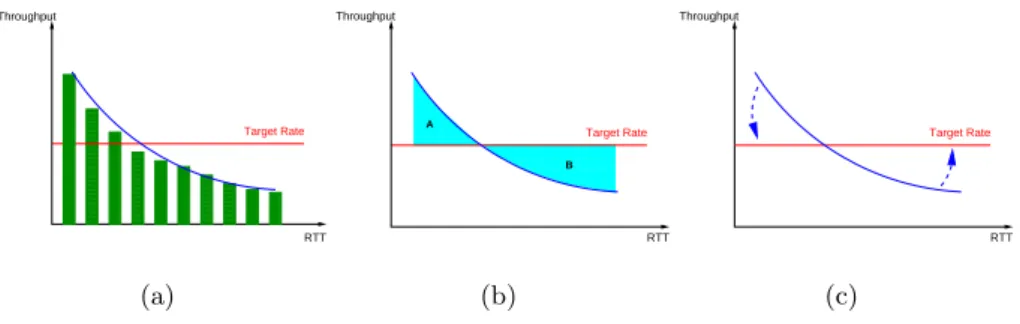
Fig. 1. TCP throughput of 10 TCP flows in function of the RTT
Equation (1) means an under-subscription network. In this case, there is ex- cess bandwidth in the network. If R AS > C AS , this is an over-subscription network and there is no excess bandwidth. This configuration is the worst case for the AS. This service must provide an assurance until the over-subscription case is reached. Afterwards, not enough resources are available and the service is downgraded.
TCP Throughput = C ∗ Maximum Segment Size
RT T ∗ √ p (2)
The preferential dropping taking place at the core routers provides a good indication of the state of congestion. If the network is far from being congested, the in-profile packets will rarely be dropped and their dropping probability will be insignificant. If the network is going to be congested, almost all of the out- profile packets will be dropped. In a well-dimensioned network, inequity from (1) should be respected. When there are losses in the network, it corresponds to the losses of out-profile packets, and not in-profile packets. It means that a light congestion appears in the network and some out-profile packets must be dropped. In order to increase the loss probability of the opportunist flows, new conditioners presented in section 2 are based on increasing the out-profile part of the most aggressive traffic. Then, the loss probability raises and the TCP throughput of the opportunist traffic decreases. It’s a logical behaviour because the latter has a reject probability higher than the non-opportunist traffic. [10]
gives a model of TCP throughput represented by the equation (2). With C a constant and p the loss probability. Changing the p value from the equation (2) thanks to a marking strategy is complex. Indeed, it is necessary to evaluate the loss probability of the network and estimate an RTT for each flow. In order to illustrate this point, figure 1 presents the principle of these marking strategies.
Figure 1 (a) symbolizes the throughput obtained by ten flows with different
RTTs. The smaller the RTT, the higher is the throughput. The flows with a
small RTT occupies more bandwidth than necessary as shown by area A in figure
1 (b). The aim of a marking strategy is to distribute fairly excess bandwidth
from area A to area B. As a result, it corresponds to rotate the curve on figure 1 (c). As opposed to the marking strategy adopted by new conditioners, we propose a delay based shaper. This shaper applies a delay penalty to a flow if there are out-profile packets losses in the network and if it outperforms its target rate. The basic idea is that the penalty is a function of the out-profile packet losses. Instead of raising the p value, from equation (2), of the most opportunist flow, the Penalty Shaper raises a delay penalty to the flow. It results in a growth of the RTT. Mathematically, as shown in equation (2), increasing RT T value is similar to increasing p value in term of TCP throughput. [11] has shown that limiting out-profile packets is a good policy to achieve a target rate and a good solution to avoid TCP throughput fluctuations. Indeed, by avoiding packets dropping we avoid TCP retransmission. This is an efficient solution to optimize the bandwidth usage. That’s the reason why we choose to operate on the raise of the RT T value instead of the raise of the p value. Moreover, we don’t need complex measurements. Our goal is to reduce out-profile losses by applying a delay penalty to the flows that are the most opportunist in the network. Therefore, when a RIO 1 [12] router in the core network is dropping out-profile packets, it marks the ECN flag [13] of the in-profile packets enqueued in the RIO queue. In a well-dimensioned network, there is no in-profile packet loss. Then, the edge device can be aware that there is a minimum of one flow or set of flows which are opportunists in the network. This opportunist traffic is crossing the same path. The edge device evaluates its sending rate thanks to a Time Sliding Window (TSW) algorithm [14]. If its sending rate is higher than its target rate, it considers that its traffic may be opportunist. Then, it applies a penalty to the incoming traffic while the network feedback that there are out- profile packets losses. This penalty allows a raise of the RTT and consequently, decrease the TCP throughput. The algorithm presented in figure 2 explains how the penalty is calculated and applied. As explained on figure 4, once incoming TCP traffic is shaped, it passes through a marker such as a TBM. The PS mechanism could be placed on the client side rather than on the edge router.
There isn’t hypothesis on its localization. The PS is just used to enforce desired target rate and not used for marking traffic. In our simulation, the edge router uses a token bucket marker mechanism in order to mark in-profile and out-profile packets. Concerning the flows, traffic profile consists of a minimum throughput, characterized by two token bucket parameters, namely the token rate r and the size of the bucket b. The conformity control of an aggregate compared to the profile is thus done naturally by a token bucket as proposed in [15]. Figure 4 illustrates the ingress edge router mechanism.
The way TCP flows are conditioned by a marking strategy at the DiffServ network influences the drop probability of these TCP flows and consequently their behavior in the core network. Moreover, it is necessary to define a scal- able conditioning in order to give an ISP 2 an exploitable solution. Many are the conditioners presented in section 2 which will never leave the framework of
1 RED with IN and OUT
2 Internet Service Provider
K = 10 ms T = 1 sec
FOR each observation period T
TSW gives an evaluation of the throughput : throughput_measured IF throughput_measured < target_rate OR there are no out-profile losses THEN reduce the penalty delay
current_penalty = current_penalty - K ELSE raise the penalty delay
current_penalty = current_penalty + K END IF
END FOR
Fig. 2. PS algorithm
D C
2 Mbits/s profile 4 Mbits/s profile Edge router
B A
Core network
Fig. 3. Traffic conditioning sample
δ δ
TCP ACKs (give network feedback) ACK ECN marked signals congestion network Time sliding window
Time sliding window
ACK ACK ECN marked packet δ : delay penalty gives throughput metering
throughput metering
Penalty shaper Token bucket marker
Incoming traffic
Fig. 4. Ingress edge router mechanism
simulation because of their conditioning constraints. In order to avoid confusion with the aggregate principle defined in [1], in the remainder of this paper, we call TCP client aggregates a set of TCP flows emitted from one source to one desti- nation. These aggregates can have one or several TCP flows. We chose to make the traffic conditioning in the following way : each client emitting one or more flows towards one or more destinations will have one traffic profile per destina- tion. As shown on figure 3, client A forces the edge router to setup three different traffic conditioners. Two conditioners with a profile rate of 4M bits/s and one conditioner with a profile rate of 2M bits/s. The main advantage of this solution is that the conditioning can be made on flows with similar RTTs (i.e. in the same order of magnitude). This solution doesn’t depend on the complex problem of RTT estimation necessary to the functioning of the conditioners presented in section 2. The solution of traffic shaping coupled to a conditioner/marker such as the TBM should be easily deployable and scalable.
3 Experimental testbed
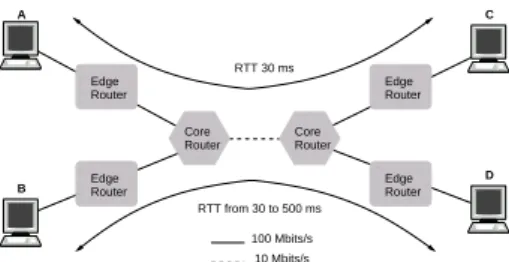
As shown in figure 5, we use the well-known dumbbell topology. This topology
was used in many experimentations [7, 11, 16–18]. The choice of this platform can
appear simple, but it characterizes any router being in a core network. Whether
RTT from 30 to 500 ms
10 Mbits/s
100 Mbits/s
RTT 30 ms
C A
D B