HAL Id: hal-02640334
https://hal.archives-ouvertes.fr/hal-02640334
Submitted on 28 May 2020HAL is a multi-disciplinary open access archive for the deposit and dissemination of sci-entific research documents, whether they are pub-lished or not. The documents may come from teaching and research institutions in France or abroad, or from public or private research centers.
L’archive ouverte pluridisciplinaire HAL, est destinée au dépôt et à la diffusion de documents scientifiques de niveau recherche, publiés ou non, émanant des établissements d’enseignement et de recherche français ou étrangers, des laboratoires publics ou privés.
Ariadna Purroy, Mirjana Najdek, Enrique Isla, Ivan Zupan, Julien Thébault,
Melita Peharda
To cite this version:
Ariadna Purroy, Mirjana Najdek, Enrique Isla, Ivan Zupan, Julien Thébault, et al.. Bivalve trophic ecology in the Mediterranean: Spatio-temporal variations and feeding behavior. Marine Environmen-tal Research, Elsevier, 2018, 142, pp.234-249. �10.1016/j.marenvres.2018.10.011�. �hal-02640334�
Please note that this is an author-produced PDF of an article accepted for publication following peer review. The definitive publisher-authenticated version is available on the publisher Web site.
November 2018, Volume 142, Pages 234-249
https://doi.org/10.1016/j.marenvres.2018.10.011 https://archimer.ifremer.fr/doc/00463/57478/
https://archimer.ifremer.fr
Bivalve trophic ecology in the Mediterranean:
Spatio-temporal variations and feeding behavior
Purroy Ariadna 1, *, Najdek Mirjana 2, Isla Enrique 3, Župan Ivan 4, Thébault Julien 5, Peharda Melita 1
1 Institute of Oceanography and Fisheries, Šetalište Ivana Meštrovića 63, 21000, Split, Croatia 2 Institute Ruđer Bošković, Center for Marine Research, 52210, Rovinj, Croatia
3
Institut de Ciències del Mar-CSIC, Passeig Marítim de la Barceloneta 37-49, 08003, Barcelona, Spain
4 Department of Ecology, Agronomy and Aquaculture, University of Zadar, Trg Kneza Višeslava 9,
23000 Zadar, Croatia
5
Université de Brest, Institut Universitaire Européen de la Mer, Laboratoire des sciences de l'environnement marin (LEMAR UMR6539 CNRS/UBO/IRD/Ifremer), 29280 Plouzané, France * Corresponding author : Ariadna Purroy, email address : ariadna.purroy@gmail.com
Abstract :
The trophic ecology of two bivalves, the clam Callista chione and the cockle Glycymeris bimaculata was studied using environmental and biochemical variables of the suspended particulate matter and the sediment. Samples were collected from two shallow sites, Pag and Cetina, in the coastal oligotrophic Mediterranean Sea, during a 17 month period.
The temporal variation of the particulate matter reflected a mixture between marine and terrestrial sources throughout the year, with a clear marine influence during summer and fall, and predominance of terrestrial inputs during spring and winter. The digestive gland was a useful rapid turnover tissue, where the carbon isotope signal was species-specific and the nitrogen isotope one was site-specific. FA markers in the digestive gland revealed a mixed diet where Callista chione fed more upon fresh material than G. bimaculata which relied largely on bacteria-derived detritus.
Overall, little feeding niche overlap was observed between the two species during the year, indicating resource partitioning, expected for a food-limited system. The present trophic ecology study in co-occurring species allowed identifying species-specific feeding adaptations to environmental variability.
Highlights
► Particulate matter biochemical proxies show terrestrial inputs in the Adriatic Sea. ► POM quality in the shallow oligotrophic Adriatic Sea is best in spring and summer. ► Digestive gland is a useful rapid turnover tissue. ► Bivalve species show feeding adaptations to environmental variation. ► Bacterial diazotroph biomass has major importance in G. bimaculata diet. ► Feeding niche overlap between species is low, indicating resource partitioning.
Keywords : Feeding ecology, Bivalves, Suspension feeder, Biochemical variables, Stable isotopes, Fatty
M
AN
US
CR
IP
T
AC
CE
PT
ED
1 Bivalve trophic ecology in the Mediterranean: spatio-temporal variations and feeding behavior 1Ariadna Purroy1*, Mirjana Najdek2, Enrique Isla3, Ivan Župan4, Julien Thébault5, Melita Peharda1
2
1Institute of Oceanography and Fisheries, Šetalište Ivana Meštrovića 63, 21000 Split, Croatia 3
2Institute Ruđer Bošković, Center for Marine Research, 52210 Rovinj, Croatia 4
3Institut de Ciències del Mar-CSIC, Passeig Marítim de la Barceloneta 37-49, 08003 Barcelona, Spain 5
4Department of Ecology, Agronomy and Aquaculture, University of Zadar, Trg Kneza Višeslava 9, 23000 Zadar, Croatia 6
5Université de Brest, Institut Universitaire Européen de la Mer, Laboratoire des sciences de l'environnement marin 7
(LEMAR UMR6539 CNRS/UBO/IRD/Ifremer), 29280 Plouzané, France 8
*
Corresponding author. E-mail: ariadna.purroy@gmail.com
9 10
ABSTRACT 11
The trophic ecology of two bivalves, the clam Callista chione and the cockle Glycymeris bimaculata 12
was studied using environmental and biochemical variables of the suspended particulate matter 13
and the sediment. Samples were collected from two shallow sites, Pag and Cetina, in the coastal 14
oligotrophic Mediterranean Sea, during a 17 month period. 15
The temporal variation of the particulate matter reflected a mixture between marine and 16
terrestrial sources throughout the year, with a clear marine influence during summer and fall, and 17
predominance of terrestrial inputs during spring and winter. The digestive gland was a useful rapid 18
turnover tissue, where the carbon isotope signal was species-specific and the nitrogen isotope one 19
was site-specific. FA markers in the digestive gland revealed a mixed diet where Callista chione fed 20
more upon fresh material than G. bimaculata which relied largely on bacteria-derived detritus. 21
Overall, little feeding niche overlap was observed between the two species during the year, 22
indicating resource partitioning, expected for a food-limited system. The present trophic ecology 23
study in co-occurring species allowed identifying species-specific feeding adaptations to 24
environmental variability. 25
26
Keywords: feeding ecology; bivalves; suspension feeder; biochemical variables; stable isotopes; 27
fatty acids; Adriatic Sea; niche partitioning; coastal ecosystems 28
29
1. INTRODUCTION 30
Coastal systems represent 8.5% of marine biomes and their related physical, chemical and 31
biological processes are modulated by terrestrial influence (Costanza et al., 1997). In these 32
systems, a mixture of organic particles from autochthonous and allochthonous origin contribute to 33
the pool of particulate organic matter (POM) (Bode et al., 2006; Hedges et al., 1997; Savoye et al., 34
M
AN
US
CR
IP
T
AC
CE
PT
ED
2 2012). In temperate areas, benthic consumers are able to shift their diets along the year adapting 35to the available suspended material, e.g. following the magnitude and seasonality of primary 36
production (Antonio et al., 2010). Bivalves, as suspension-feeding organisms, participate in the 37
transfer of POM between the water column and the surface sediment layer (Schubert and Calvert, 38
2001). In the sediment-water interface, physical factors (e.g. currents, wind) and bioturbation 39
enhance resuspension enabling a continuous supply of POM to suspension feeding organisms 40
(Dubois et al., 2014; Orvain et al., 2012). Bivalves mainly feed upon phytoplankton but other 41
sources such as detritus, bacteria, microphytobenthos and zooplankton can also constitute an 42
important component of their diet (Davenport et al., 2000; Ezgeta-Balić et al., 2012; Grall et al., 43
2006; Kharlamenko et al., 2011; Peharda et al., 2012). The chemical characteristics of POM both in 44
the pelagic and benthic compartments are tightly coupled to filter feeding activity, e.g. there is a 45
positive feedback between phytoplankton abundance in the water column and the bivalve grazing 46
activity (Charles et al., 1999; Page and Lastra, 2003; Prins et al., 1997; Ward and Shumway, 2004). 47
Thus, investigating the origin and availability of food resources in POM in relation to their 48
contribution to bivalve’s diet allow to distinguish variations in the trophic activity, selective 49
feeding, inter or intra-specific competition, and biogeochemical functioning of the ecosystem 50
(Carlier et al., 2007; Dubois et al., 2014; Riera and Richard, 1996). 51
52
In aquatic ecosystems, stable isotope analyses (SI), e.g. δ13C and δ15N, and fatty acid (FA)
53
concentrations have been used to analyze the food web structure and infer trophic relationships 54
(e.g. Antonio and Richoux, 2016; Giraldo et al., 2016; Kharlamenko et al., 2008, 2011; Pérez et al., 55
2013). SI analyses have been widely used to describe diet composition, trophic level and habitat 56
characteristics in marine organisms (DeNiro and Epstein, 1978; Lopez et al., 2016; Lorrain et al., 57
2002; Peterson and Fry, 1987) due to a time-integrated signal of the food sources, assimilated in 58
animal tissues (Ezgeta-Balić et al., 2014; Martínez del Rio et al., 2009; Peterson and Fry, 1987). The 59
measurement of δ13C allows the identification of the main primary producers (Post, 2002) and also
60
discriminates sources from both terrestrial and marine, and benthic and pelagic systems (e.g. 61
Cloern et al., 2002; Savoye et al., 2003). On the other hand, the δ15N signature is useful to identify 62
food chain structure, based on the principle that excretion and respiration of lighter N isotopes by 63
consumers increase the δ15N content in their tissues (Peterson and Fry, 1987). FA are involved in 64
the organism’s energy storage (Parrish et al., 2000) and are effective tracers of food sources, since 65
M
AN
US
CR
IP
T
AC
CE
PT
ED
3 they remain mostly invariable along trophic pathways, and can be associated to different groups 66of organisms, such as primary producers or heterotrophs (e.g. Dalsgaard et al., 2003; Napolitano et 67
al., 1997). However, the higher the trophic level, the more complex is the interpretation of FA as 68
dietary indicators (Budge et al., 2002) due to the incorporation of multiple diet sources and 69
diverse metabolic pathways (Dalsgaard et al., 2003). Still, FA are good discriminators of food 70
sources in suspended POM and sediment (Bergamino et al., 2014; Connelly et al., 2016; El-Karim et 71
al., 2016; Ricardo et al., 2015) and also useful describing their seasonal and spatial variations 72
(Boon and Duineveld, 1996). Lipids play an important role as metabolic energy reserves; thus, FA 73
analyses in the digestive gland of bivalves have been employed to trace recent food ingestion 74
(weeks-months) (Deudero et al., 2009; Ezgeta-Balić et al., 2012; Najdek et al., 2013). 75
76
The study of fine-scale spatio-temporal patterns in environmental biochemical variations (e.g. SI, 77
FA) and in primary producers allow assessing the intra and interspecific variability in the diet of 78
secondary consumers which is essential for comprehensive ecological studies (Antonio et al., 2012; 79
Gonçalves et al., 2012; Underwood et al., 2000; Ventrella et al., 2008; Yurkowski et al., 2016). 80
Likewise, other biomarkers characterizing the composition of suspended particulate matter (SPM) 81
in coastal ecosystems such as C:N ratios and Chlorophyll a are often used as indicators of the 82
quality of biogenic matter. However, few studies incorporate the analysis of biogenic silica, which 83
is a major component in diatom biomass (Alomar et al., 2015; Leblanc et al., 2003; Ragueneau et 84
al., 2002). Therefore, an extended particulate matter characterization including environmental 85
variables (e.g., temperature, salinity) with the above mentioned biochemical parameters will lead 86
to more accurate interpretations of benthic trophic ecology. 87
88
The burrowing bivalves Glycymeris bimaculata (Poli, 1975) and Callista chione (Linnaeus, 1758) are 89
two common benthic suspension feeders inhabiting Atlantic and Mediterranean waters (Huber, 90
2010; Poppe and Goto, 1993). Callista chione is a commercialy important species in many parts of 91
the Mediterranean Sea (Galimany et al., 2015; Metaxatos, 2004; Tirado et al., 2002), which 92
demands a thorough knowledge on its general ecology. Both of these species have a relative long 93
life span of over 40 years (Bušelić et al., 2015; Ezgeta-Balić et al., 2011; Forster, 1981) making them 94
interesting targets for sclerochronological research that includes use of shell as archives of 95
environmental change (e.g. Butler and Schöne, 2017). Further on, they co-occur along the eastern 96
M
AN
US
CR
IP
T
AC
CE
PT
ED
4 Adriatic coast (Peharda et al., 2010) and show spatial variations in growth (Ezgeta-Balić et al., 972011; Kovačev, 2016) and timing and duration of their reproductive periods (Purroy, 2017). 98
Seawater properties in the shallow eastern coastal Adriatic are exposed to high temporal and 99
spatial variations mainly characterized by large temperature fluctuations and freshwater inputs 100
(e.g. Ogrinc et al., 2005; Surić et al., 2015). The intrusion of freshwater is more evident in river 101
mouth areas, where also the incorporation of nutrients and organic matter from terrestrial origin 102
stimulates biological productivity and creates a characteristic fluctuating environment. Likewise, in 103
this karst littoral the common groundwater discharge and coastal springs also influence the 104
marine environment (Bonacci, 2015; Bonacci et al., 1997; Surić et al., 2015). These conditions have 105
an ecological impact such as physiological stress, changes in biological responses and shifts in 106
community structure (Hamer et al., 2010). 107
108
Within this context, the aim of this study was to evaluate the trophic ecology of two co-occurring 109
suspension feeders in two different coastal settings influenced by freshwater inputs, based on a 110
multiple tracer approach. To address this, we (1) characterized two coastal settings to identify 111
relationships between environmental conditions with two main food sources: suspended 112
particulate matter (SPM) and sediment (Sed); and investigated (2) spatio-temporal variations 113
(hundreds of Km and months) in feeding patterns in bivalves using SPM and Sed and (3) trophic 114
interactions to identify whether feeding niche overlap between species occurs. This study 115
contributes to a better understanding of bivalve feeding mode adaptations to environmental 116
variability in oligotrophic settings. 117
118
2. MATERIAL AND METHODS 119
2.1. Study area and sample collection
120
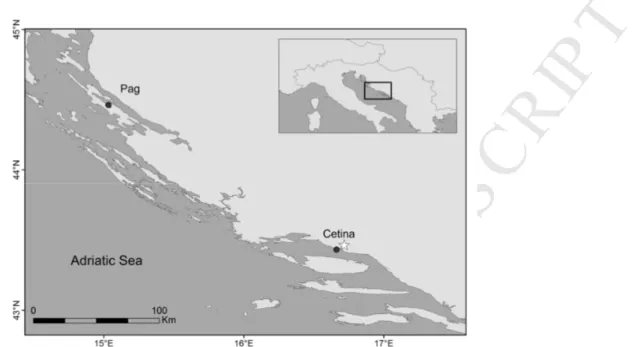
The study area is located on the Adriatic coast off central Croatia (Figure 1). Two sites were 121
selected based on earlier studies, which showed differences in environmental settings and in local 122
bivalve growth (Ezgeta-Balić et al., 2011).One study site was located inPag Bay off the island of 123
Pag (44˚ 27’42’’ N, 15˚01’36’’E) whereas the other site, Cetina (43˚26’13’’ N, 16˚41’14’’E), was 124
located close to the mouth of the Cetina River, situated on the main direction of the river plume. 125
Both study sites have karstic origin and are under the influence of submarine freshwater springs 126
(Surić, 2005). In these shallow coastal sites, samples were collected by SCUBA and skin diving 127
M
AN
US
CR
IP
T
AC
CE
PT
ED
5 within a range of 2 to 5 m water depth. Previous studies on the distribution of benthic species 128(Peharda et al., 2010) identified these sites with sufficient population abundances for conducting a 129
temporal collection design based on monthly samplings, ensuring collection of specimens 130
throughout the study period. 131
132
Fig 1. Sampling sites in the Croatian Adriatic Sea: Pag and Cetina. A star indicates the location of the Cetina
133
river. The black square in the inlet represents the study area.
134 135
Study was conducted between May 2014 and October 2015. Seawater temperature was recorded 136
hourly with a Tinytag data logger deployed in situ and salinity was monthly measured in situ with a 137
YSI-Pro probe. Twenty adult specimens of both Glycymeris bimaculata and Callista chione 138
(hereafter also referred as Gly and Cal, respectively), were collected monthly at each site, 139
measured for biometric analysis and processed within 3 hours by sectioning the muscle and 140
dissecting the digestive gland (DG) from each individual. The DG is a rapid turnover tissue enabling 141
the detection of isotopic signatures of recent ingestions (days to weeks) (e.g. Ezgeta-Balić et al., 142
2012). Analyses were carried out on three replicates, each of them constituted by a pool of tissues 143
from three specimens. Each sample was stored at -20°C for subsequent analysis. 144
145
2.2. Environmental variables and food sources
146
Seawater samples were collected ~0.5 m above the seafloor using a Niskin bottle (between 10-20 147
L) and vacuum filtered in the laboratory. Prior to filtration water containers were gently agitated 148
M
AN
US
CR
IP
T
AC
CE
PT
ED
6 to homogenize seawater and filters were rinsed with distilled water. Pre-weighed nitrocellulose 149filters (WhatmanTM, 47 mm diameter, 0.45 µm mesh size) were used to measure bulk suspended
150
particulate matter (SPM) and biogenic silica content (BSi) while pre-combusted (450°C, 6 h) and 151
pre-weighted glass fiber filters (WhatmanTM GF/F, 25 mm diameter, 0.7 µm mesh size) were used
152
to measure elemental composition and ratios of C (weight %) and N (weight %), and their isotopic 153
composition (δ13C and δ15N; see 2.3), fatty acids (FA) and lipid proportions (see 2.4). The
154
concentration of SPM was determined on the dry mass of the total suspended particles retained 155
per unit of volume after drying (60°C, 24 h) (expressed as mg/L). SPM filters were also used for BSi 156
content analysis following a sequential alkaline digestion (2 to 5 h) with NaCO3 to distinguish
157
between biogenic and lithogenic silica sources (DeMaster, 1991; Mortlock and Froelich, 1989). 158
Around 1 L of seawater per replicate was filtered for Chlorophyll a (Chl a) analyses through glass 159
fiber filters which were folded, wrapped in aluminum foil, frozen and stored at -20°C. Chl a was 160
extracted in 90 % acetone (Strickland and Parsons, 1972) and measured in a Turner Systems 161
(Sunnyvale, CA) fluorometer (Trilogy). Triplicate samples were conducted for all chemical analysis. 162
Additionally, satellite-derived Chl a data was extracted from the MODIS-Aqua Sensor provided by 163
the EU Copernicus Marine Service (CMEMS). 164
165
Surface sediment samples (ca. upper 2 cm) (Sed) were collected monthly by SCUBA diving using a 166
plastic core and preserved at -20°C. Homogenized and ground samples were used for %C, %N and 167
SI analyses (see 2.3), Chl a samples were extracted in 90% acetone (4°C, 12 h) (Lorenzen and 168
Jeffrey, 1978), BSi content was measured following the procedure for SPM, and total carbon (TC) 169
was measured in a LECO Truspec CN-2000 analyzer. Inorganic carbon (IC) (expressed in dry weight 170
%) was calculated by the difference between TC and OC content (see 2.3). To identify the effect of 171
grain size on the OC content, grain size was determined in a HORIBA LA950V2 laser scattering 172
particle size distribution analyzer after removal of organic matter in a 20% hydrogen peroxide 173
solution (Table 1). 174
175
2.3. Stable isotope analysis (SIA)
176
Particulate organic carbon and nitrogen elemental and isotopic compositions were measured in 177
filters dried at 50°C for 24 h, 50 mg of Sed and 1 mg of DG. Sed and DG were freeze-dried and 178
individually homogenized using an agate mortar and pestle. Aiming to remove carbonates, SPM 179
M
AN
US
CR
IP
T
AC
CE
PT
ED
7 filters and DG samples had a 6 h exposure to HCl fumes (Lorrain et al., 2003) while Sed samples 180were exposed to 24 h (due to the high content of carbonates) prior to isotopic analyses. Further, 181
to avoid effects of acidification in Sed (e.g. Walthert et al., 2010), non-acidified subsamples were 182
used for the analysis of δ15N. To eliminate residual HCl and water, all samples were ventilated
183
overnight at room temperature and dried in a hotplate (50°C, 6 h). Filters were folded and placed 184
into tin cups (12.5 mm x 5 mm) whereas Sed and DG samples were placed into tin cups wrapped 185
by silver cups to avoid losses due to tin corrosion (8 mm x 5 mm). Stable isotope ratios of carbon 186
(13C/12C) and nitrogen (15N/14N), and elemental %C and %N analyses were conducted on a Carlo 187
Erba Elemental Analyzer EA1108 coupled to an isotope-ratio mass spectrometer ThermoFinnigan 188
MAT253 in the Unidade de Técnicas Instrumentais de Investigación, University of A Coruña (Spain). 189
Results are expressed in standard unit notation (VPDB for the carbon and atmospheric air for the 190
nitrogen): δX = ([R sample / R standard] – 1) x 1000, where X represents 13C or 15N, and R is the
191
ratio of 13C/12C or 15N/14N, respectively. An acetanilide standard was used for the quantification of 192
the amounts of %N and %C. Isotopic data are given in the conventional delta notation in units of 193
parts per thousands (‰) with a resolution of ±0.15‰. Lipid content in tissues may affect δ13C
194
values, where high lipid concentrations result in depleted 13C biasing the isotopic signal (DeNiro
195
and Epstein, 1978; Focken and Becker, 1998). However, previous studies in bivalves did not find 196
this relationship (Ezgeta-Balić et al., 2014; Lorrain et al., 2002) therefore, lipid extraction was not 197
conducted in the present study. A two-source isotopic mixing model was used in MixSIAR package, 198
a graphical user interface (GUI) built on R software (Parnell et al., 2010), that uses an algorithm 199
based on Bayesian statistics to determine the probability distributions for proportional food 200
source contribution to the mix diet of consumers (Semmens et al., 2013). This model accounts for 201
uncertainty in isotopic values when estimating the contribution of sources in the diet due to the 202
incorporation of diet-tissue discrimination factors. Discrimination factors of 0.5±0.13‰ for δ13C
203
and 2.3±0.18‰ for δ15N considered for benthic consumers (Alomar et al., 2015; McCutchan et al., 204
2003) were incorporated into the model. Despite the increasing number of studies for prey-205
predator fractionation values, there are no species-specific values for our target species; 206
therefore, conventional fractionation values for benthic consumers can be applied, as supported 207
by Yokoyama et al., (2005). 208
209
2.4. Fatty acid analysis (FA)
M
AN
US
CR
IP
T
AC
CE
PT
ED
8 SPM, Sed and DG samples were collected monthly during one year period, kept frozen and freeze-211dried prior to biochemical analyses. For total lipid analysis all samples were weighted (DG samples 212
were blended) and after, a dichloromethane-methanol (DCM:MeOH) mixture (2:1) sonicated in a 213
water bath at 30°C was added. After separation DCM phases were pooled and evaporated to 214
dryness and weighed. Total lipids of digestive glands were re-dissolved in DCM and neutral lipids 215
were separated according to Pernet et al., (2012). All extracts (total lipids of SPM and Sed and 216
neutral lipids of DG were saponified (1.2 M NaOH), acidified (6M HCl) and methylated (14% BF3 in 217
methanol) then extracted in DCM. Fatty acid methyl esters (FAMEs) were analyzed by Agilent gas– 218
liquid chromatography (GLC) 6890 N GC System equipped with a 5973 Network Mass Selective 219
Detector, capillary column (25 m x 0.3 mm x 0.25 µm; cross-linked 5% phenylmethylsiloxane) and 220
ultra-high purity helium as the carrier gas. The GLC setting was programmed column temperature 221
rise from 145°C by 4°C min-1 up to 270°C at a constant column pressure of 2.17 kPa. Retention
222
times, peak areas and mass spectra were recorded with Chemstation software. Bacterial FAME 223
standard mix, FAMEs mix C18-C20, polyunsaturated fatty acids standards (PUFA1 and PUFA3), cod 224
liver oil and various individual pure standards of FAME were used (Supelco). FAs were reported as 225
percentages of the total fatty acids (% TFA, mean ± SD) and grouped as saturated (SFA), 226
monounsaturated (MUFA), PUFA, and bacterial fatty acids (BACTERIAL; 227
15:0+15iso+15anteiso+17:0+17iso+17anteiso+18:1(n-7); (Mayzaud et al., 1989; Najdek et al., 228
2002). Unsaturation degree (UND) was calculated according to Pirini et al. (2007). The ratio of 229
C16:1/C16:0 (>1.0) and the relative dominance of C20:5 (n-3) (EPA) and C14:0 are considered as 230
diatom indicators (Ackman et al., 1968; Kharlamenko et al., 1995; Léveillé et al., 1997) while the 231
ratio of C22:6 (n-3)/C20:5 (n-3) (DHA/EPA) (>1.0), DHA, 16:0 and C16:1/C16:0 (<1.0) are 232
predominant in dinoflagellates (Budge and Parrish, 1998; Dalsgaard et al., 2003). DHA, EPA and 233
ARA (20:4 (n-6)) are considered Essential FA (EFA; Alkanani et al., 2007) and are transferred to 234
microzooplankton (Ventrella et al., 2008). Herbivorous calanoid copepod markers are C20:1 and 235
C22:1 (Falk-Petersen et al., 1987). A marker indicator of zooplankton (Sargent and Falk-Petersen, 236
1988) and detrital matter (Fahl and Kattner, 1993) is C18:1(n-9). 237 238 2.5. Statistical analysis 239 2.5.1. Environmental variables 240
M
AN
US
CR
IP
T
AC
CE
PT
ED
9 Two-way ANOVAs were used to test the effect of site (2 levels) and month (17 levels) in SPM, Chl 241a, BSi and lipids. A t-test was done for BSi in the sediment to check for site differences. Statistical
242
assumptions for normality (Shapiro test) and homoscedasticity (Levene’s test) were confirmed 243
prior to all analyses. 244
245
2.5.2. Stable isotopes
246
Two-way ANOVAs were used to assess the effect of site and month on isotopic and C:N molar 247
ratios in food sources and consumers. The Stable Isotope Bayesian Ellipses method in R (SIBER 248
package) was used to investigate isotopic niches by examining the dispersion of δ13C and δ15N
249
values together with the MixSIAR package as explained in section 2.3 (Jackson et al., 2011; Parnell 250
et al., 2010). A Standard Ellipse Area (SEA), which is to bivariate data as SD is to univariate data, 251
was applied to measure the isotopic niche width using Bayesian inference. SEAs are an alternative 252
to Convex Hull methods since the ellipses are unbiased with respect to sample size and their 253
estimation allows robust comparisons between data sets (Jackson et al., 2011). SEA values were 254
corrected for small sample size (SEACC) containing 95% of the data, and Bayesian estimates (SEAB)
255
were estimated as a measure to trophic width between species-sites. Analyses were performed in 256 R v3.1.3 (R Core Team, 2015). 257 258 2.5.3. Fatty acids 259
Analyses of similarities (ANOSIM) were performed in all detected FA profiles in SPM and Sed to 260
determine resemblance among sampling periods and sites, and among consumer groups across 261
sampling periods (PC-CC, PG-CG, PG-PC and CG-CC, referring to Callista chione from Pag (PC) and 262
Cetina (CC) and to Glycymeris bimaculata from Pag (PG) and Cetina (CG). All replicated data were 263
used and log(x+1) transformed to improve normality prior to analysis. Results based on a global R 264
statistic and p-value were reported. Non-metric multidimensional scaling (nMDS) using a Bray-265
Curtis similarity matrix were used to visualize the temporal compositional differences of all 266
detected monthly mean FA profiles in each compartment with respect to site. Similarity 267
percentage analysis (SIMPER) and principal component analysis (PCA) were applied to identify the 268
main contributors of dissimilarities in the FA profiles between sites in each compartment. SIBER 269
was also used to analyze feeding niche overlap using the x and y coordinates of the nMDS analysis 270
of FA profiles of consumer groups following Antonio and Richoux (2014). SIBER analyses were 271
M
AN
US
CR
IP
T
AC
CE
PT
ED
10 performed using R v3.1.3 (Jackson et al., 2011; R Core Team, 2015) and multivariate analysis 272(ANOSIM, nMDS, SIMPER and PCA) using PAST 3.0 (Hammer et al., 2001). 273
274
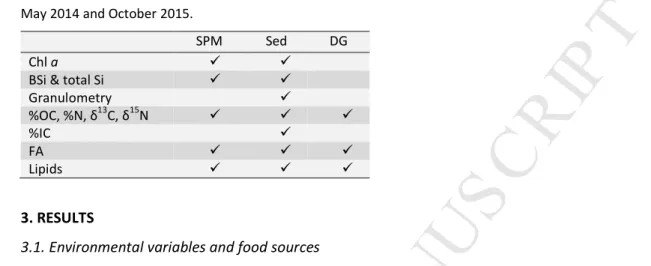
Table 1. Parameters measured in the different compartments at two study sites, Pag and Cetina between
275
May 2014 and October 2015.
276
SPM Sed DG Chl a
BSi & total Si Granulometry %OC, %N, δ13C, δ15N %IC FA Lipids 277 3. RESULTS 278
3.1. Environmental variables and food sources
279
Temperature at both sites followed a significantly correlated temporal trend (r = 0.98, P < 0.05) 280
with monthly means between 8.9°C and 25.1°C in Pag and 12.7°C and 26.4°C in Cetina. Monthly 281
salinity values ranged between 34.7 and 38.3 in Pag and 32.2 and 38.5 in Cetina. These values are 282
typical in coastal eastern Mediterranean waters (Vilibić et al., 2015). SPM concentrations had 283
means of 1.02±0.33 mg/L in Pag and 0.92±0.35 mg/L in Cetina (Table S1) and didn’t significantly 284
differ between sites (P > 0.05, Table S2). In Pag, monthly values ranged from 0.43 to 3.98 mg/L and 285
highest values were observed in both summers with a peak in March 2015, whereas in Cetina SPM 286
ranges varied from 0.53 to 1.99 mg/L with two peaks observed in February and June 2015. 287
Temporal variation of Chl aSPM were similar between sites (P > 0.05) ranging from 0.2 to 0.6 μg/L in
288
Pag and 0.2 to 0.7 μg/L in Cetina (Tables S1, S2). In Pag, the maximum Chl aSPM values were
289
observed in October 2014 and in January, March and October 2015 whereas the lowest 290
concentration of Chl aSPM was observed in both summers. In Cetina, the highest Chl aSPM
291
concentration was observed during winter and spring. Between September 2014 and June-292
August 2015, the low values of both Chl aSPM and Chl a % in SPM, suggested that this period was
293
the poorest for Chl a availability in the water column (Fig 2a, Table S1). A similar annual trend was 294
observed from satellite Chl a extracted from the MODIS-Aqua sensor with overall low Chl aSPM
295
values in summer and fall and high values during spring and winter (Fig S1). Significant differences 296
were observed in Chl aSed between sites (P < 0.001) with ranges from 0.4 to 5.0 μg/g in Pag and 1.1
297
to 11.8 µg/g in Cetina; the latter showed high values between November 2014 and March 2015. 298
M
AN
US
CR
IP
T
AC
CE
PT
ED
11 The annual patterns of Chl aSPM and Chl aSed were significantly correlated in Cetina (r = 0.49, P <299
0.05) but not in Pag (r = 0.15, P > 0.05). 300
The concentration of BSiSPM showed high temporal variability ranging from 0.03 to 0.20 mg/L in
301
Pag and from 0.02 to 0.20 mg/L in Cetina and non-significant differences between sites (Tables S1, 302
S2). Summer 2014 presented the highest BSiSPM values and no significant correlation was found
303
between BSiSPM and Chl aSPM at any site (all at r < 0.28, P > 0.05) (Fig 2). The concentrations of BSiSed
304
ranged from 0.06 to 0.2% in Pag and 0.1 to 0.3% in Cetina and showed significant differences 305
between sites (t-test, P < 0.05). BSiSPM and BSiSed were coupled during most of the study period (Fig
306
2e). 307
Sediment grain size was relatively constant with high content of sand and gravel, and low content 308
of silt and clay (fine sediment), which accounted for < 2%. Sand (2 mm – 63 µm) represented a 309
higher portion in Cetina (87%) than in Pag (74%) whereas gravel ( > 2mm) was more abundant in 310
Pag (26% vs 11%). No significant relationships were found among grain size and OC content (r = 311
0.12, P > 0.05). 312
M
AN
US
CR
IP
T
AC
CE
PT
ED
12 313M
AN
US
CR
IP
T
AC
CE
PT
ED
13Fig 2. Temporal variations at Pag and Cetina sampling sites (a) Chlorophyll a concentration (Chl a) - note
314
different units in two vertical axis, (b) C:N molar ratio, (c) δ13C, (d) δ15N and (e) biogenic silica (BSi) in
315
suspended particulatematter (SPM) and sediment (Sed) - note different units in two vertical axis. Error bars
316
represent standard deviations. Three replicates were used for each data point.
317 318 3.2. Stable isotopes 319 3.2.1. Food sources 320
The isotopic temporal variation ranged from -25.6 to -23.4‰ for δ13C
SPM and 1.6 to 6.1‰ for
321
δ15NSPM in Pag and from -26.2 and -22.8‰ for δ13CSPM and 0.03 to 5.6‰ for δ15NSPM in Cetina (Fig
322
2c, 2d). Two-way ANOVAs indicated significant differences between month and the interaction 323
with site in δ13CSPM (at P < 0.001) but not between sites (P > 0.05), whereas for δ15NSPM there were
324
significant differences between sites, month and their interaction (all at P < 0.001; Table S3). 325
Greater isotopic values were observed during summer and fall at both sites. In the sediment, the 326
isotopic temporal variation ranged from -22.7 to -22.0‰ for δ13CSed and -2.3 to 3.9‰ for δ15NSed in
327
Pag, and from -26.7 to 26.5‰ for δ13C
Sed and 1.1 to 3.3‰ for δ15NSed in Cetina. There were
328
significant differences in δ13CSed between sites (at P < 0.001), whereas neither significant temporal
329
differences nor in their interaction with site (P > 0.05; Table S3). More negative values in δ13C Sed
330
than δ13CSPM were observed in Cetina whereas the contrary was observed in Pag. Significant
331
differences in δ15NSed (all at P < 0.001) made evident the lower and variable values in Pag and
332
greater and constant in Cetina (Fig 2d). On the other hand, δ15N
SPM showed more positive values
333
than in δ15NSed at both sites.
334
The C:NSPM molar ratios did not significantly differ between sites (P = 0.055), with ranges from 7.3
335
to 10.6 in Pag and from 6.9 to 11.2 in Cetina; however, temporal differences within site were 336
significant (at P < 0.001), and Pag values showed a lower annual mean (Table S3). There was no 337
evident annual pattern at any site (Fig 2b). A significant correlation was shown between C:NSPM
338
and SPM at both sites (r = 0.50, P < 0.05) and between C:NSPM and Chl aSPM in Cetina (r = 0.60, P <
339
0.05), illustrated with the coincidence of peaks in October 2014 and February and April-June 2015 340
(Fig 2). BSiSPM and C:NSPM were not significantly correlated at any site (all at r < 0.47, P > 0.05). In all
341
cases, POCSPM/Chl aSPM values were > 200 (Table S1).
342
C:NSed molar ratios in Pag varied from 5.2 to 21.2 whereas in Cetina from 6.2 to 9.7. In Pag, high
343
values were recorded from spring to mid-summer. The range of C:NSed values in Cetina was similar
M
AN
US
CR
IP
T
AC
CE
PT
ED
14 to that observed in C:NSPM (Fig 2b, Table S3). Inorganic carbon represented 10.7 to 12.1% of345
sediment weight in Pag and from 7.6 to 11.6% in Cetina (Table S1). The values in Pag were closer 346
to the weight % of Carbon in the CaCO3 molecule, suggesting that CaCO3 is the main inorganic
347
carbon constituent in this area. Overall, more than 93% of the TC was inorganic in both sites. Total 348
Nitrogen values ranged from 0 – 0.05% at both sites (Table S1). 349
350
3.2.2. Consumers
351
The DG isotopic carbon signature showed a temporal variation that ranged from -25.6 to -23.0‰ 352
in Pag and -25.8 to -23.1‰ in Cetina in C. chione, and slightly higher δ13C
DG in G. bimaculata, from
-353
24.5 to -22.1‰ in Pag and -25.2 to -22.4‰ in Cetina (Fig 3a). In C. chione the δ15NDG varied from
354
0.3 to 1.8‰ in Pag and 1.6 to 3.2‰ in Cetina and in G. bimaculata from 0.2 to 1.8‰ in Pag and 1.9 355
to 3.2‰ in Cetina (Fig 3b). Two-way ANOVAs revealed significant differences in δ13C
DG between
356
sites, month and their interaction for both species (at P < 0.001), same for δ15NDG values except for
357
temporal changes between sites for C. chione (P > 0.05) (Table S3). These results indicated that 358
δ13C
DG variation was species-dependent with slightly more 13C-depleted values in C. chione. In
359
addition, a temporal offset of weeks in δ13C
DG values relative to δ13CSPM values, observed in both
360
sites (Figs 2c, 3a). On the other hand, δ15N
DG values were site-dependent, with more 15N-enriched
361
values corresponding to Cetina samples. Overall, enriched isotopic values were observed between 362
June 2014 to January 2015 and July to October 2015, whereas lower values occurred from 363
February to June 2015. The C:NDG molar ratio showed significant differences between sites, month
364
and their interaction for C. chione (P < 0.001) but they were less evident for G. bimaculata (P ≥ 365
0.001) (Fig 3c; Table S3). 366
367
The proportion of each food source on the consumer diets estimated by MixSIAR models revealed 368
that bivalves used both SPM and Sed; the Gelman-Rubin diagnostic for each model < 1.05, 369
supported the result. However, relative importance of each food source differed between sites. 370
Sed was more important for Pag populations with a small contribution of SPM during summer, 371
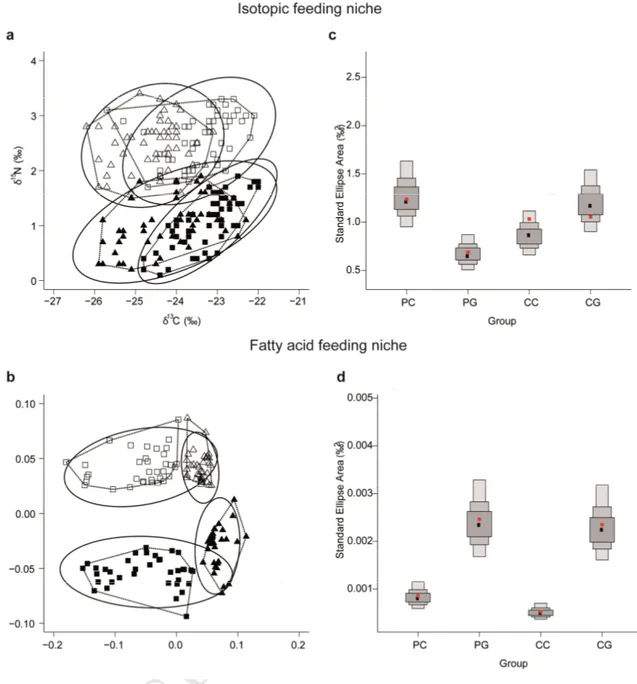
whereas in Cetina SPM contributed the most to the bivalves diet (Fig 4). The output from SIBER 372
analysis revealed a large overlap from both convex hull and SEA between species isotopic niche at 373
each site, indicating an overall proximity in their isotopic niche (Fig 5a). According to the temporal 374
isotopic distribution results, feeding niche overlap occurred just in November and March, 375
M
AN
US
CR
IP
T
AC
CE
PT
ED
15 revealing different composition of isotopic food sources throughout the year (Fig 5a, Fig S2) and 376making the temporal variation observed in Fig 3 clearer. Individuals of GlyPag showed the smallest
377
isotopic feeding niche with a complete SEA overlap and a convex hull overlap with CalPag. CalPag had
378
a wider niche, where the most enriched values overlapped with those from GlyPag. Based on SEAB
379
results, CalPag and GlyCetina have a greater plasticity than the other species at these locations (Fig
380
5c). 381
M
AN
US
CR
IP
T
AC
CE
PT
ED
16 382Fig 3. Temporal variation in (a) δ13C (‰), (b) δ15N (‰) and (c) C:N molar ratio in the consumer’s digestive
M
AN
US
CR
IP
T
AC
CE
PT
ED
17gland from both sites. Callista chione (C. chione) and Glycymeris bimaculata (G. bimaculata) from Pag and
384
Cetina.
385
386
Fig 4. Contribution of food sources: suspended particulate organic matter (SPM) and sediment (Sed) to the
387
diet of Glycymeris bimaculata and Callista chione at two sites: Pag and Cetina. Output from a two-source
388
MixSIAR model for each population.
M
AN
US
CR
IP
T
AC
CE
PT
ED
18 390Fig 5. Isotopic (SI) and fatty acid (FA) feeding niche of two benthic suspension feeders at two sampling sites
391
during 17 months. SIBER output using (a) pooled stable isotope bi-plot and (b) nMDS x-y ordinates of pooled
392
FA profiles. Glycymeris bimaculata (squares) and Callista chione (triangles) in Pag (filled) and Cetina (empty).
393
The continuous line represents the small sample size corrected standard ellipse areas (SEAC) and the convex
394
hulls areas are the dotted lines of calculated feeding niche widths for each species. Mean standard ellipse
395
area (SEA) estimates for each group (PC= Callista chione from Pag; CC= C. chione from Cetina; PG=
396
Glycymeris bimaculata from Pag and CG= G. bimaculata from Cetina) for SI (c) and FA (d). Boxed areas
397
indicate the SEAB with Bayesian 50, 75 and 95% credible interval with the mode indicated by black squares.
M
AN
US
CR
IP
T
AC
CE
PT
ED
19The maximum likelihood estimate for the corresponding SEAc as depicted in Fig 5 is indicated by red
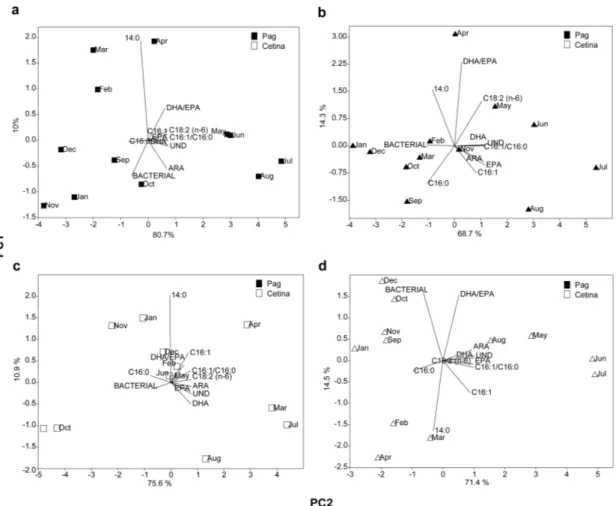
399 squares. 400 401 3.3. Fatty acids 402
FA with values > 0.01 (1% of total FA) are represented in Table S5 for SPM and Sed and in Table S6 403
for DG. All compartments showed the higher proportions on saturated fatty acids (SFA), compared 404
to MUFA and PUFA, with higher TFA% during fall and in DG also during winter. The lowest SFA 405
values were observed during the summer, when PUFA was more abundant. 406
3.3.1. Food sources
407
Considering all FASPM (n = 33) and FASed (n = 24), a two-way ANOSIM and nMDS were performed
408
showing significant differences between sites and month (r > 0.99, P < 0.001, and r > 0.84, P < 409
0.001, respectively) and nMDS revealed the large temporal spread of the data between sites, 410
which was more evident in SPM than in Sed (Fig 6a,b). 411
M
AN
US
CR
IP
T
AC
CE
PT
ED
20Fig 6. The upper panels show the non-metric multidimensional scaling (nMDS) of (a) suspended particulate
413
organic matter (SPM) and (b) sediment (Sed), based on all FA profile averages. The bottom panels show the
414
Principal component analysis (PCA) output using most influential FA profiles (see text) in (c) SPM and (d)
415
Sed. Sampling sites are represented as filled dots for Pag and blank dots for Cetina.
416 417
SIMPER analyses revealed that the FA C16:1, C18:2 (n-6) and PUFA were the profiles which better 418
explained dissimilarities between sites for both SPM and Sed, with a cumulative contribution of 419
nearly 50% for both compartments (Table S7). 420
To observe the spatio-temporal variations of the main FA profiles for each food source (SPM and 421
Sed) identified with SIMPER, PCAs were performed (Fig 6c,d). In the case of FASPM, January and
422
April (only at Cetina) and summer months (at both sites) were positively related to PC1 (explaining 423
42% of the variance) due to the contribution of EPA, UND, 16:1, 16:1/16:0, 18:2, BACTERIAL and 424
ARA. This statistical relationsuggested thatphytoplankton material was combined with bacterial 425
and terrestrial components in the SPM in those months. In PC2, the contribution of DHA and 426
DHA/EPA showed that SPM sampled in February at Cetina had organic matter with good quality as 427
well. In contrast, the negative relation of FASPM in PC1 indicated by C16:0, showed that the organic
428
matter available in SPM in Pag during fall, winter and spring had relatively poorer quality. 429
However, FASPM from Pag were more enriched with DHA than FASPM from Cetina during the same
430
period (Fig 6c). The spatio-temporal separation of FASed samples was less evident than the one
431
observed for FASPM, suggested that most of the samples represent a food mixture without
432
predominant components. However, a small prevalence of the terrestrial component could be 433
detected in March and April at Pag, whereas a phytoplankton component was prevalent during 434
summer at Cetina (Fig 6d). 435
436
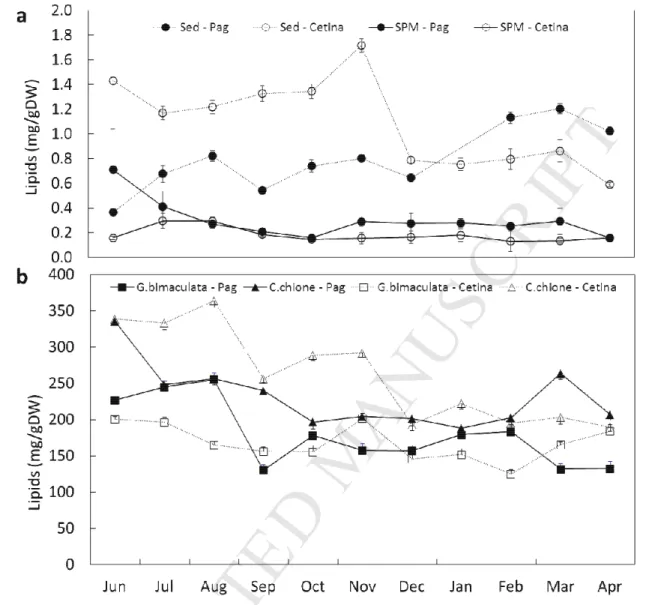
The concentration of lipidsSPM differed significantly between sites; however, it followed a similar
437
temporal pattern (P < 0.001; Table S2) ranging from 0.16 to 0.71 mg/L in Pag and from 0.13 to 0.30 438
mg/L in Cetina (Fig. 7). At both sites, the lowest concentration of lipidsSPM took place between
439
August and October (Fig 7a). In lipidsSed, values ranged from 0.36 to 1.20 mg/g in Pag and 0.59 to
440
1.72 mg/g in Cetina with different temporal patterns between sites; the concentration was 441
significantly higher in Cetina (P < 0.001; Table S2). 442
M
AN
US
CR
IP
T
AC
CE
PT
ED
21 443Fig 7. Temporal variation of lipid concentration in (a) sediment (Sed; dashed line) and suspended particulate
444
organic matter (SPM; continuous line) and (b) Glycymeris bimaculata and Callista chione at Pag (fill) and
445 Cetina (blank). 446 447 3.3.2. Consumers 448
Results for FADG were derived from the same pooled individuals than for SI. Most predominant FA
449
group were SFA (> 58 TFA%), followed by MUFA (> 23 TFA%) and PUFA (> 5 TFA%) (Table S6). 450
ANOSIM revealed significant differences on all FA profiles (n = 38) among each group formed by 451
species-site (r = 0.83, P < 0.001) and these were more evident between species than sites in the 452
pairwise comparison (r = 1, P < 0.001 between species; r < 0.53, P < 0.001 between sites). SIMPER 453
analyses and PCA revealed the FA profiles that most contributed to temporal differences for each 454
M
AN
US
CR
IP
T
AC
CE
PT
ED
22 consumer group, with PC1 explaining more than 68% and PC2 up to 14.5% (Table S8; Fig 8). PUFA, 455C20:5 and C22:6 contributed to nearly 50% of the differences between each group. 456
Generally, in both sites and for both species, PC1 axis clearly separated spring and summer 457
months from fall and winter, according to the digestion of high quality fresh material or bacterial 458
material enriched with saturated components, respectively (Fig 8; Table S6). 459
In late spring and summer, GlyPag’s digestive glands were strongly positively related to PC1 (EPA,
460
DHA, 16:1, 16:1/16:0, UND) and separated from the fall, winter and early spring according to 461
negative relations to PC1 (16:0). The latter samples were additionally separated according to the 462
influence of BACTERIAL FA (between Sep─Jan) and C14:0 (between Feb─Apr) posifvely and 463
negatively related to PC2, respectively (Fig 8a). In CalPag’s digestive glands, a positive relationship
464
of fresh material markers to PC1 was found between May and August, with a more pronounced 465
terrestrial component (C18:2) in May and June, and phytoplankton (16:1, EPA) in July and August. 466
A BACTERIAL component (negative PC1) was more digested during fall, winter and early spring, 467
being more enriched with C16:0 or C14:0 (Apr) (Fig 8b). The digestive glands of GlyCetina from
468
March, April, June and August were positively loaded to PC1, according to enrichment with all 469
unsaturated FA components and separated from September, October, November and January, 470
due to enrichment with the BACTERIAL component negatively related to PC1. Samples from 471
February, May, June and December were indifferent to both axis, which suggested the digestion of 472
mixture without prevalence of any food component (Fig 8c). In CalCetina’s digestive glands, samples
473
were positively related to PC1 (EPA, DHA, ARA, 16:1, 16:1/16:0, UND) between May and August, 474
and separated from the other months according to negative relation of 16:0 to PC1. Additionally, 475
the influence of the BACTERIAL component separated fall and early winter samples (between 476
Sep─Jan) from the late winter and early spring (Feb─Apr) which were enriched with C14:0 (Fig 8d). 477
M
AN
US
CR
IP
T
AC
CE
PT
ED
23 479Fig 8. Principal component analysis (PCA) output using most influential fatty acid profiles in Pag for (a)
480
Glycymeris bimaculata (b) Callista chione and Cetina for (c) G. bimaculata (d) C. chione.
481 482
Overall, spring and summer were the seasons with the fresher material found in the digestive 483
gland of both specimens, in contrast to fall and winter, where the BACTERIAL component was 484
dominant. The herbivorous calanoid copepod markers (C20:1 and C22:1) were more abundant in 485
spring and summer; oleic acid (C18:1) characteristic of zooplankton was more abundant in C. 486
chione, and a diatom marker (C14:0) was more abundant in G. bimaculata. In addition, within the
487
SFA pool, the bacteria marker associated to detrital matter (C20:0) was slightly higher in G. 488
bimaculata, especially at Cetina (Table S6). SIBER analysis of FA revealed a substantial overlap
489
between SEA but not convex hulls from each consumer group (Fig 5b). The FA feeding niche plot 490
also showed that consumers were grouped by site and the highest niche plasticity corresponded 491
to G. bimaculata at both sites (Fig 5d). 492
M
AN
US
CR
IP
T
AC
CE
PT
ED
24 The concentration of lipidsDG ranged from 188.34 to 335.39 mg/g in CalPag, 189.59 to 363.90 mg/g493
in CalCetina, 130.53 to 255.36 mg/g in GlyPag and from 125.07 to 201.78 mg/g in GlyCetina. Overall,
494
there was a decreasing trend from summer to spring (Fig 7b). 495
496
4. DISCUSSION 497
In coastal zones, marine particulate organic matter is composed by a mixture of terrestrial and 498
marine particles and living and detrital material mainly derived from plankton, bacteria, fecal 499
pellets or zooplankton remains such as exoskeletons (Berto et al., 2013; Savoye et al., 2012). The 500
coastal fringe in the eastern Mediterranean is especially important due to its oligotrophic 501
conditions, where environmental variation (e.g. wind, river discharges) may exert stronger 502
influence on the nutrient and biota dynamics in its shallow water column. Within this frame, it is 503
important for ecological studies, particularly for trophic ecology approaches, to disentangle food 504
sources and their variability to gain insights into the relationships between biotic and abiotic 505
factors that shape the ecosystem. 506
507
4.1. Characterization of food sources
508
The δ13C pattern in the SPM showed isotopically lighter carbon during winter and spring (down to
-509
26‰). This was presumably due to high precipitation events associated to river discharge and 510
more positive δ13C values during summer and fall (up to -22.8‰), closer to those related to marine
511
environments (e.g. ~-22‰ in marine phytoplankton) (Fry and Sherr, 1984; Harmelin-Vivien et al., 512
2008), suggesting a progressive mixing of terrestrial and marine materials (e.g. Berto et al., 2013; 513
Savoye et al., 2003). 514
Unlike SPM, large spatial rather than temporal variations were observed in δ13C values in 515
Sed, which averaged -22‰±0.4 at Pag and -26‰±0.2 at Cetina. These values were within those 516
reported for locations in the Adriatic Sea (Faganeli et al., 2009; Ogrinc et al., 2005; Žvab Rožič et 517
al., 2015) receiving marine and terrigenous inputs and suggested that the isotopic signature in Sed 518
may reflect a longer time-integrated signal than that in SPM. The upper sediment layer in Pag 519
showed more positive δ13C values which could be attributed to microphytobenthic production, 520
which is most likely contributing to primary production in other areas in the Adriatic Sea 521
(Šestanović et al., 2009). In contrast, the proximity to the river mouth suggests that the influence 522
M
AN
US
CR
IP
T
AC
CE
PT
ED
25 of terrestrial matter in Cetina should be responsible of the 13C-depleted signal as shown in other 523estuarine areas (Hedges et al., 1997; Sarma et al., 2014). 524
525
The interpretation of the nitrogen signal requires considering the potential contribution of several 526
sources, namely N2, NO3-, NH4+ or DON (e.g. Berto et al., 2013; Currin et al., 1995; Peterson, 1999).
527
On the one hand, the phytoplankton and bacterioplankton δ15N signature ranges in the order of -2
528
to 5‰ (Rees et al., 2006), whereas on the other, the Eastern Mediterranean basin is 15N-depleted
529
due to its oligotrophic nature (Pantoja et al., 2002; Sachs and Repeta, 1999). Given that our 530
δ15N
SPM data ranged from 1.6 to 6.1‰ in Pag and from 2.5 to 5.5‰ in Cetina, it is hard to
531
distinguish the drivers of the δ15NSPM signal; however, a combination of factors modulating the
532
observed results seem more feasible. The ~4‰ temporal variation observed along the study 533
period suggests that a mixture of freshwater and marine water influenced both study sites (Fig 534
2d). The higher values coincided in months with high precipitation events (typically fall) that 535
increased river discharges (Cetina area) and pulses of underwater springs (characteristic from Pag 536
area) (Surić et al., 2015) which potentially enhanced the enrichment in the nitrogen isotopic 537
composition signal (Xue et al., 2009). 538
In the sediment, more negative and variable values (ranging from -2.3 to 3.9‰) were 539
found in Pag; negative values are likely associated to benthic diazotroph community. For example, 540
in oligotrophic water bodies, diazotroph biomass is responsible of atmospheric nitrogen fixation 541
(Rees et al. 2006, Pantoja et al. 2002, Wada et al. 2012), particularly by blue-green algae (Currin et 542
al., 1995; Minagawa and Wada, 1986). Studies on cultured cyanobacteria revealed that nitrogen 543
isotope ratios ranging from -1.5 to -3.0‰ during N2 fixation were associated to high δ13C in
544
cyanobacteria cells (Wada et al., 2012). Alike, studies on cyanobacteria in sedimentary organic 545
matter in the NW and Eastern Mediterranean showed δ15N ranges from -2 to 2‰, suggesting that
546
the observed values were the result of bacterial organic matter remineralization (Kerhervé et al., 547
2001; Möbius, 2013). This association would imply that bacterial nitrogen fixation is a main 548
contributor to the δ15N signal in PON in the coastal system off Pag island. On the other hand,
549
comparatively more constant but also relatively low values in Cetina (averaging 2.3‰±0.2), were 550
similar to those in Mediterranean estuarine areas (Carlier et al., 2007). 551
M
AN
US
CR
IP
T
AC
CE
PT
ED
26 Based on the live phytoplankton C:N molar ratio of 6, the Redfield ratio is a traditional indicator to 553discriminate fresh relative to degraded marine and to distinguish marine from terrestrial organic 554
matter (Redfield, 1958). Bacterial cells have lower C:N molar ratio than phytoplankton due to 555
preferential mineralization of N (Newton et al., 1994), therefore, in periods of food scarcity C:N 556
ratios may decrease due to bacterial presence. The C:NSPM values (between 7 and 11, Fig. 2b) in
557
Pagsuggest a high proportion of phytoplanktonic material (e.g. Schubert and Calvert, 2001) 558
throughout the year and a particular contribution of bacterial material in December and February, 559
what seems to be in concordance with the isotopic signals previously discussed. At Cetina, C:NSPM
560
ranged from 7 to 11 indicating a mixture of phytoplankton with marine degraded and/or 561
terrestrial OM in agreement with other estuarine systems, probably enhanced by riverine inputs 562
(Dias et al., 2016; Hedges et al., 1997; Savoye et al., 2003). The presence of several C:N ratio peaks 563
(e.g. October 2014, December, February and June 2015; Fig 2b) in Cetina site was most likely 564
related to resuspension events that incorporated degraded material into the water column. The 565
coincidence with high suspended particulate matter values (Table S1) provides further support to 566
this idea. The low relationship between C:N and biogenic silica suggest that the non-siliceous 567
phytoplankton community could be more important than diatoms, radiolarians and 568
silicoflagellates in the carbon pool in this shallow water column. 569
In the sediment at Pag, the overall higher C:NSed ratios (between 5 and 31) suggested
570
higher abundance of bacteria during fall and winter, in agreement with the observed N isotopic 571
signature (Fig 2b,d). The C:NSed ratios in Cetina were more constant (averaging 7.7) and coexisted
572
with comparatively higher percentage of biogenic silica, implying a higher concentration of fresh 573
OM with diatom abundance. However, the FA marker for diatom was quite low (as discussed next) 574
suggesting that the presence of empty frustules explains the high BSi values and providing further 575
support to the presence of bacteria in the OM pool. 576
In general, the low %C and %N in the sediment were within the range of other reports 577
from the Adriatic, e.g. 0.5-1.3 %C and 0.1-0.17 %N (Ogrinc et al., 2005) and 0.02-0.15 %N 578
(Matijević et al., 2009) corroborating the poor nutritional quality of the sediment in this 579
oligotrophic basin. In addition, the POC/Chl a values were > 200 indicating high chlorophyll a 580
degradation most likely due to the strong presence of heterotrophic/mixotrophic organisms 581
(Bentaleb et al., 1998; Galois et al., 1996) as reported in estuarine areas in the Adriatic Sea (Šolić et 582
M
AN
US
CR
IP
T
AC
CE
PT
ED
27 al., 2015), which have also been found to be key bacterial grazers in coastal oligotrophic waters 583(Unrein et al., 2013). 584
585
Seasonal FA patterns in the SPM also indicated different sources of OM at two sites. The most 586
important components of SPM and Sed lipids were 14:0, 18:0, 18-1(n-9), 20:1, 20:0 and BACTERIAL 587
FA (Fig 6, Table S6). Within SFA, C20:0, which could be linked to bacteria associated to detrital 588
matter collected from the sediment (Galap et al., 1999) or suspended particulate matter was 589
higher during winter and it was more abundant in Pag, coincident with SI interpretations. The high 590
proportion of MUFA, 18-2(n-6) and BACTERIAL FA in Cetina suggested that terrestrial inputs 591
predominated in the OM in SPM, also supporting the observations of SI results. Usually, the FA 592
marker C18:2(n-6) is associated with terrestrial sources (Budge and Parrish, 1998; Fischer et al., 593
2014; Parrish et al., 1996), seagrass (Kharlamenko et al., 2011) or protozoa (Zhukova and 594
Kharlamenko, 1999). The FA 18:1(n-9) was particularly abundant during spring and summer, and it 595
has been associated with zooplankton (Sargent and Falk-Petersen, 1988) and cyanobacteria 596
(Antonio and Richoux, 2016) Relatively high PUFA concentrations (particularly EFA’s; Fig 6) 597
suggested that the best OM quality in SPM took place suring summer at both sites. However, in 598
Pag, slightly higher values coincident with relatively low C:N and high BSi values, indicated a larger 599
contribution of fresh siliceous phytoplankton biomass in that site. Further, herbivorous calanoid 600
copepod markers were more abundant in Cetina during fall and winter, presumably following 601
phytoplankton biomass peaks. In the Sed, high PUFA concentrations were also observed in 602
summer, suggesting an effective pelagic-benthic coupling along the study area. 603
Phytoplankton FA markers, δ13C, C:N ratios and BSi
SPM values suggested that SPM is of
604
better quality and has more phytoplankton influence during spring and summer. Often, δ13C is 605
positively correlated to Chl a concentrations (e.g. Miller and Page, 2012) and probably this 606
relationship is more evident in shallow coastal areas, such as the present study area. However, the 607
temporal mismatch between Chl a and the rest of measured parameters in the present study was 608
most likely influenced by the high amount of resuspended material different to phytoplankton 609
(e.g. bacteria and empty diatom frustules) that may obscure the signal of Chl a, which is related 610
solely to phytoplankton biomass. 611
M
AN
US
CR
IP
T
AC
CE
PT
ED
28 The combined SI and FA temporal variation profiles in the SPM and Sed described an alternation 613between a freshwater dominated system in winter to a marine-water dominated one in summer. 614
Indeed, the particulate matter in Pag appeared of better quality due to abundance of EFA within 615
PUFA in both compartments and by the lighter values of δ13C and less SFA observed in the
616
sediment. However, the nitrogen isotopic signature better distinguished the sources contributing 617
to the OM pool at each site resulting in a better tracer of environmental changes than the carbon 618
isotope (Fig 3a). Overall, results suggested that bacteria seemed to play a major role in the organic 619
carbon and nitrogen budgets in the particulate matter in the coastal system off the island of Pag. 620
BACTERIAL FA showed that bacteria were abundant in both compartments at both sites, making 621
evident their importance as food source (Galois et al., 1996; Šestanović et al., 2009). 622
623
4.2. Spatial and temporal variation in bivalve diet
624
The isotopic composition of the digestive gland of Callista chione and Glycymeris bimaculata 625
revealed a pronounced temporal variation at two sampling sites. The carbon isotopic variation 626
indicated to be species-specific, with slightly higher values in G. bimaculata while large differences 627
in the nitrogen isotope were site-specific, with higher values shown in Cetina (Fig 3a,b). The 628
temporal variation in δ13C
DG was coupled to that in δ13CSPM, indicating that bivalves adjusted their
629
dietary shifts depending on the availability of food mainly in SPM (Figs 2,3). This coupling 630
suggested that SPM is an important food source what is in agreement with other studies in coastal 631
systems (Antonio and Richoux, 2014; DeNiro and Epstein, 1978; Kang et al., 1999; Kasai et al., 632
2004; Riera and Richard, 1996). Bivalves increase their δ13C values due to the preferential release
633
of 12C during respiration (Kang et al., 1999; Kharlamenko et al., 2001; Page and Lastra, 2003), and
634
our results showed a slight 13C-enrichment in DG with respect to SPM, presumably reflecting this 635
process. In our study, G. bimaculata presented slightly heavier δ13C values than C. chione
636
indicating that they feed more upon autochthonous particles (i.e. phytoplankton derived organic 637
matter) showing a stronger dependence on primary producers, as seen in other studies (France, 638
1995; Kang et al., 2003; Kharlamenko et al., 2008; Nadon and Himmelman, 2006). Another stable 639
isotope study conducted on C. chione from the NW Mediterranean showed a more enriched 640
isotopic signature (δ13C: -19.4‰±0.5, δ15N: 4.7‰±0.4, n=5 in Carlier et al., 2007), suggesting that
641
same species may reflect local environmental differences along the Mediterranean Sea. 642