HAL Id: hal-02165760
https://hal.sorbonne-universite.fr/hal-02165760
Submitted on 26 Jun 2019
HAL is a multi-disciplinary open access
archive for the deposit and dissemination of
sci-entific research documents, whether they are
pub-lished or not. The documents may come from
teaching and research institutions in France or
abroad, or from public or private research centers.
L’archive ouverte pluridisciplinaire HAL, est
destinée au dépôt et à la diffusion de documents
scientifiques de niveau recherche, publiés ou non,
émanant des établissements d’enseignement et de
recherche français ou étrangers, des laboratoires
publics ou privés.
and land uses on local to regional climate and air quality
Raia Silvia Massad, Juliette Lathière, Susanna Strada, Mathieu Perrin, Erwan
Personne, Marc Stéfanon, Patrick Stella, Sophie Szopa, Nathalie de
Noblet-Ducoudré
To cite this version:
Raia Silvia Massad, Juliette Lathière, Susanna Strada, Mathieu Perrin, Erwan Personne, et al..
Re-views and syntheses: influences of landscape structure and land uses on local to regional climate and
air quality. Biogeosciences, European Geosciences Union, 2019, 16 (11), pp.2369-2408.
�10.5194/bg-16-2369-2019�. �hal-02165760�
https://doi.org/10.5194/bg-16-2369-2019 © Author(s) 2019. This work is distributed under the Creative Commons Attribution 4.0 License.
Reviews and syntheses: influences of landscape structure and land
uses on local to regional climate and air quality
Raia Silvia Massad1, Juliette Lathière2, Susanna Strada3, Mathieu Perrin4, Erwan Personne1, Marc Stéfanon5, Patrick Stella4, Sophie Szopa2, and Nathalie de Noblet-Ducoudré2
1UMR ECOSYS, INRA AgroParisTech, Université Paris Saclay, 78850, Thiverval-Grignon, France
2Laboratoire des Sciences du Climat et de l’Environnement, LSCE/IPSL, CEA-CNRS-UVSQ, Université Paris-Saclay,
Gif-sur-Yvette, 91191, France
3The Abdus Salam International Centre for Theoretical Physics – Earth System Physics Section, 34151 Trieste, Italy 4UMR SAD-APT, AgroParisTech, INRA, Université Paris-Saclay, 75005, Paris, France
5Laboratoire de Météorologie Dynamique, Ecole Polytechnique, IPSL Research University, Ecole Normale Supérieure,
Université Paris-Saclay, Sorbonne Universités, CNRS, Route de Saclay, 91128 Palaiseau, France Correspondence: Raia Silvia Massad (raia-silvia.massad@inra.fr)
Received: 19 September 2018 – Discussion started: 8 October 2018
Revised: 11 April 2019 – Accepted: 26 April 2019 – Published: 11 June 2019
Abstract. The atmosphere and the land surface interact in multiple ways, for instance through the radiative-energy bal-ance, the water cycle or the emission and deposition of nat-ural and anthropogenic compounds. By modifying the land surface, land use and land cover changes (LULCCs) and land management changes (LMCs) alter the physical, chem-ical, and biological processes of the biosphere and there-fore all land–atmosphere interactions, from local to global scales. Through socio-economic drivers and regulatory poli-cies adopted at different levels (local, regional, national, or supranational), human activities strongly interfere in the land–atmosphere interactions, and those activities lead to a patchwork of natural, semi-natural, agricultural, urban, and semi-urban areas. In this context, urban and peri-urban ar-eas, which have a high population density, are of particular attention since land transformation can lead to important en-vironmental impacts and affect the health and life of millions of people. The objectives of this review are to synthesize the existing experimental and modelling works that investigate physical, chemical, and/or biogeochemical interactions be-tween land surfaces and the atmosphere, therefore potentially impacting local/regional climate and air quality, mainly in ur-ban or peri-urur-ban landscapes at regional and local scales.
The conclusions we draw from our synthesis are the fol-lowing. (1) The adequate temporal and spatial description of land use and land management practices (e.g. areas
con-cerned, type of crops, whether or not they are irrigated, quan-tity of fertilizers used and actual seasonality of application) necessary for including the effects of LMC in global and even more in regional climate models is inexistent (or very poor). Not taking into account these characteristics may bias the regional projections used for impact studies. (2) Land– atmosphere interactions are often specific to the case study analysed; therefore, one can hardly propose general solutions or recommendations. (3) Adaptation strategies, proposed af-ter climatic impacts on the targeted resource have been de-rived, are often biased as they do not account for feedbacks on local/regional climate. (4) There is space for consider-ing atmospheric chemistry, through land–atmosphere inter-actions, as a factor for land management, helping to maintain air quality and supporting ecosystem functioning. (5) There is a lack of an integrated tool, which includes the many dif-ferent processes of importance in an operational model, to test different land use or land management scenarios at the scale of a territory.
1 Introduction
The Earth’s atmosphere is an envelope of gases, liquid, and solid particles that provides essential conditions for life to thrive on Earth. Via its composition and exchanges with
the land surface, the Earth’s atmosphere regulates the phys-ical climate around us and is as indissociable part of ev-ery ecosystem and a limited resource. Today, facing global changes in terms of climate, atmospheric composition, bio-diversity, and demography, there is a growing demand to preserve a standard quality of life. Conversely, there is an increasing pressure on natural and human-shaped ecosys-tems to increase production and meet the nutritive and recre-ational demands of an expanding population. To maintain liveable conditions on Earth, it is important to understand the delicate balance between physical, chemical, and bio-logical processes, and their interactions, which involve the atmospheric envelope and related surface systems (water, soil, flora, fauna, concrete, etc.) at local, regional, and global scales.
The atmosphere and the land surface interact in multiple ways, such as through the radiative-energy balance (Suni et al., 2015), the water cycle (Pielke et al., 1998), or the emis-sion and deposition of natural and anthropogenic compounds (Arneth et al., 2010). Land use and land cover changes (LUL-CCs) (e.g. deforestation en afforestation, urbanization, culti-vation, drying of wetlands) and land management changes (LMCs) (e.g. no-till agriculture, double-cropping, irrigation, cover crops) alter the land surface by modifying the physical properties (e.g. surface albedo, emissivity, and roughness), the chemical emission–deposition potential of land surfaces, and the biological equilibrium of living organisms and soils. Finally, LULCCs and LMCs affect the physical and chemi-cal interactions between the land surface and the atmosphere, the atmospheric composition, and lastly the Earth’s climate (Perugini et al., 2017), at local to global scales. The impor-tance of LULCCs on the global climate is widely acknowl-edged, and global climate models (GCMs), which work at scales of 50–100 km, now integrate LULCC scenarios to in-vestigate future climates (Jones et al., 2014). However, there is an increasing need to understand the effects on climate of LULCCs and LMCs operating at the regional, local, and even territorial scales, and hence to implement LULCC and LMC scenarios in climate models working at finer resolutions (i.e. regional climate models, RCMs) to explore their effects on the regional–local climate.
Today, human activities largely shape landscapes, result-ing in a patchwork of natural, semi-natural, agricultural, ur-ban, and semi-urban/peri-urban areas at scales smaller than a hectokilometre (Allen, 2003). The land surface is thus strongly sensitive to socio-economic drivers and influenced by regulatory policies adopted at the local, regional, na-tional, or supranational scales. In this way, human activities strongly interfere in the land–atmosphere interactions and consequently influence climate and air quality at various ge-ographical scales.
Recently, several reviews have examined the interactions between LULCCs and air quality and/or climate change.
Pielke et al. (2011) and Mahmood et al. (2014) reviewed the direct influence of LULCCs on regional climate, through
biophysical processes, i.e. the modification of the water, en-ergy, and radiative exchanges between the Earth’s surface and the atmosphere’s lower boundary from local to regional scales. Based on both observed and modelled data, the au-thors conclude that LULCCs affect local and regional cli-mate, and, more significantly, the areal coverage of the land-scape conversion determines the potential of LULCCs to ef-fectively influence the mesoscale and regional climate.
Arneth et al. (2010, 2012), and more recently Heald and Spracklen (2015), mainly focused on the chemical effects. Arneth et al. (2010) looked at the picture from a global per-spective with no special focus on LULCCs. They put for-ward that feedbacks between the terrestrial biosphere and the atmosphere cannot be ignored from a climate perspec-tive and that our limited understanding of the processes in-volved implies that none of the feedbacks studied will act in isolation but rather that the system is more complex. The authors warned that non-linearities and possible thresholds exist that should be elucidated before performing simula-tions with ecosystem–chemistry–climate models. Arneth et al. (2012) encourage the improvement of the representation of biological and ecological processes and bridging the gap between biogeophysical and socio-economic communities, corroborating the need for integrative investigations. Indeed, the authors claim that the level of description for the different processes and interactions involved can significantly modify the projections of land–atmosphere exchanges (physical and chemical) performed with models.
Heald and Spracklen (2015) reviewed the interactions be-tween LULCCs and atmospheric chemistry, with a focus on short-lived atmospheric pollutants, mainly biogenic volatile organic compounds (BVOCs), soil nitrogen oxides (NOx),
dust, smoke, bioaerosols, and ozone (O3), and their
subse-quent radiative effects on global and local climates. The au-thors estimate that land use change (LUC) can cause a re-gional direct radiative effect of ±20 W m−2. They identified several gaps of knowledge particularly linked to the aerosol effects on the regional radiative balance and emission vari-ability due to different vegetation types. Other identified un-certainties are the future evolution of agricultural practices as well as the lack of connection between the different atmo-spheric species or process responses to LULCCs.
More recently, some studies have focused on the impact of small-scale changes, especially urbanization, on climate, and air quality. The work led by Jacobson et al. (2019), for in-stance, investigated the impact of urbanization in two cities, New Delhi and Los Angeles, on weather, climate and air quality over the 2000–2009 period. The authors applied satel-lite and road data to assess the extension of urban and road areas, a 1-year inventory for anthropogenic and natural emis-sions, together with a global-through-urban nested climate– weather–air pollution model (GATOR-GCMOM). Changes in natural emissions related to meteorology were accounted for in this approach. For both New Delhi and Los Angeles, they concluded that urbanization has led to an increase in
sur-face roughness, shearing stress, and vertical turbulent kinetic energy and concurrently to a decrease in near-surface and boundary layer wind speed, thus worsening pollution levels. This study shows that urbanization could have had signif-icant impacts on both meteorology and air quality. Putting these results in a larger regional context would give the pos-sibility to quantify the impact of urbanization on air qual-ity and climate of surrounding peri-urban and rural areas. In that respect, Zhong et al. (2018) investigated the impact of urbanization-induced land cover change and increase in an-thropogenic emissions on the air quality of the megacity clus-ter of the Yangtze River Delta. The authors applied a regional climate–chemistry model (the Weather Research and Fore-casting with Chemistry, WRF-Chem) coupled with an urban canopy model. A strong reduction of near-surface aerosol concentrations was estimated over urban regions, whereas particulate pollution increased over the surrounding rural ar-eas. These results were partly due to the urban heat island effect, which increased the lower atmospheric instability and ventilation over the urban area, and therefore promoted the dispersion of pollutants from urbanized areas to their imme-diate vicinities. This study exhibits the tight links between processes (physical, chemical) and scales (local, regional; ur-ban, peri-urur-ban, and rural areas).
So far, beyond scientific literature, relatively little atten-tion has been paid in spatial planning practices to the conse-quences of land-use-related decisions and measures on cli-mate conditions and air quality at a local–regional scale. Spatial-planning concerns generally focus on the impacts of densely built-up areas on temperatures in urban contexts (Tam et al., 2015; Du et al., 2007), or on ways to improve the mitigation of climate change (i.e. to enhance the biospheric sink of carbon dioxide, CO2, or decrease its sources). Hence,
to our knowledge, very few studies have (1) discussed alto-gether the different physical, chemical, and biological inter-actions between the land surface and the atmosphere, (2) fo-cused on urban-/peri-urban areas at local–regional scales, and (3) been addressed by decision makers, stakeholders, and land planners.
Our objective is therefore to review the existing experi-mental and modelling works that investigate the effects of re-gional and/or local LULCCs and LMCs on physical, chemi-cal, and/or biological interactions and feedbacks between the land surface and the atmosphere in rural, urban, and/or peri-urban landscapes. We refer to biological interactions as the exchange of chemical compounds that involve soils and bi-ological organisms. The structure and content of this review is designed to be accessible to a large audience, including both specialists, such as scientists, and non-specialists, such as land planners, stakeholders, and decision makers. Non-specialists may refer to the Supplement for a short review of the fundamentals of physics, chemistry, and biology that are at work in LULCCs and LMCs.
Our synthesis focuses on relatively short timescales (with respect to climate), ranging from a few days to a few years,
and on local to regional spatial scales ranging from a few to a hundred kilometres. In the text, we will consistently use the word “climate” to refer to changes in mean weather val-ues, considering impacts on local and meso-climate, whereas LULCC-induced impacts on global climate, especially via modification in greenhouse gas emissions and concentra-tions, are not the target of the present study and will not be covered here. Readers interested in these topics may refer to the studies of Le Quéré et al. (2018) and Saunois et al. (2016) for example. We pay special attention to the territorial dimen-sion, understanding territory as the portion of the land surface delimited and developed by a community according to their needs; this includes the political authority as well as the use and developments made by a social group (Le Berre, 1992; Ginet, 2012). We mainly focus on human-driven changes to land use and land management and on peri-urban landscapes, relying on the fact that today 54 % of the world’s population lives in cities (United Nation, 2014) and that the annual rates of urban land expansion ranges from 2.2 % in North Amer-ica to 13.3 % in coastal areas in China. Although today urban areas represent less than 0.5 % of the Earth’s total land area (around 650 000 km2) (Schneider et al., 2009), estimations show that more than 5.87 million km2of land is likely to be converted into urban areas by 2030, and very likely (proba-bility > 75 %) for 20 % of this surface (Seto et al., 2012).
We firstly present land–atmosphere interactions for indi-vidual land cover and/or land management changes by dis-cussing physical, chemical, and biological processes. We then explore possible interactions between these processes for a mosaic of different adjacent land uses and manage-ments. We finally identify challenges and needs for current research and propose potential levers for action.
2 Land cover and land use changes: history, dynamics, and challenges
2.1 Historical perspective
Historically, research on land use intensification and popu-lation growth emerged after World War II in different dis-ciplines such as human geography, ecological anthropology, or political ecology and concentrated on understanding agri-cultural changes. Later, concerns have been raised about the influence of the land surface on climate processes. In the mid-1970’s, diverse studies highlighted the impact of land cover change on the land–atmosphere energy balance at lo-cal, regional, and global scales due to modifications in sur-face albedo (Otterman, 1974; Charney et al., 1975, 1977; Sagan et al., 1979). Lately, in the early 1980s, Woodwell et al. (1983) and Houghton et al. (1985, 1987) emphasized the role of terrestrial ecosystems as sources and sinks in the car-bon cycle, pointing out the impact of the land cover on global climate. Because of the growing awareness that land surface influences various environmental processes and the climate,
understanding the trends, patterns, and mechanisms of LUL-CCs became a fundamental issue in academic research (e.g. Ramankutty and Foley, 1999; Klein Goldewijk, 2001, 2011; Foley, 2005; Lambin and Geist, 2006; Ellis, 2011). In the 1990s, the availability of land use data through remote sens-ing shifted the focus from land use intensification to land use and land cover studies (Erb et al., 2007; Verburg et al., 2011). More recently, due to its far-reaching, potentially detrimen-tal ecological consequences, land use intensification has at-tracted the interest of the scientific community at large (Erb et al., 2013).
2.2 Land use and land cover change
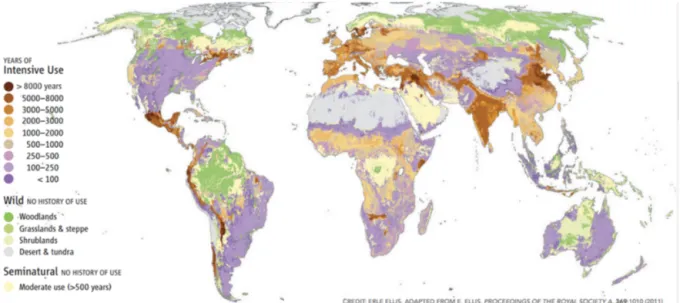
Although land change may be one of the most ancient of all human-induced impacts on the environment, the Earth’s land surface has never been altered by anthropogenic activity at the pace, magnitude, and extent experienced over the past few centuries (Lambin et al., 2001). On the basis of distinct studies, it can be estimated that roughly 12 million km2 of forests and woodlands has been cleared over the last 3 cen-turies, representing approximately a 20 % decrease in forest cover: Richards (1990) estimated a 11.7 million km2 loss – from 62.2 to 50.5 million km2– between 1700 and 1980, Ra-mankutty and Foley (1999) indicated an 11.35 million km2 loss – from 55.27 to 43.92 million km2 – between 1700 and 1992, and Klein Goldewijk (2001) mentioned a 12.9 million km2loss – from 54.4 to 41.5 million km2– be-tween 1700 and 1990. Although huge variations can be no-ticed between studies, notably because of land use/land cover definition and classification issues, similar trends have been reported regarding changes in natural areas (steppes, savan-nas, grasslands, shrublands, tundras, and hot/ice deserts): Ra-mankutty and Foley (1999) mentioned a 7.3 million km2loss – from 73.2 to 65 million km2 – between 1700 and 1992 while Klein Goldewijk (2001) assessed a 25 million km2loss – from 71.9 to 46.9 million km2– between 1700 and 1990. In his review on the anthropogenic transformations of the ter-restrial biosphere, Ellis (2011) spatially quantified the tem-poral aspects of human transformations on the ecosystems (Fig. 1).
Such a focus has led us to consider, especially under the scope of an integrated land science, the various and complex interactions between human societies and the environment (Turner, 2002). The land cover – which can be understood as one biophysical attribute of the surface (Turner et al., 1995) – is now predominantly dependent on the land use – which can be understood as the activity human societies have used the land for in accordance with economic, cultural, politi-cal, historical and land tenure considerations (Turner et al., 1995). On the world’s ice-free land surface of approximately 130.1 million km2, the area directly reconfigured by human action as of 2007 has been estimated at 53.5 % (Hooke and Martin-Duque, 2012).
This decline of natural ecosystems is essentially due to the conversion of forests, savannas, and grasslands into agri-cultural lands. The global areas of croplands and pastures increased significantly since 1700 with estimated extension from 12.3 million (Goldewijk, 2011, 1700–2000 period) to 14.75 million km2(Pongratz et al., 2008; 1700–1992 period). By combining the results of different studies addressing this land transformation issue, Hooke and Martin-Duque (2012) estimated that, today, croplands and pastures represent, re-spectively, 12.8 % and 25.8 % of the world’s ice-free land surface (Fig. 2).
Finally, the land transformation related to urban develop-ment and infrastructure expansion must be pointed out. A total of 8.4 million km2can be classified as urban areas, ru-ral housing, business areas, highways, or roads (Hooke and Martin-Duque, 2012). Even if increasing, commonly at the expense of agricultural land (Döös, 2002), this number rep-resents only about 6.46 % of the world’s ice-free land sur-face. However, such a land transformation can strongly af-fect environmental processes at local and/or regional scales and therefore affect the health and life of millions of people, given the human density in the areas impacted (Ermert et al., 2012; Jagger and Shively, 2014).
2.3 Land use intensification
Another aspect of land use that affects the environment is land use intensification. In the scientific literature, there is no unique definition of land use intensification or land use in-tensity, even though the concept is increasingly referred to. The diversity of definitions reflects on the one hand a disci-plinary diversity and, on the other, a certain relationship be-tween humans and nature (Lindenmayer et al., 2012; Erb et al., 2013, 2016). From these two different contexts two dis-tinct definitions of land use intensification emerge. The first comes from an agricultural point of view where land use in-tensification is simply defined as the increasing production from the same land by additional inputs in terms of labour, energy, fertilizer, and water (Erb et al., 2009; Krebs et al., 1999). Most of the time this involves developed agricultural techniques and an increased amount of input to the ecosys-tem (fertilizers, pesticides, etc.) (Lindenmayer et al., 2012). The land use intensification via production is thus operated in a neutral way on land area where intensification is the means by which gains are made using increased inputs per unit land area (Moller et al., 2008). However, it can involve a land use change in the case of the implantation of bioenergy crops, for example. As a second definition, land use intensification can also be seen from an ecological or biodiversity point of view as the increasing transformation of the land away from the original habitat. From this point of view, land use intensifica-tion is accompanied by landscape and ecosystem simplifica-tion, from complex natural systems to simplified agricultural ecosystems (the more one moves toward intensification, the more the other tends to move towards landscape uniformity
Figure 1. Anthropogenic transformation of the terrestrial biosphere showing the number of years of intensive use from Ellis (2011).
Figure 2. Adapted from Hooke and Martin-Duque (2012). Changes in land use through time (closed symbols) with extrapolations to 2050 CE (open symbols).
in a reduction of biodiversity), or to urbanization (Flynn et al., 2009). This type of intensification is, however, never neu-tral on land area and systematically involves a LULCC. The difference between this view of land use intensification and LULCC is that the change is always towards a more human-shaped system, whereas LULCC can occur in the opposite direction by afforestation, restoration, etc.
As a result, it is very difficult today to draw a picture of the dynamics behind or the evolution of land use intensi-fication simply because there is no common definition and terminology and there are many knowledge gaps related to
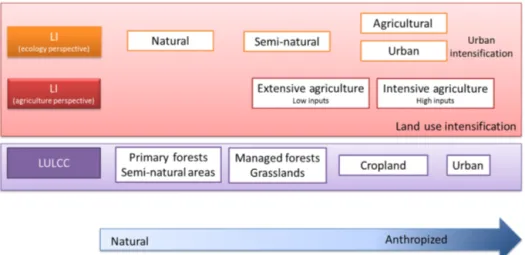
the underlying processes and determinants of the levels, pat-terns, and dynamics of land use intensity (Shriar, 2000; Erb, 2012). However, it is essential to (a) assess the impacts of those changes and intensifications and (b) have the tools to assess their influences on the biosphere and on biosphere– atmosphere interactions. In the sections below, we review the documented effects on the atmospheric compartment from a physical, chemical, and biological point of view and classify them in two categories (Fig. 3): land cover change and land intensification (agricultural and urban).
3 Human-driven land use and land management changes and their impact on climate and air quality 3.1 Land cover change
Most historical LULCCs are considered to have globally de-creased primary production and therefore had an impact on atmospheric CO2concentrations and thus on global
warm-ing, as shown by Gruber and Galloway (2008). This can be explained by the fact that past LULCCs concerned primar-ily deforestation and the increase in urban areas, thus lead-ing to lower ecosystem productivity and a release of soil and biomass-stored carbon to the atmosphere in the form of CO2. Moreover, LULCCs affect physical interactions
be-tween the land surface and the atmosphere and atmospheric components other than CO2such as reactive nitrogen
com-pounds via their effects on the carbon (C) and nitrogen (N) cycles. This is mainly induced by the alteration of land– atmosphere exchanges through changes in (i) stomatal con-ductance, (ii) deposition and adsorption on the leaf surfaces and cuticles, which varies according to plant species, (iii) the canopy architecture and its physical properties (leaf area, tree height), and (iv) availability of free soil water, which affects
Figure 3. Main changes in LULCC and LI (land use intensification) from an anthropic perspective and their classification relative to the sections of this paper.
the production and the exchange of certain compounds, as illustrated below by some examples.
3.1.1 Deforestation–afforestation
Deforestation has been practiced for tens of thousands of years for agriculture, grazing, cultivation, and urban purpose. However, over the last 33 centuries deforestation has drasti-cally increased, with around 12 million km2of forests cleared and 40 million km2remaining today (Ramankutty and Foley, 1999; Klein Goldewijk, 2001; http://www.fao.org/forestry/ fra/41256/en/, last access: 22 May 2019).
From a physical perspective, several studies investigated the effects on climate of deforestation, or of its opposite (af-forestation), mainly via a modelling approach. These studies compare the effects on climate of changes between current and pre-industrial potential vegetation, under the hypothesis of no human activities. Among its biogeophysical effects on climate, deforestation has contrasting effects on air tempera-ture that depend on the latitude and the vegetation types in-volved (Claussen et al., 2001; Snyder et al., 2004; Gibbard et al., 2005; Bala et al., 2007; Betts et al., 2007; Jackson et al., 2008; Davin and de Noblet-Ducoudré, 2010; Beltràn-Przekurat et al., 2012). At high latitudes, deforestation trig-gers a winter and spring surface cooling due to changes in the radiation budget that compensate, at the annual scale, for the summer warming resulting from decreased latent heat flux (i.e. evaporation). In particular in boreal regions, forest re-moval strongly increases the surface albedo. Indeed forests mask the snow as opposed to herbaceous vegetation (Chalita and LeTreut, 1994; Betts et al., 2001; Meissner et al., 2003; Randerson et al., 2006). At low latitudes, deforestation leads to a surface warming due to changes in the water cycle. Con-version of tropical rainforests to pasture lands (as in the Ama-zon Basin region) strongly modifies surface evapotranspira-tion and roughness since, compared to pasture lands, trees
have a higher surface roughness that enhances surface fluxes and thus the evapotranspiration cooling efficiency (Shukla et al., 1990; Dickinson and Kennedy, 1992; Lean and Rown-tree, 1997; von Randow et al., 2004; Nogherotto et al., 2013; Lejeune et al., 2015; Spracklen and Garcia-Carreras, 2015; Llopart et al., 2018). In the long term, reduced evapotran-spiration and precipitation may lengthen the dry season in the tropics, thereby increasing the risks of fire occurrence (Crutzen and Andreae, 1990). At mid-latitudes, both albedo and evapotranspiration mechanisms are at work and compete against each other, as recently confirmed by satellite-based observation analysis (Li et al., 2015; Forzieri et al., 2017). Although studies over the mid-latitudes show somewhat con-tradictory results and the effect on air temperature (warm-ing/cooling) remains unclear in temperate regions such as the Mediterranean Basin region and Europe (Gaertner et al., 2001; Heck et al., 2001; Anav et al., 2010; Zampieri and Lionello, 2011; Gálos et al., 2013; Stéfanon et al., 2014; Strandberg and Kjellström, 2019), in the Northern Hemi-sphere, the historical land cover change has very likely led to a substantial cooling (Brovkin et al., 1999, 2006; Bonan, 1997; Betts, 2001; Govindasamy et al., 2001; Bounoua et al., 2002; Feddema et al., 2005a), comparable in magnitude with the impact of increased greenhouse gases (Boisier et al., 2012; de Noblet-Ducoudré et al., 2012). However, a re-cent study combines present-day observations and state-of-the-art climate simulations and shows that historical defor-estation in North America and Eurasia has made the hottest day of the year warmer since pre-industrial times, contribut-ing to at least one-third of the local present-day warmcontribut-ing of heat extremes (Lejeune et al., 2018). In addition to modifying mean and extreme temperatures, deforestation–afforestation can also modify the hydrological cycle by enhancing or in-hibiting convective clouds and precipitation in the overlying atmospheric column. Some studies show an enhancement of shallow cumulus clouds over deforested lands in Amazonia
(Chagnon et al., 2004; Wang et al., 2009), while opposite results were found over deforested lands in southwest Aus-tralia (Ray et al., 2003). Two different mechanisms result from the interplay between the surface heat fluxes and the boundary layer structure (i.e. stability, temperature, and hu-midity): (1) dry soil and high sensible heat flux can increase the entrainment of cold air from the boundary layer top and finally increase shallow cloud cover by lowering the satu-ration threshold (Westra et al., 2012; Gentine et al., 2013). (2) Conversely, wet soil and high latent heat flux moisten the boundary layer and increase the relative humidity at its top in case of deforestation.
From a biological perspective, deforestation implies mod-ifications in surface moisture and temperature that in turn might directly or indirectly affect decomposition rates and nutrient mineralization in soils (Dominski, 1971; Stone, 1973; Stone, 1979; Classen et al., 2015; Manzoni et al., 2012; Chen et al., 2014; Townsend et al., 2011; Bonan, 2008). As a result, both carbon and nitrogen release to the envi-ronment are forecasted to increase. The forest floor decom-poses rapidly (Covington, 1976; Bormann and Likens, 1979) and, without forest regeneration, will eventually be partially eroded. The combination of increased decomposition (which consumes oxygen) and wetter soils (which slow oxygen dif-fusion) may also increase the occurrence of anaerobic mi-crosites within the soils, which might contribute to methane (CH4) emissions (Adji et al., 2014; Jauhiainen et al., 2016).
Nitrogen can be lost to the atmosphere through ammonia (NH3) volatilization, nitrous oxide (N2O) production
dur-ing nitrification (Bremner and Blackmer, 1978; Veldkamp et al., 2009), or denitrification to N2O or atmospheric nitrogen
(N2) (Firestone et al., 1980; Neill et al., 2005; Lammel et al.,
2015). Soil properties such as soil organic carbon or soil ni-trogen cycling respond to deforestation with a large spatial variety from one system to another (Powers and Schlesinger, 2002; Chaplot et al., 2010; de Blécourt 2013). However, the largest emissions of non-CO2greenhouse gases will
proba-bly result from agricultural use and management on defor-ested areas.
Finally, several studies show that there are feedbacks be-tween tropical forests and climate change (Bonan, 2008). Carbon dioxide fertilization, for example, could have a posi-tive effect by sustaining tropical forest growth (Lapola et al., 2009; Salazar and Nobre, 2010). This is exacerbated by N fertilization since tropical areas are not limited-N environ-ments and N is increasing through atmospheric deposition in non-tropical areas (Magnani et al., 2007; Sutton et al., 2008; Samuelson et al., 2008; Jackson et al., 2009). Zaehle et al. (2011) showed that N inputs increased C sequestration by ecosystems, and Churkina et al. (2007) attributed 0.75– 2.21 GtC yr−1during the 1990s to regrowing forests. How-ever Yang et al. (2010) showed that the contribution of N fertilization is lower for secondary forest regrowth (Jain et al., 2013).
As a direct effect, afforestation inevitably leads to car-bon loss from the system (Feddema et al., 2005b; Foley et al., 2005; Le Quéré et al., 2013; Houghton et al., 2012). However, large uncertainties remain on (i) how these al-tered ecosystems will react to induced global climate change (increased CO2 concentration, increased temperature, etc.),
(ii) changes in the emissions of non-CO2greenhouse gases
(N2O, CH4), and (iii) changes in the exchange of reactive
trace gases.
From a chemical perspective, afforestation directly affects BVOC emissions since trees are high BVOC emitters, as documented by Purves et al. (2004) over the eastern US by combining a BVOC emission model with vegetation changes as recorded by the USDA Forest Service Inventory Analy-sis (FIA) over surveyed forest plots. Over the target region, emissions of the main BVOCs (i.e. isoprene and monoter-pene) have increased, especially under heatwave conditions (i.e. daily air temperature above 35◦C), due to increase in
the forest leaf area mainly driven by human disturbance via harvesting and plantation management (i.e. often plantation forestry introduces high emitters), but as well by perturb-ing ecological succession with fires and pollution. Enhanced BVOC emissions from forests are likely to modify the NOx–
VOC–O3 regime; nevertheless the outcome critically
de-pends on the fate of isoprene nitrates, whether they are a ter-minal or temporal sink of NOx(Val Martin et al., 2015).
Con-cerning fine-mode aerosols, summer levels of PM2.5(i.e.
par-ticulate matter, PM, with aerodynamic diameters ≤ 2.5 µm) are predicted to increase with afforestation due to the forma-tion of biogenic secondary organic aerosols (BSOAs) from BVOCs (Heald et al., 2008; Trail et al., 2015; Val Martin et al., 2015). As with afforestation, deforestation to create pas-ture or crop lands can also exacerbate O3levels by
increas-ing NOx emissions from soil microbial activity, promoted
with fertilization (Ganzeveld and Lelieveld, 2004; Trail et al., 2015); in winter, the enhanced NOxlevels favour nitrate
aerosol production, while in summer deforestation decreases aerosol deposition, by reducing surface roughness. In conclu-sion, fine-mode aerosols such as PM2.5 may increase
year-round under deforestation (Trail et al., 2015).
Under an increasing demand and interest for fast-growing plants for food production, cattle feed, domestic products, and biofuels, plantations are rapidly expanding all over the world. The choice of crop or tree type influences BVOC emissions and the resulting O3 and BSOA levels (Hewitt
et al., 2009; Ashworth et al., 2012; Warwick et al., 2013; Stavrakou et al., 2014). This is the case of oil palm crops that show much larger BVOC emission potentials compared to primitive forests (from 3 to 10 times higher for isoprene; Hewitt et al., 2009, and Fowler et al., 2011). In South East Asia, increasing BVOC emissions from oil palm plantations interplay with increasing NOxemissions resulting from the
spread in mechanization, fossil fuel use, and fertilizer ap-plication associated with the oil palm industry. The com-plex interaction between BVOC and NOx finally enhances
O3 levels at local–regional scales (Goldammer et al., 2009;
Hewitt et al., 2009; Silva et al., 2016; Harper and Unger, 2018), with even transboundary effects (i.e. downwind re-gions) (Warwick et al., 2013). Similarly to South East Asia and oil palm production, the expansion of biofuel produc-tion in Europe could modify future LULC to satisfy the in-creasing demand for renewable energy sources (Beringer et al., 2011). Among biofuel feedstock, crops such as miscant-hus or second-generation plantations such as poplar show higher isoprene emission potential compared to European na-tive species. The conversion of European grass- and crop-lands into biofuel plantations may affect summer O3 levels
with effects that strongly depend on the interaction between BVOC and NOx emissions. For example, to limit the
ef-fects on O3production of a steep increase in isoprene
emis-sions (∼ 45 %) from conversion of 5 % of European grass-and croplgrass-ands into poplar plantation, NOxemissions should
be reduced by 15 %–20 % (Beltman et al., 2013). Regarding Europe, Ashworth et al. (2013) showed that the extension of short-rotation coppice for biofuel feedstock could have small but yet important impacts on surface O3
concentra-tions, and subsequently on human mortality and crop pro-ductivity, since it would modify emitted compounds and their levels. Being BSOA precursors, enhanced BVOC emissions from afforestation are also involved in particulate matter pol-lution.
Using a large-scale chemistry-transport model for present-day climate, Ashworth et al. (2012) investigated the impact of realistic large-scale scenarios of biofuel feedstock produc-tion (∼ 100 Mha plantaproduc-tions) in both the tropics and the mid-latitudes on isoprene emissions, O3, and BSOA formation.
These LULCCs drive an increase in global isoprene emis-sions of about 1 %, with a substantial impact on regional O3 levels and BSOAs. In the tropics, the expansion of oil
palm plantations enhances BSOAs by 0.3 µg m−3 (+3 %– 5 %, BSOA annual mean concentrations: 6–10 µg m−3). In the mid-latitudes, the establishment of short-rotation cop-pice increases BSOA concentrations up to 0.5 µg m−3(+6 %, from 8 µg m−3).
3.1.2 Wetland conversion–restoration
Although wetland drainage is a relatively small proportion of the world’s land surface, LULCC can have significant im-pacts on some areas. Wetland drainage for agriculture pur-poses has removed between 64 % and 71 % of natural wet-lands since 1900 (Davidson, 2014).
From a physical perspective, only few studies have evalu-ated its impact on local and regional climate. The most doc-umented case is that of south Florida (Pielke et al., 1999; Weaver and Avissar, 2001; Marshall et al., 2004a, b). During the 20th century, large wetland areas in south Florida were converted to large-scale crops (cereals), citrus growth, and fruit crops in general. Modelling studies show that current surface cover caused significant changes in temperature
ex-tremes with increased length of freezing events and increased magnitude of frost (lower temperature), which severely re-duced the agricultural production (Marshall et al., 2004a). During night-time, water vapour evaporates from the swamps and modifies the longwave radiation budget, resulting in a less rapid infrared cooling and less cooling by +2◦C than for the current (drained) case. A similar study over Switzerland shows opposite results (Schneider and Eugster, 2007). The conversion of wetlands to extensive farming caused a night-time warming and a daynight-time cooling of a few tenths of a de-gree Celsius. This temperature modification was explained by the alteration of soil thermal properties and by higher albedo in the current case. During the night-time, higher ther-mal conductivity of the current soils resulted in upward heat fluxes, which enhanced the temperature. In another vein, Mo-hamed et al. (2005) studied the effect of Sudd swamp on the Nile water flow and local climate. Due to the Sudd wetland, located in the upper Nile, a substantial amount of water is lost through evapotranspiration. In a drained Sudd scenario pro-duced by a numerical experiment, the Nile flow just down-stream the wetlands increases by 46 Gm3yr−1over a total of 110 Gm3yr−1. However, evapotranspiration decreases, caus-ing a temperature increase of +4–6◦C during the dry season. From a biological perspective, the drainage of peatlands and wetlands for agricultural use alters several characteris-tics of those areas and could thus be problematic (see Ver-hoeven et al., 2011, for a review). Especially in tropical ar-eas, peatland draining releases some extra CO2 by
oxidiz-ing and subsidoxidiz-ing peat soils used for growoxidiz-ing oil palms (Im-mirzi et al., 1992; Maltby and Im(Im-mirzi, 1993; Safford et al., 1998; Furukawa et al., 2005). Hoojer et al. (2006) es-timate the emissions from Indonesian peatland draining at 516 Mt C yr−1 (fires excluded). Conversely, since wetlands are a considerable source of CH4, their drainage will
de-crease emissions of CH4and can thus be considered a carbon
gain from that point of view (Bergkamp and Orlando, 1999; Maltby and Immirzi, 1993). However, this gain is counter-balanced by increased N2O emissions, due to the lowering of
the water table (Kasimir-Klemedtsson et al., 1997; Maljanen et al., 2010). On the other hand, changes in vegetation and therefore growth in those drained areas involve an increased carbon sink from vegetation. However, this additional sink rarely compensates for the greenhouse gas (GHG) losses re-sulting from C losses from the soil (Yeh et al., 2010; Yew et al., 2010).
From a chemical perspective, on top of decreasing CH4
emissions, wetland drainage may probably increase NOx
emissions, and modify emissions of other compounds such as BVOCs, due to vegetation change, which together could contribute to significant changes in the atmospheric chemi-cal composition. Overall, the impact of wetland conversion on compound emissions other than CH4and on atmospheric
3.2 Land intensification 3.2.1 Urbanization
Urbanization results in the replacement of (pseudo-)natural ecosystem vegetation by more or less dense and impervi-ous built-up environments. Human activities concentrated in these areas are responsible for additional heat and gaseous releases in the atmosphere. Consequently, these LULCCs sharply modify the atmosphere, in terms of both climatic conditions and gas composition, which ultimately affect land–atmosphere exchanges and biogeochemical cycles.
From a physical perspective, urbanization results in a mod-ification of surface radiative budget, energy balance, water balance, and land–atmosphere mass and energy exchanges (see Eqs. S1 to S5 in the Supplement), leading ultimately to (local) climate alteration in urban areas.
Firstly, urbanization affects each component of the radia-tive budget. On the one hand, the net radiation is potentially reduced due to the decrease in the incoming shortwave radi-ation that is screened out by a reflecting smog layer. In the dry season, in clear skies, Jauregui and Luyando (1999) ob-served that the incoming solar radiation over Mexico City was 21.6 % lower than its suburbs. This difference could in-crease up to 30 % under weak winds. However, the inten-sity of the reduction in incoming shortwave radiation was closely related to the day of the week (i.e. human activi-ties) and meteorology (e.g. temperature, humidity, solar ra-diation), which both influence photochemical smog forma-tion. Similarly, Wang et al. (2015) measured lower incoming shortwave radiation in Beijing compared to its surroundings, with values ranging between 3 % and 20 % depending on the season. Focusing on summer periods (June, July, August), Li et al. (2018) recorded lower S ↓ at urban stations compared to rural stations in the city of Berlin; the authors attributed this dimming effect to the thick aerosol layer observed over the city. Based on the analysis of global radiation measure-ments from the Global Energy Balance Archive (GEBA), Alpert et al. (2005) and Alpert and Kishcha (2008) showed a relationship between solar dimming, population density, and atmospheric pollution such as aerosols, which absorb and scatter the incoming solar radiation. Overall, Alpert and Kishcha (2008) demonstrated that at the surface shortwave radiation is 8 % lower in urban compared to rural areas. Moreover, the net radiation is also potentially reduced by the enhanced outcoming longwave radiation due to a warmer ur-ban environment (the so-called “urur-ban heat island effect”; see below) since infrared radiations depend on surface tempera-ture. On the other hand, urbanization also induces an increase in net radiation. Urbanization usually results in a decrease in surface albedo (α) and surface emissivities (εs) (Table 1),
fi-nally reducing both outgoing short- and longwave radiation. Although some building materials exhibit larger albedo and emissivity than (pseudo-)natural environments, most of them have lower ones, especially asphalt or other dark materials
(e.g. Li et al., 2013; Alchapar et al., 2014; Rahdi et al., 2014). Yet, at the city scale, outgoing short- and longwave radia-tion is scattered and absorbed multiple times within urban canyons (i.e. light-trapping effect), thus contributing to both outgoing short- and longwave radiation reduction. Overall, both effects tend to compensate for each other and only a few differences in Q∗ have been observed between urban and rural environments on a yearly average (Oke and Fug-gle, 1972; Christen and Vogt, 2004). Nevertheless, depend-ing on the seasons and time of the day, larger net radiation has been observed in urban areas during daytime and in win-ter, when snow covers surrounding rural areas (Christen and Vogt, 2004).
Secondly, compared to the surrounding areas, an urban en-vironment sharply modifies the way surface energy is dissi-pated (i.e. the energy partitioning between sensible and latent heat fluxes). In rural environments vegetation and pervious surfaces provide larger evapotranspiration rates (i.e. latent sensible heat flux), and therefore lower sensible heat flux, whereas in urban areas energy is mainly dissipated through sensible heat flux. A non-natural term, sensible heat flux, due to heat release by human activities (e.g. building heat-ing or coolheat-ing), adds to a natural sensible heat flux, fur-ther increasing sensible heat flux in urban areas (Arnfield, 2003). As a result, the Bowen ratio is amplified in urban areas (Table 1). Such a large dissipation of energy through sensible heat flux, which transfers heat from the surface to the air, leads to the so-called urban heat island (UHI) ef-fect, the most well-known alteration of (local) climate due to urbanization that corresponds to a warmer climate in urban environments compared to surrounding rural environments (around 2–3◦C). UHI is defined as a temperature difference
between the city and its surroundings, depending on the lo-cal land use. Nevertheless, UHI intensity is sharply variable according to the time of day (e.g. Pearlmutter et al., 1999), the season (e.g. Eliasson, 1996; Zhou et al., 2014), the ge-ographical location, spatial organization of the urban fabric (e.g. building size and density, human use, fraction of vege-tation) (e.g. Emmanuel and Fernando, 2007; Hart and Sailor, 2009), and rural land use (e.g. forests, crops, bare soil) (Chen et al., 2006). Recently, Yao et al. (2019) combined satellite-based observations of land surface temperature (LST) and enhanced vegetation index and showed that rural greening has contributed by +0.09◦C per decade (23 %) over the pe-riod 2000–2017 to the increase in daytime surface UHI inten-sity (i.e. urban LST minus rural LST). By modifying the lo-cal energy budget, urbanization modifies the boundary layer structure and lastly influences the water budget. Urban sig-natures (e.g. change in magnitude, intensity, and spatial pat-terns) have been observed in precipitation (see Shepherd, 2005, and Pielke et al., 2007, for a review on urban precip-itation). Moreover, complex urban terrain amplifies regional gradients in temperature, pressure, moisture, and wind that act as a source of vorticity for storm ingestion and develop-ment into tornadoes (Kellner and Niyogi, 2014). Moreover,
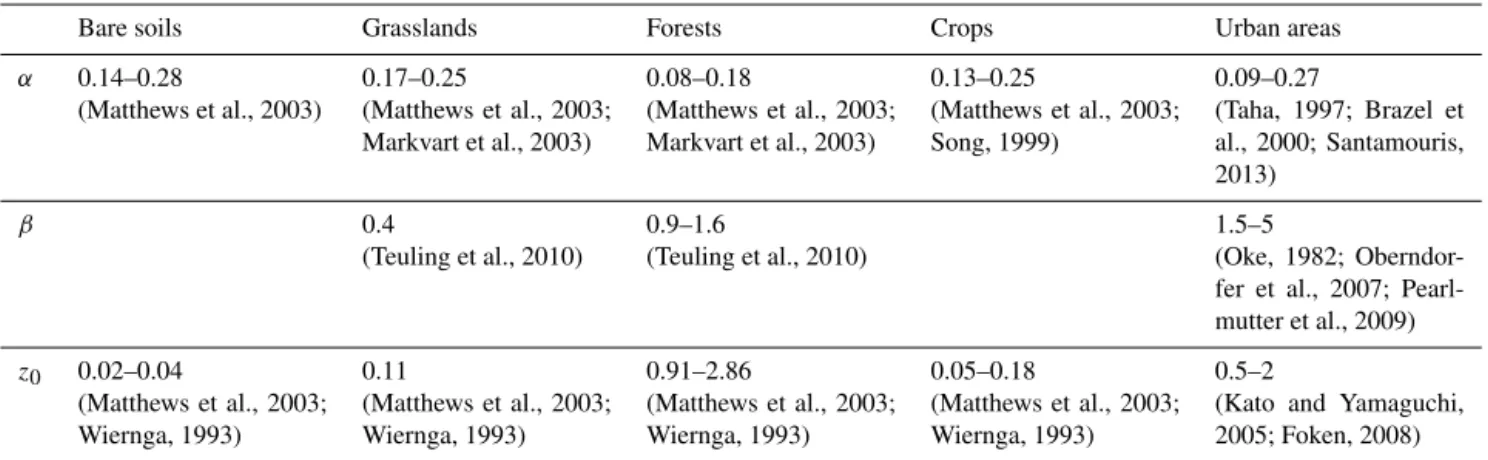
Table 1. Typical values of snow-free albedo (α – %), Bowen ratio (β – %), and roughness length (z0– m) for various surface land cover types.
Bare soils Grasslands Forests Crops Urban areas
α 0.14–0.28 (Matthews et al., 2003) 0.17–0.25 (Matthews et al., 2003; Markvart et al., 2003) 0.08–0.18 (Matthews et al., 2003; Markvart et al., 2003) 0.13–0.25 (Matthews et al., 2003; Song, 1999) 0.09–0.27 (Taha, 1997; Brazel et al., 2000; Santamouris, 2013) β 0.4 (Teuling et al., 2010) 0.9–1.6 (Teuling et al., 2010) 1.5–5 (Oke, 1982; Oberndor-fer et al., 2007; Pearl-mutter et al., 2009) z0 0.02–0.04 (Matthews et al., 2003; Wiernga, 1993) 0.11 (Matthews et al., 2003; Wiernga, 1993) 0.91–2.86 (Matthews et al., 2003; Wiernga, 1993) 0.05–0.18 (Matthews et al., 2003; Wiernga, 1993) 0.5–2
(Kato and Yamaguchi, 2005; Foken, 2008)
urban areas can attenuate, split, or deflect extreme storm events (e.g. Lorenz et al., 2019) and modify their intensity and occurrence. Over the Beijing metropolitan area, 60 %– 95 % of the selected weather stations show that the intensity and occurrence of extreme rainfalls have slightly decreased throughout 1975–2015, periods with consecutive rainy days (CRDs) have lengthened, and the Julian dates of daily max-imum precipitation have been delayed (Zhang et al., 2019). Furthermore, cities are important source of aerosols that help initiate thunderstorms (Haberlie et al., 2015). However, the joint study of UHI and urban pollution island is still in its infancy and the indirect radiative effect of aerosols (i.e. im-pact on cloud properties and formation) on UHI needs further investigations (Li et al., 2018).
To mitigate UHI-induced warming, vegetated or highly re-flective roofs are being integrated in the built environment and have received a growing interest in climate modelling studies. Cool roofs absorb less incoming shortwave radia-tion than dark roofs. They decrease the local and regional summer surface temperature by 0.1–0.9◦C (Millstein and Menon, 2011; Georgescu et al., 2012; Salamanca et al., 2016; Vahmani et al., 2016). Their impact on climate is not just limited to surface energy budget as, for example, precipi-tation decrease was put forward in a modelling framework (Georgescu et al., 2012). Benefits from green roofs are anal-ogous to cool roofs, as vegetation contributes to cooling via increased albedo and water evapotranspiration. In situ exper-iments with different species have surface temperature differ-ences up to 3◦C (MacIvor and LundHolm, 2011). However at the regional scale and over urban areas, simulated cooling is greater for the cool roofs relative to the green roofs be-cause of the vegetation seasonality and sensitivity to dryness (Georgescu et al., 2014).
From a biological perspective, at a local scale, the develop-ment of urban areas and the related activities directly affect air quality and local temperatures, which leads to modifica-tions in the biology of organisms. Studies based on the
anal-ysis of tree traits along an urban–rural gradient showed that tree growth and phenology are affected by the vicinity of an urban area mainly due to increase in temperature (Gillner et al., 2014; Mimet et al., 2009; Dale and Frank, 2014), CO2
concentrations (Calfapietra et al., 2010; Ziska and George, 2004), ozone deposition (Gregg et al., 2003; MacKenzie et al., 1995), and through the enhanced effect on air quality via the increased emissions of BVOCs (Calfapietra et al., 2013; Lathière et al., 2006). Recent studies have also focused on the effects of soil waterproofing in urban areas that reduce wa-ter availability and exacerbate wawa-ter stress in urban forests, significantly affecting growth (Vico et al., 2014; Volo et al., 2014; Scalenghe and Marsan, 2009).
From a chemical perspective, at local scales, urbanization directly affects both O3and aerosol levels by increasing the
number of emission sources on a limited area (e.g. traffic, do-mestic heating). In the literature, there is an increasing inter-est in the direct impacts of urbanization on air quality (spe-cial issues in the Atmospheric Chemistry and Physics jour-nal related to the Megapoli-Paris 2009/2010 campaign and the MILAGRO and the City-zen projects, Baklanov et al., 2011, 2018; Zhu et al., 2019; Ooi et al., 2019), with a special focus on O3 levels, summer pollution (Nowak et al., 2000;
Civerolo et al., 2007; Jiang et al., 2008), and the role of urban trees in O3pollution via BVOC emission changes
(Chamei-des et al., 1988; Cardelino and Chamei(Chamei-des, 1990; Corchnoy et al., 1992; Benjamin et al., 1996; Taha, 1996; Benjamin and Winer, 1998; Yang et al., 2005; Taha et al., 2016; Livesley et al., 2016; Churkina et al., 2017; Bonn et al., 2018).
Increase in urban LU following population growth exac-erbates O3pollution during summer, mainly due to changes
in NOx emissions (Zhu et al., 2019). In the greater
Hous-ton area (Texas), under a projected increase in urban LU by 62 %, together with changes in anthropogenic and bio-genic emissions, the number of extreme O3days in August
rose by up to 4–5 days, with LUCs contributing to a 2– 3 d increase (Jiang et al., 2008). In the greater New York
City region, future urban LU changes may enhance episode-average O3 levels by about 1–5 ppb and episode-maximum
8 h ozone levels by more than 6 ppb (Civerolo et al., 2007). In metropolitan regions, changes in O3 levels show a
het-erogeneous spatial pattern: they decrease in the urban core, likely due to high NOxlevels (O3titration), while they
gener-ally increase downwind of precursor sources (Civerolo et al., 2007; Jiang et al., 2008). In an urban environment, BVOC emissions from urban trees seem to have a negligible effect on summer O3levels (< 1 ppb compared to increases of 1–
7 ppb due to urban LUCs; Nowak et al., 2000, vs. Jang et al., 2008). However, the effect of urban green areas on BVOC emissions and O3pollution depends on tree species (Taha,
1996; Taha et al., 2016); for this reason, the choice of ur-ban trees based on their BVOC potential may be addressed as a critical urban land management practice (Benjamin et al., 1996; Benjamin and Winer, 1998; Churkina et al., 2015; Calfapietra et al., 2015; Grote et al., 2016). For example, in Beijing, deciduous trees dominate (76 %) and some of the main species are high BVOC emitters (e.g. Sophora Japon-icaL., Populus tomentosa L., and Robinia pseudoacacia L.), which may favour a worsening in O3 pollution due to the
rapid increase in NOx emissions (Yang et al., 2005). In the
Los Angeles metropolitan area, Corchnoy et al. (1992) mea-sured BVOC emission rates of 11 tree species to underpin the selection of potential shade trees, whose planting should reduce the urban heat island effect. Accounting for Califor-nia climate, the authors suggested the best (e.g. crape myr-tle and camphor tree) and poor (e.g. liquidambar and car-rotwood tree) choices for urban trees, and underlined that a large difference in BVOC emissions should be factored into decision-making about shade trees to plant. In California’s South Coast Air Basin, medium- and high-emitting trees may lead to hazardous O3levels (> 50 ppbv) (Taha, 1996). In the
same geographical area, the most effective scenario to reduce the peak ozone involves replacing 4.5 Mha of high BVOC emitters with low BVOC emitters, while to target all-hour ozone the best choice consists in planting 2.5 Mha of low BVOC emitters in urbanizing areas and switching 4.5 Mha from high- to low-emitting species (Taha et al., 2016). It is important to emphasize that, although BVOC concentrations are usually lower than anthropogenic volatile organic com-pound (AVOC) concentrations in urban areas, BVOCs react faster than AVOCs and can thus have significant effects in ur-ban areas, as shown by Chameides et al. (1988) in the Atlanta metropolitan region.
At the regional scale, Chen et al. (2009) demonstrated that LULCCs can offset the impact of temperature on bio-genic emissions and concluded that LULC evolution should be factored in the study of future regional air quality. Other than land use, land cover, and land management changes (LULCCs and LMCs) discussed here, changes in climate conditions and anthropogenic pollutant emissions (e.g. due to “clean air” policies) directly and indirectly influence air quality and interact in a non-linear fashion with LULC and
LMCs; for this reason the climate–emission–land system should be considered as a whole when studying changes in surface O3and aerosols.
3.2.2 Agriculture intensification
The main aim of agricultural management is to increase pro-ductivity and therefore has an immediate effect on the agri-cultural ecosystem functioning (Tillman et al., 2002). Most of these agricultural practices will also have direct or indirect impacts on the environment other than the biosphere (e.g. at-mosphere, water, soils) (Sutton, 2011). Agricultural intensi-fication also enhances the export of organic matter from the affected ecosystems with consequences such as the reduc-tion of carbon and nitrogen cycling and soil degradareduc-tion and erosion (Mattson et al., 1997; Ruysschaert et al., 2004). Ex-amples of agricultural intensification are the conversion of pasture or grasslands into agricultural land or including rota-tions of agricultural and grasslands.
Irrigation
From a physical perspective, among land management prac-tices, irrigation is one of the most common all over the world, and it significantly modifies the surface water and energy budget. The amount of additional water put into the soils tends to increase the latent heat flux at the expense of sen-sible heat flux, leading to an irrigation cooling effect (ICE) of the ambient air. In California, for example, this effect was observed during daytime over a long-term dataset and esti-mated to several degrees (−1.8 to −3.2◦C since the begin-ning of irrigation – Lobell and Bonfils, 2008; Bonfils and Lobell, 2007). However, there are two opposite indirect heat-ing effects. First, the high-albedo desert is converted into a low-albedo vegetated plain (Christy et al., 2006), which results from a combination of crop planting and irrigation and can therefore be classified as a land cover change rather than an agricultural intensification. Second, the greenhouse warming is enhanced due to the increase in water vapour. The greenhouse effect is less important than the transpiration effect on temperature and dominates during the night-time. Several modelling studies assess both greenhouse and tran-spiration effects (Boucher et al., 2004; Sacks et al., 2009; Puma and Cook, 2010; Cook et al., 2011, 2015; Kueppers and Snyder, 2012) and highlight that locally the ICE may have partly masked the 20th century climate warming due to increased greenhouse gases (Kueppers et al., 2007). Meteo-rological studies suggest that irrigation can also lead to an in-crease in summer cloud cover and precipitation, as observed over the Great Plains region in the United States, down-wind of the major irrigation areas (Segal et al., 1998; Ade-goke et al., 2003; DeAngelis et al., 2010). In China, paddy cultivation requires water to stay on the ground during the rice-growing season, leading to a moistening of the land sur-face, an increase in the latent heat flux, and a decrease in the
near-surface temperature from May to July in the Sichuan Basin (Sugimoto et al., 2019). Thiery et al. (2017) demon-strated that irrigation influences temperature extremes and leads to a pronounced cooling during the hottest day of the year (−0.78 K averaged over irrigated land). In addition, this impact of irrigation on temperature is not limited to an agri-cultural environment as the same cooling effect has also been reproduced for urban irrigation in a water-scarce region (Los Angeles area), with the largest influence in low-intensity res-idential areas (average cooling of 1.64◦C) (Vahmani and Hogue, 2015). Affecting soil moisture and surface tempera-ture, changes in irrigation could also affect soil processes and exchanges of greenhouse gases and chemically reactive com-pounds between the surface and the atmosphere (Liu et al., 2008). Performing irrigation experiments on the Inner Mon-golian steppe, Liu et al. (2008) observed a significant sensi-tivity of the ecosystem CO2respiration to increased water
in-put during the vegetation period, whereas the effects on CH4
and N2O fluxes were much more moderate. In order to study
the impact of irrigation on ozone and pollutants in the Cen-tral Valley of California, Li et al. (2016) implemented an ir-rigation method in the model WRF-Chem and showed an in-crease in surface primary pollutant concentrations within the irrigation zone. They also calculated an enhancement in the horizontal transport of ozone and other pollutants from irri-gated to unirriirri-gated areas near the ground surface. However, few studies have been published so far on this topic from a biological or chemical perspective, and the effect of irriga-tion on biological processes or on the atmospheric chemical composition therefore remains poorly quantified.
Fertilization
Since the Second World War, the use of synthetic N fertil-izers largely increased, with half of the quantity ever used being applied in the last 20 years (Erisman et al., 2007). The growth of nitrogen fertilization threatens water sources (e.g. eutrophication of surface waters, pollution of groundwater, acid rains), soils (e.g. soil acidification), climate via GHG emissions, and air quality.
Few studies have investigated the impact of fertilizer use from a physical perspective, and yet physical interactions between the surface and the atmosphere could be affected. Based on a long-term experiment of fertilizer and amend-ment application running for 70 years, Pernes-Debuyser and Tessier (2004) observed that physical properties of plots were significantly affected, especially those related to soil–water relations. In spite of the preservation of their porosity, plots became more sensitive to the degradation of their hydraulic properties. Similarly, Hati et al. (2008) showed, in the case of an intensive conventional cultivation in subhumid tropics in India (acidic Alfisols), the importance of soil management practices in maintaining the soil physical environment, with a potential impact on soil aggregation, soil water retention, microporosity, available water capacity, or bulk density.
From a biological perspective, the additional source of nitrogen has different impacts on the atmosphere, mainly linked to an increase in reactive nitrogenous emissions (NH3,
NOx) (Fowler et al., 2009, 2013; Galloway et al., 2003) but
also in emissions of a GHG such as N2O. Increase in
produc-tion also affects leaf area index and plant height and there-fore surface properties and physical exchanges with the at-mosphere. Finally, fertilization also influences soil micro-bial characteristics and, consequently, exchanges of several gaseous compounds (Marschner et al., 2003; Cinnadurai et al., 2013; Joergensen et al., 2010; Murugan and Kumar, 2013). Grassland usually stores considerable amounts of car-bon in the soils, mainly due to a permanent plant cover and to a relatively large below-ground biomass (Bouwman, 1990; Casella, 1997). However, the amount of stored carbon and the emission of greenhouse gases depend on the management of this grassland (ploughing, fertilization, pasture, etc.) (Sous-sana et al., 2004; Lal, 2004) and on climatic conditions (Hu et al., 2001). Some studies suggest that increased nitrogen fer-tilization can enhance C storage in grassland. Conversely, ni-trogen fertilization increases leaching and emissions of N2O
and other nitrogen species (e.g. NH3, NO) to the atmosphere,
with negative consequences on air quality (Flechard et al., 2005; Senapati et al., 2014; Chabbi et al., 2015).
From a chemical perspective, the increase in NH3
emis-sions to the atmosphere can have a serious impact on air quality through the formation of secondary organic aerosols. Agricultural practices and techniques that reduce the evapo-ration of manure and urea and the use of N fertilizers help in lowering ammonia emissions from agriculture as docu-mented in Europe, where 90 % of the total ammonia emis-sions come from agriculture (−9 % over 1990–2002; Eris-man et al., 2008). In China, where N fertilizer application rose by 271 % over the 1977–2002 period, with an increase of 71 % only in grain production (Ju et al., 2009), Ju et al. (2009) suggested reducing N application rates by 30 %– 60 %. This agricultural management practice would still en-sure crop yields and N balance in between rotations and would reduce economical costs for farmers, while substan-tially reducing N losses to the environment.
Soil surface conditions
From a physical perspective, several crop management tech-niques (e.g. cover crops, double-cropping, no tillage) have a direct effect on regional climate through changes in surface– atmosphere fluxes and surface climate conditions, and are considered among geoengineering options. When tillage is suppressed, crop residues are left on the field, resulting in two counteracting mechanisms: albedo increases while evapora-tion reduces (Lobell et al., 2006; Davin et al., 2014; Wilhelm et al., 2015). Surface albedo increases by 10 % and lowers hot temperature values by about 2◦C; however the effect on the mean climate is negligible. Climate effect of two grow-ing seasons per year has been largely untested. Only Lobell et
al. (2006) have shown via modelling that this experiment has a small impact on temperature on multi-decadal timescales when compared to practices as irrigation. However, more re-cently Houspanossian et al. (2017) have observed through satellite imagery a difference in reflected radiation between single and double-cropping of up to 5 W m−2. Similar to a tillage/no-tillage mechanism, differences over South Amer-ica were induced by a longer fallow period in the simple cropping case. Seed-sowing dates also likely plays a role in surface energy balance, due to the modification of the grow-ing season length (Sacks and Kucharik, 2011).
Among agriculture practices, as an alternative to biomass burning and natural decomposition, the use of charcoal from biomass pyrolysis to enrich soils may reduce CO2emissions.
However, as a side effect, the resulting darker soil increases the local radiative forcing through albedo change and off-sets the sequestration effect up to 30 % according to Bozzi et al. (2015), who carried out the analysis based on observa-tions of agricultural field albedo. Biochar has similar effects (Usowicz et al., 2016; Meyer et al., 2012).
From a chemical perspective, fallow lands are potential sources of dust and coarse aerosols (PM10), especially in
re-gions where gusty winds dominate. Insufficient crop residues on the surface and finely divided soils by multiple tillage operations expose fallow land to wind erosion, thus con-tributing to poor air quality (López et al., 2000; Sharrat et al., 2007). In addition, wind erosion is likely to reduce crop yields by removing the richest fraction of soils, reducing the water-holding capacity of soils and enhancing soil degra-dation. Compared to conventional tillage (i.e. mouldboard ploughing followed by a compacting roller), alternative or reduced tillage practices (e.g. chisel ploughing) prevent wind erosion during fallow periods in semiarid Aragon (López et al., 2007). In addition, reduced tillage improves soil pro-tection by lowering the wind-erodible fraction of soil sur-face (−10 %), increasing fraction of soil covered with crop residues and clods (+30 %), and enhancing soil roughness (15 % compared to 4 % under conventional tillage). These agricultural practices therefore have the potential to modify aerosol sources by modifying the state of surfaces.
From a biological point of view, the conditions of the soil surface and the management of crop residues highly affect soil quality as well as the functioning and the abundance of soil microorganisms (Smith et al., 2015, 2016). In terms of exchange with the atmosphere, this results in soil structural changes affecting soil porosity and directly influencing the emissions of NOxand BVOCs (Gray et al., 2010; Bertram et
al., 2005). Effects can also be seen on soil organic matter con-tent and degree and rate of decomposition therefore affecting emissions of several nitrogen compounds therefore affecting GHG balance (emissions of N2O vs. storage of carbon) (Xia
et al., 2018) and air quality (NH3, NOx emissions) (de
Rui-jter et al., 2010). Conversely, soil surface conditions also in-fluence the deposition of O3(Stella et al., 2019) and
poten-tially other highly reactive atmospheric compounds such as pesticides (Alletto et al., 2010).
Fire
Fire is still largely used as a traditional agricultural practice (e.g. slash-and-burn agriculture, pest control, promotion of the growth of fresh grass for grazing) and to convert forests to pasture/croplands, especially in tropical regions (Yevich and Logan, 2003). On a local scale, intensive mechanized grain agriculture reduces the use of fire. However, the wealth generated from intensive agriculture may be reinvested in tra-ditional extensive land uses that promote fire (Wright et al., 2004).
Generally, fires can impact soil colour, pH, bulk den-sity, and soil texture, and are therefore critical for physi-cal surface–atmosphere exchanges, together with biologiphysi-cal properties of soil such as species richness and microorganism content (Thomaz et al., 2014; Verma and Jayakumar, 2012; Savadogo et al., 2007). However the impact of fires from a physical or a biological perspective has been poorly investi-gated, especially regarding the long-term effect (Dooley and Treseder, 2012; Pressler et al., 2019).
From a chemical perspective, fire has impacts on both pho-tochemical pollution (O3 production) and aerosol loading.
During fire episodes, O3production switches from a
VOC-sensitive regime in nascent smoke plumes (i.e. first hours of burning and close to the ignition point) to a NOx-sensitive
regime as the plume ages. In nascent smoke plumes NOx
levels are high and photochemical activity is low. Smoke plume ageing decreases NOxlevels via atmospheric dilution
and chemical reactions, resulting in increased O3production
(e.g. Jost et al., 2003; Trentmann et al., 2003; Yokelson et al., 2003; Mason et al., 2006; Singh et al., 2012). During fire episodes, O3 levels may reach hazardous values, with
the 8 h average O3 concentration often exceeding air
qual-ity standards (around 50–75 ppbv; Bytnerowicz et al., 2010). Fires also release huge amounts of both coarse- and fine-mode aerosols, leading to concentrations that largely exceed background levels (Phuleria et al., 2005; Hu et al., 2008) and that substantially affect visibility (Val Martin et al., 2015). Over Singapore, Indonesian fires caused the average daily minimum horizontal visibility to decrease, firstly, to less than 2 km, and later to 500 m (Goldammer et al., 2009). Fire emis-sions encompass aerosol precursors such as NH3and BVOCs
as well.
Forest management
Forest management mainly relies on tree species selection, fertilization, litter raking, thinning, and clear-cutting (Eriks-son et al., 2007), together with planting and harvest types, burning, and understory treatment.
From a physical perspective, along with crop management, forest management could have a similar impact on local