HAL Id: hal-03030822
https://hal.archives-ouvertes.fr/hal-03030822
Submitted on 30 Nov 2020
HAL is a multi-disciplinary open access
archive for the deposit and dissemination of
sci-entific research documents, whether they are
pub-lished or not. The documents may come from
teaching and research institutions in France or
abroad, or from public or private research centers.
L’archive ouverte pluridisciplinaire HAL, est
destinée au dépôt et à la diffusion de documents
scientifiques de niveau recherche, publiés ou non,
émanant des établissements d’enseignement et de
recherche français ou étrangers, des laboratoires
publics ou privés.
Corrosion behavior of carbon steel in presence of
sulfate-reducing bacteria in seawater environment
Marko Stipaničev, Florin Turcu, Loïc Esnault, Elmar Werner Schweitzer,
Renate Kilian, Régine Basséguy
To cite this version:
Marko Stipaničev, Florin Turcu, Loïc Esnault, Elmar Werner Schweitzer, Renate Kilian, et al..
Cor-rosion behavior of carbon steel in presence of sulfate-reducing bacteria in seawater environment.
Elec-trochimica Acta, Elsevier, 2013, 113, pp.390-406. �10.1016/j.electacta.2013.09.059�. �hal-03030822�
OATAO is an open access repository that collects the work of Toulouse
researchers and makes it freely available over the web where possible
Any correspondence concerning this service should be sent
to the repository administrator:
tech-oatao@listes-diff.inp-toulouse.fr
This is an author’s version published in:
http://oatao.univ-toulouse.fr/2
5255
To cite this version:
Stipaničev, Marko
and Turcu, Florin and Esnault, Loïc and
Schweitzer, Elmar Werner and Kilian, Renate and Basséguy,
Régine
Corrosion behavior of carbon steel in presence of
sulfate-reducing bacteria in seawater environment.
(2013)
Electrochimica Acta, 113. 390-406. ISSN 0013-4686.
Official URL:
https://doi.org/10.1016/j.electacta.2013.09.059
Corrosion behavior of carbon steel in presence of sulfate-reducing
bacteria in seawater environn1ent
Marko Stipanicev
a,
c,
•
. Florin Turcu
a. Loïc Esnault
a. Elmar Werner Schw
e
itzer
b.
Rena te Kilian
b. Régine Basseguy
c• Det Norske Veritas,Johan Berentsens vei 109-111, Laksevag, 5163 Bergen, Norway
b AREVA GmbH, PTCM-G, Pau/-Gossen-Str. 100, 91052 Erlangen, Germany
'Laboratoire de Génie Chimique CNRS-/NPf,4 Allée Emile Monso, 31432 Toulouse, France
Keywords:
Seawater
Carbon steel
Corrosion
SRB
1. IntroductionA B S TRA CT
The influence of sulfate-reducing
bacteria (SRB) on the corrosion behavior of carbon steel was studied
in
alabor
atory test-loop, continuously fed with nutrient supplemented North Se
ase
aw
ater. The m
ain
parts of the test-loop, represented
by two sep
arated flow cells, were fitted with steel specimens. The test
loop was operating anoxically for
2200h and each flow cell was three times inoculated with
Desulfovîbrio alaskensîsor
Desulfovîbrio desulfuricansspe
cies. Additionally, e
ach flow
cell was two times perturbed with
antimi
crobial treatments. S teel specimens exposed in flow
cells exhibited
compar
able
appear
an
ce
and
systems responding simil
arly to inoculations and
antimicro
bi
al treatments. The effect of the inocul
ations
in both flow cells on the steel coupons electrochemical beh
avior w
as materialized as lower resistance
to
corrosion and higher surface a
ctivity or occurrence of localized pitting events. The localized surfa
ce
att
acks recognized in both flow cells after inoculations continued to progress with the time, although
bacteri
al activity was temporarily suppressed by
antimicrobi
al tre
atment. Post-exposure sample evalu
ations might suggest that, some particular steel surface areas have been subjected to a dramatic change
in the corrosion me
chanism from initi
al loc
alized
atta
ck to general
corrosion. The long-term exposure
of the
carbon steel spe
cimens resulted in identifi
able formation of biofilms
and
corrosion products. Cor
rosion deposits were
char
acterized
by a specific structure built of iron sulfides (FeS), sulfated green rust
(GR(S0
42-)), magnetite (Fe
3Ü
4), Fe(III) oxyhydroxides (FeOOH), chukanovite (Fe
2(0H)
2C0
3). carbonated
green rust (GR(C0
32-)) and some
calcareous deposits. Presented factual evidence reinfor
ced the idea that
sulfidogeni
cspecies in natural se
awater environment m
ay c
ause localized dam
age with a spe
cific surfa
ce
pattern; however, this does not necessarily lead towards signifi
cantly elev
ated corrosion rates.
Internai corrosion causes immense damages to the carbon
steel offshore infrastructures such as pipelines and water injec
tion systems. A significant part of the carbon steels degradation
can be attributed to micro- and macro-environmental conditions
alterations by sulfidogenic, e.g. hydrogen sulfide (H
2S) producing,
microorganisms
(1)
. The most recognized group of sulfidogenic
microorganisms are sulfate-reducing bacteria (SRB) and they are
regarded as the main culprits of anaerobic corrosion in seawater
system.
including
Desulfovibrio desulfuricans
ATCC 27774 and
Desulfovib
rio
alaskensis
ALl, are performing dissimilatory reduction of sui fur
compounds such as sulfate (Soi-). sulfite (S0
3-), thiosulfate
2(S
20
32-), polythionate (Sn06
2) and sulfur (S) itself to sulfide (S
2-),
that, combined with oxidized molecular hydrogen, forms volatile
H
2S negatively impairing ferrous metals
(2-4)
.
Anaerobic corrosion is a well-understood process, exclusively
controlled by the oxidizing agent/proton transfer to metal surface.
However, in biotic environments different explanations were sug
gested in order to expia in anaerobic corrosion process that resulted
in elevated corrosion rates. During past few decades multiple the
ories explaining corrosion mechanisms were suggested by taking
into account SRBs metabolic activities and formation of different
sulfide based compounds.
Within the marine biofilm matrix, SRBs thrive, finding favorable
conditions inside pre-established anoxie niches. ln general, SRB
* Corresponding author. Tel.: +47 95936347.
E-mail addresses:
Marko.Stipanic
e
v@dnv.com, marko.stipanicev@gmail.com
(M. Stipanicev).
Earlier work evoked a cathodic depolarization model of ferrous
me tais based on the removal from the surface of atomic hydrogen
by SRBs
(5)
and/or hydrogen consumption thanks to a hydroge
nase enzyme
(6-9)
. This hypothesis was investigated and can be
approved only if the reaction step for forming atomic (and then molecular) hydrogen is not rate-limiting as it is the case in pres-ence of weak acid, especially when phosphate protonated species are involved[10,11]; it was then proved that bacterial hydrogen uptake merely stimulates corrosion in certain anaerobic envi-ronments [12]. Furthermore, by reducing sulfate in sulfide, SRB promotes the conditions for precipitation of iron sulfide (biominer-alized FexSy, particularly FeS), which next catalyzes proton/water
reduction into molecular hydrogen and acts as a cathode in a galvanic couple with metallic iron[13–15]. What’s more, direct products of SRB metabolism, e.g. H2S, can affect metal surface
directly by decreasing pH locally and promoting differential cell resulting with localized events on metal surface[16]. Metal ion chelating by extracellular polymeric substances (EPS) is also some-times dealt with[17]as well as galvanic coupling resulting EPS selective metal binding capacity [18]. To sum-up such a com-plex marine biofilm/corrosion products/metal interface, overlapping of proposed mechanisms should be considered rather than one specific mechanism[19]. It is often observed that the microenvi-ronment generated within marine biofilms rich in SRB is favoring electrochemical reactions that may lead to localized destructive surface events[20]. Nevertheless, besides its detrimental impact on steel integrity, the biomineralization process occurring on steel sur-faces can be under favorable circumstances beneficial thought the formation of protective corrosion products layers that can suppress the local corrosion processes[21].
Even though SRBs are recognized as the most imminent species taking part in microbiologically influenced corrosion (MIC), micro-bial consortiums in marine biofilms are usually heterogeneous and therefore deterioration of metal should be affected by interac-tions of the whole community[22]. Some of the microorganisms commonly found in marine environments, such as acid producing bacteria (APB) of the genera Clostridia [23,24] or Anaerobacu-lum [25], can be characterized by metabolic process capable of generating multiple, aggressive chemical species for ferrous metals, such as H2S and CO2. Furthermore, when dealing with MIC, it is
required to take into consideration effect of other bacteria than SRB inside marine biofilms and possible quorum sensing effect, which according to authors knowledge, is still neither well investigated nor well defined.
Besides the evaluation of the bacterial load, the relevant characteristics of the metallic substrate, whose corrosion resistance in presence of microorganisms is investigated, must be known or taken into consideration. Carbon steels, often used in Oil and Gas (O&G) industry, are characterized by homogenous distribution of geometrically small grains that have short grain boundaries. This particular microstructure may result in surface susceptibility to equally allocated localized corrosion attack. For carbon steels, most common metallographic structures are ferrite (ferrous phase) and perlite (lamellar structure of ferrite and Fe3C), with nonmetallic
inclusions, e.g. manganese sulfide (MnS) inclusions randomly dis-tributed over the steel surface. These MnS inclusions have been postulated to serve as seeds for pitting corrosion[26,27]. Recently, different studies showed a correlation between pit initiation and propagation associated with sulfide inclusions and their relation to MIC[28].
In order to get better insight in the complexity of systems such as biofilms, and their interactions with carbon steel sur-faces, taking advantages of multiple analytic techniques may be useful. Currently, electrochemical techniques such as open circuit potential (OCP), linear polarization resistance (LPR) and electro-chemical noise (EN) are widely employed for studying general and localized surface events in the presence of the bacteria and biofilms [29,30]. More precisely, LPR is often used to monitor corrosion by measuring “instantaneous” general corrosion rate[31], taking additional precaution due to the limitation of Stern–Geary theory,
which is not valid for the diffusion-controlled systems that are often established in presence of biofilms. Localized events (pit-ting, crevice, stress corrosion. . .) are studied by electrochemical noise (EN). Iverson originally applied electrochemical current noise (ECN) and electrochemical potential noise (EPN) fluctuations as a tool for MIC studying and monitoring[32,33]. Until now, obser-vations of the modulated current and potential signals patterns as well as the characteristic transients in the time records were successfully used for detection of stable and metastable localized surface events in the presence of bacteria and/or biomineralization products[31,34,35].
In the investigation reported herein, corrosion behavior of S235JR carbon steel was studied in the modified North Sea sea-water that was multiple times inoculated with one of two different SRB pure cultures, D. alaskensis AL1 or D. desulfuricans ATCC 27774, and subjected to antimicrobial treatment. LPR and EN techniques were used in order to study general corrosion, and for identi-fication of localized events on steel surfaces. Scanning Electron Microcopy (SEM) and Energy-Dispersive X-Ray (EDX) spectroscopy were used to investigate biomineralization products and processes governed by presence of bacteria. Surface deterioration and influ-ence of microstructure on degree and location of corrosion attack were investigated by means of optical microscopy.
2. Methodology, materials and methods 2.1. Continuously fed with fresh media test loop
The main components of the continuously fed with fresh media test loop (also called “once-through” flow loop) were manufactured in-house and consist of two bioreactor vessels placed one behind the other and two in parallel cylindrical flow-through cells. The “once-through” flow loop set-up is depicted inFig. 1.
The bioreactor vessels are made of polypropylene. The acryl lid, used for closing bioreactor vessels, is fitted with an optical oxygen-dipping probe, a temperature sensor interfaced with Fibox 3 fiber optic oxygen transmitter (Presens, Germany), one gas inlet, one gas outlet and a pH electrode (pH-meter HI-9125N, Hanna Norden AB, Sweden). The lid also incorporates an in-house fitted sampling/fluid injection point. The first bioreactor vessel body was fitted with one fluid injection inlet. Each bioreactor vessel was equipped with one fitting accommodating Teflon tube (Swagelok, UK) via which the two bioreactor vessels were connected. The second bioreactor vessel was also equipped with a heating unit (ISOPAD IP-DASI®,
Tyco, USA) and a thermostat (Raychem®AT-TS-14, Tyco Thermal
Controls, USA).
A peristaltic pump (W–M 520SN/REL, Watson–Marlow, UK) drew media from the second bioreactor vessel, and the output flow was split between the two flow cells. Perfluoroalkoxy tubing (PFA-T8-062-50, Swagelok, UK) was used. Two regulation needle valves (PFA-4RPS8, Swagelok, UK) were installed before and after each flow cell. Flow cells were made from acrylic tubes (6 cm inner diameter, 1 cm wall thickness and 34 cm length) and acrylic plates (5 cm× 34 cm × 0.5 cm). Twelve pairs of feedthroughs (M20 size fittings, produced by OBO Bettermann, Germany) were installed on the top of each flow cell. A schematic drawing of a flow cell showing its cross section and distribution of feedthroughs is presented in Fig. 2. Electrodes (working—WE, counter—CE and reference—Ref) for electrochemical measurements were installed in the two flow cells, in identical arrangements at 12 o’clock positions. An in-house manufactured liquid sampling port (SP) that accommodated dipping oxygen probe was installed at F10 position in each flow cell. To monitor biofilm formation, ten car-bon steel specimens (rectangular plates with dimensions of a 1 cm× 1 cm × 0.2 cm) were installed at 6 o’clock position in each flow cell.
Fig. 1. The continuously fed with fresh media test loop.
Fig. 2. Scheme, cross-section and fitting distribution of cylindrical flow-through cells, e.g. flow cells.
The entire “once-through” flow loop was constructed from polymers to minimize contamination with exogenous metal ions. Furthermore, materials, including perfluoroalkoxy (2 mm thick-ness), polyolefin (1 mm thickthick-ness), polypropylene (2 cm thickness) and acrylic (0.5 cm and 2 cm thickness) polymers with minimal oxygen permeability and minimal deterioration under test condi-tions were chosen.
Prior to operation the bioreactor loop was flushed with tech-nical grade alcohol (Kemetyl Norge AS, Norway) and flow cells were exposed for 24 h under UV light (wave length 256 nm: XX-15, sterilization UV lamp, UVP, USA). Then, the first bioreactor vessel was filled up with 40 L of seawater, and oxygen was decreased to a level of 30–40 ppb by purging with 90/10 (v/v)% N2/◦O2gas
mixture (Yarapraxiar, Norway) for 24 h. Deareated seawater was then transferred into the degassed second bioreactor vessel where the medium was supplemented with acetate (Merck, Germany)
and lactate (Sigma-Aldrich, Germany) up to final concentrations of 10mol L−1. Anoxic conditions (10–20 ppb) were established by
purging the medium with 90/10 (v/v) % N2/CO2 gas mixture for
72 h. Moreover, the temperature was controlled automatically at 28◦C± 2◦C during whole duration of test. The medium pH inside the second bioreactor vessel was adjusted with phosphate buffer (Sigma-Aldrich, Germany) to values in range of 7.9 to 8.1 before being distributed into the two separated flow cells. The flow system was then activated with a flow rate maintained at 1.57 mL min−1, the lowest possible value for the pump. The continuously fed with fresh media test loop was operated continuously for the next 2200 h. Three time inoculations (with 100 mL at te= 792 h, te= 936 h
and te= 1056 h) were performed using pure culture of D. alaskensis
strain AL1 in flow cell A and D. desulfuricans strain ATCC 27774 in flow cell D. Prior to each inoculation, flow cells were isolated from the rest of the loop by closing regulation valves. Flow conditions were reestablished 24 h after each inoculation. Moreover, each flow cell was two times treated with 50 min batch antimicrobial treat-ment, first after the third inoculation, at te= 1075 h and second time
at te= 2180 h. A 50% glutaraldehyde solution (MB-544 C from M-I
SWACO a Schlumberger Company, USA) was used as an industry standard antimicrobial.
2.2. Bacteria cultures
The cultures of D. desulfuricans ATCC 27774 and D. alasken-sis AL1 that served as inoculums for the “once-through” flow loop were grown in modified VMNI sulfate culture media [36]. VMN was composed of (g L−1 distilled water): NaCl, 20.0; NH4Cl, 1.0; CaCl2× 2H2O, 0.04; Na2SO4, 4.5; MgSO4× 7H2O,
0.06; FeSO4× 7H2O, 0.004; sodium lactate, 6.0; KH2PO4, 0.5;
sodium citrate, 0.3; casamino acids, 2.0; tryptone, 2.0; modi-fied Wolfe’s mineral elixir (0.1 (v/v) %) and vitamin solution (0.2 (v/v) %). The vitamin solution was composed of (g L−1 dis-tilled water): riboflavin, 0.1; nicotinic acid, 0.25; thiamine, 0.3; pentatonic acid, 0.3; pyridoxine, 0.3; cyanocobalamin, 0.025; ascorbic acid, 1; biotin, 0.005. The composition of the modified
Wolfe’s elixir was (g L−1distilled water): Nitrilotriacetic acid, 1,5; MgSO4× 7H2O, 0.06; MnSO4× H2O, 0.5; NaCl, 1; FeSO4× 7H2O,
0.1; CoSO4× 7H2O, 0.1; NiCl2× 6H2O, 0.1; CuCl2× 2H2O, 0.1;
ZnSO4× 7H2O, 0.1; CuSO4× 5H2O, 0.01; AlK(SO4)2× 12H2O, 0.01;
H3BO3, 0.01; Na2MoO4× 2H2O, 0.01; Na2SeO3× 5H2O, 0.001.
Cell densities of prepared enrichments were determinated using Thoma counting chamber (Helber Bacteria Cell, Hawksley, UK) with precondition that only viable cells are counted.
Flow cell A was inoculated two times with 80 mL and one time with 120 mL of D. alaskensis AL1 culture (cell densities≈107) and
flow cell D with D. desulfuricans ATCC 27774 (cell densities≈107).
2.3. Analytical methods
2.3.1. Bacterial activity monitoring
Bacteria consortium monitoring in second bioreactor (indigent population naturally contained in seawater) and both flow cells (indigent population naturally contained in seawater + inoculated pure culture that are dominant) was conducted by measuring cell density. Firstly, global measurements were performed using a Thoma counting chamber with precondition that only viable cells are counted. Secondly, determination of cell densities for two groups (APB and SRB) was conducted using the most probable num-ber (MPN) technique. Two types of media were used for these measurements: the full name acid producing bacteria (APB) media containing phenol red dye (APB, 25000 TDS) (Intertek Commercial Microbiology, USA) for APBs and Sulfate Reducing Bacteria (SRB) media 2 Medium (SRB, 25000 TDS) (Intertek Commercial Micro-biology, USA) for SRBs. Measurements were performed 24 h after inoculations; samples were collected at the moment when flow conditions were reestablished.
2.3.2. Experimental media chemistry monitoring
Sulfate (SO42−) concentrations were determinated
spectropho-tometrically with Spectroquant® sulfide kit (VWR, USA). Sulfide
concentrations were monitored according to NACE TM0284-2003 (Appendix C—Determination of H2S concentration) by the
iodometric titration. Measurements were performed 24 h after inoculations, i.e. samples were collected at the moment when flow conditions were reestablished.
2.3.3. Electrochemical methods
Open circuit potential (OCP), linear polarization resistance (LPR) and electrochemical noise (EN) measurements were car-ried out using a multichannel potentiostat MultEchemTM(Gamry
Instruments, USA) that consisted of two Reference 600TM Poten-tiostat/Galvanostat/ZRA independent units connected to a PC interface and monitored with DC105 or ESA410 software (Gamry Instruments, USA).
Standard three electrode-arrangements included a working electrode (WE), a counter electrode (CE) and a saturated calomel electrode (SCE). The WEs, made of S235JR low carbon steel, have a circular exposed area of 0.785 cm2 (1 cm diameter cylindrical
specimens, 2 cm long, dressed in polyolefin sleeve,Fig. 3). The carbon steel specimens were manufactured from S235JR carbon (Descoure and Cabaud, France) whose composition is the following (mass ratio): 0.17% C, 1.4% Mn, 0.045% Cu, 0.03% S, and 0.03% P. Surfaces of all exposed steel specimens were prepared by manual grinding using increasing series of fine SiC paper, ending with 600-grit. Grinding debris was rinsed from the surface with sterile deionized water. The specimens were sterilized exposing them on each side for 12 h under UV light (wave length 256 nm: XX-15, sterilization UV lamp, UVP, USA) at 25◦C.
The CEs are made from Inconel® C276 cylindrical specimens
(1 cm long, 1 cm diameter) with an exposed area of 3.95 cm2(flat
circular face plus the side area).
Fig. 3. Working electrode scheme.
In each flow cell, the OCP’s versus SCE (E(OCP)/V (vs. SCE)) (SCE installed at F4 position) of six working electrodes (circular disc) installed at the F1, F2, F5, F8, F11 and F12 positions were recorded every 24 h in period prior and after flow cells perturbations (inoculations or antimicrobial treatments) or every 168 h during rest of test duration. Average OCP values with standard deviation error bars are reported.
The LPR technique was employed to estimate the corrosion rate of the steel coupons. The polarization resistance (Rp) of
the steel/electrolyte interface is measured in the vicinity of the E(OCP)/V (vs. SCE)[37]. Rpis defined as the slope of the
polariza-tion curve tangent at the OCP. The inverse of Rpis proportional to
the “instantaneous” corrosion rate and given in 1/˝[32]. To deter-mine Rp, the potential was scanned in the range of E(OCP)/mV (vs.
SCE)± 10 mV with a sweeping rate of
v
= 0.167 mV s−1. Polarization scans were performed every 24 h in period around flow cell pertur-bations (inoculations or antimicrobial treatments), or every 168 h during rest of test duration. Average 1/(Rp/˝) values withasso-ciated standard deviations were reported for the six different WEs installed at the F1, F2, F5, F8, F11 and F12 positions in each flow cell. Two counter electrodes (position F3 and F9) together connected at the potentiostat were used.
Electrochemical noise (EN) analysis was carried out to deter-mine the type of corrosion attack [28]. Electrochemical current noise (ECN) and Electrochemical potential noise (EPN) signals were performed on four different three-electrode set-ups:
(1) WE1 at F1, WE2 at F2 and SCE at F4; (2) WE1 at F7, WE2 at F8 and SCE at F4; (3) WE1 at F5, WE2 at F6 and SCE at F4; (4) WE1 at F11, WE2 at F12 and SCE at F4.
EN signals were recorded with frequency of 1 Hz, for 30 and 60 min long intervals, every 168 h during the whole test period. EN signals were recorded with a current range of 60A and a resolu-tion of 1 pA and a potential range of±30 mV and a voltage resolution of 1V. Only typical ECN signals characteristic for each experimen-tal stage are presented herein. Modulated current signal patterns, as well as transients, characteristic of localized surface events, were visually examined within data blocks of 1000 or 10,000 (1 Hz samp-ling frequency) points resulting with the time resolution of 1000 or 10,000 s. The trend was removed from obtained data series by using the linear regression fitting method. The only ECN data are
presented herein, while accompanied EPN data are not presented in order to keep clarity of presented data even though EPN data support observed current transients.
2.3.4. Surface analysis
The morphology and chemical composition of formed surface deposits as well as steel surface topography were investigated using four different systems:
(1) High resolution Scanning Electron Microscope (SEM) JSM-7400F (Joel, Japan);
(2) Low vacuum table SEM TM3000 (Hitachi, Japan) interfaced with Energy Dispersive X-ray (EDX) spectroscopy system Quantax 70 (Bruker, USA);
(3) SEM Neon 40 EsB (Zeiss, Germany) equipped with a Inca EDX-System (Oxford Instruments, UK);
(4) Leica upright DMR microscope (Leica Microsystems GmbH, Germany) with attached ProgRes®C5 camera (JENOPTIK
Opti-cal Systems GmbH, Germany).
Two types of surface preparation were used depending on inves-tigated specimen:
(1) In order to fix the biofilm/corrosion products layer, the steel specimens were placed in 2.5 (w/v) % glutaraldehyde (Elec-tron Microscopy Science, USA) for 90 min at 4◦C, and then washed by four 15 min immersions in 0.1 M sodium cacody-late buffer (Merck, Germany). Post-fixation was carried out by placing specimens for 1 h in the solution of 1 (w/v) % osmium tetroxide (purity >99.95%, Electron Microscopy Science, USA) in 0.1 M sodium cacodylate buffer (MERCK, Germany). Post-fixed samples were washed in 0.1 M sodium cacodylate buffer (2× 20 min) and dehydrated performing the following immer-sions: 15 min in 30 (v/v) %, 15 min in 50 (v/v) %, 20 min in 70 (v/v) %, 2× 15 min in 96 (v/v) % and 2 × 15 min in 99.8 (v/v) % aque-ous ethanol solutions (Sigma-Aldrich, Norway). De-watered specimens were placed in an oven (Type TS 4057, Thermaks AS, Norway) at 37◦C overnight. Dried samples were mounted on an aluminum stub using adhesive carbon tape, sputter-coated with gold for 3 min;
(2) Steel specimens were rinsed in deionized water to remove loose deposits.
After SEM/EDX examination, steel specimens were cleaned from surface deposits by following one of two used protocols:
(1) Immersion in a 5 (v/w) % hexamine (Merck, Germany) solution in concentrated HCl (VWR, USA) for 30 s. This was immediately followed by rinsing with deionized water, gentle blotting with a paper towel, and overnight storage in a desiccator;
(2) Immersion in AP2 solution (g L−1of distilled water: 200, NaOH; 30, KMnO4). This was immediately followed by rinsing with
deionized water, gentle blotting with a paper towel, and overnight storage in a desiccator;
Finally, particular specimens were subjected to cross-section and microstructure examination. Etching was performed using standard Nital-etching solution (10 (v/v) % HNO3in ethanol).
Moreover, the presence of sulfide in black corrosion products on steel specimens, either retrieved from flow cells after 1070 or 2200 h of test, was tested by initiating reaction between concen-trated HCl (VWR, USA) and collected corrosion products. Reaction product was H2S, characterized by distinguish and easily
recogniz-able smell[22].
3. Results and discussion
3.1. Development of event during test duration
To simplify the presentation and the consequent analyses of the test data, the current laboratory investigation was conveniently divided in three distinctive stages:
(1) First test stage refers to the period before the multiple inoculations of flow cells with pure SRBs cultures; from te= 0 h
to te= 792 h.
(2) Second test stage covers the period from the first inoculation to first antimicrobial treatment; from te= 936 h to te= 1075 h.
(3) Third test stage comprises the period between the first antimi-crobial treatment and test termination; from te= 1075 h to
te= 2200 h.
As a general note concerning the bulk test medium, dissolved oxygen (DO) concentration and pH evolution monitored during the 2200 h of the test are shown inFig. 4. According to the oxy-gen concentration evolution, the test environments were regarded as anoxic since the DO level was never above 50 ppb (0.049 mg L−1). 3.1.1. First test stage
During the first test stage, pH around 8.1 (Fig. 4), low cell density (<103cells mL−1), corresponding to indigene population naturally
present in seawater, high sulfate (≈3.5 × 10³ppm, i.e. 2.7 g L−1), and
low sulfide (not detectable) concentrations were detected in the bulk medium flowing through the both flow cells (Tables 1 and 2). It is then possible to conclude that the bulk medium conditions, exhibited in the two different flow cells, are very similar as expected (identical medium was flowing through both flow cells) proving that the further differences found could be attributed to the nature of the inoculations.
Measured instantaneous corrosion rates for WEs exposed in flow cells, obtained during the first test stage, are presented in Fig. 5. In both flow cells, 1/(Rp/˝) values measured during initial
200 h of tests were low, around 3× 10⁻⁴. After te= 200 h, 1/(Rp/˝)
values decreased to 1× 10⁻⁴, where they remained (with some
fluctuations) until end of the first test stage. Typical ECN records for WEs exposed in flow cells, obtained during the first test stage, and are presented inFig. 6. ECN transients are oriented in both directions (up and down), indicating that both WEs are equally subjected to corrosion. This type of signal modulations is character-istic for the carbon steel immersed in chloride solution as seawater [38]. Moreover the magnitude of the ECN first increased with the time, as indicated by comparing the curves obtained for te= 20 h
and for te= 200 h. Since the ECN is produced by independent
cur-rent sources on steel surfaces[39], higher current reveals greater electrochemical activity and more pronounced anodic reaction being indicative for elevated corrosion rates[21,39]. Consequently in the test conditions, the initial increase of ECN magnitude can be explained by the breakdown of the initial protective ferrous layer, exposing bare steel surface to high amount of aggressive Cl−ions present in seawater what may result in metastable pitting attacks. Afterward, since the tendency in corrosion rate showed a lessening (1/(Rp/˝) plateau with lowest value in Fig. 5), ECN
amplitudes decreased (Fig. 6, curves obtained at te= 400 h),
indi-cating lower corrosion and lower surface activity. Theoretically, a protective layer of corrosion products, e.g. sulfated green rust (GR(SO42−) = FeII4FeIII2(OH)12SO4× 8H2O), produced directly or by
oxidation of iron hydroxide (Fe(OH)2), is often found on the
car-bon steel surface when exposed to environments as described here[40–42]. Moreover, if any oxygen is present, certain portion of GR(SO42−) will be oxidized into Fe(III)oxyhydroxides such as
Fig. 4. Oxygen concentration in parts per million (c(O2)/ppm) and pH evolution of bulk media in flow cell A (inoculation with Desulfovibrio alaskensis) and flow cell D
(inoculation with Desulfovibrio desulfuricans) during the whole test.
that some oxygen is present in our system,Fig. 4). Interestingly, GR(SO42−) may also serve as a source of sulfate, a terminate electron
acceptor in SRBs dissimilatory respiration[40]. 3.1.2. Second test stage
The first inoculation at the beginning of the second test stage (te= 792 h) led to an increase of cell density, a decrease in sulfate
concentration linked to an increase in sulfide concentration due to the enhanced sulfidogenic metabolic processes (Tables 1 and 2).
However, no significant modifications were observed in the electrochemical response after this first inoculation: 1/(Rp/˝)
remained stable with low values (Fig. 5). This stable trend in cor-rosion currents could be attributed to the corcor-rosion product layer that remained stable even with the perturbation of the medium. In addition, sulfidogenic bacteria could enhance protective layer properties by promoting formation of protective iron sulfide (FexSy)
films, a process taking place in a presence of low ferrous ion con-centrations[43]as it is the case here. When flow conditions were reestablished, a decrease of the planktonic cell density in the bulk media was also observed in the both flow cells since part of micro-bial cells was flushed out. On the contrary, there was no change in sulfide and sulfate concentrations. Most likely the microbial activity in the bulk medium was maintained thanks to SRBs attached on steels surfaces that can detach and colonize the bulk medium.
The second inoculation imposed significant perturbation to the systems and resulted in a noticeable alteration of environment and material corrosion behavior. High cells densities were measured in both flow cells (Tables 1 and 2) even when the flux conditions were reestablished: Moreover higher densities were found in flow cell A (inoculated by D. alaskensis) than in the D one (inoculated by D. desulfuricans) with, respectively, 600 and 1850× 103
cells mL−1. A pH decrease down to 7.6 was noticed (Fig. 4) that
Table 1
Cell density and chemical monitoring of the bulk medium in flow cell A (inoculation with Desulfovibrio alaskensis) during whole test. Time (h) Cell density× 103
(cells mL−1) APB× 103 (cells mL−1) SRB× 103 (cells mL−1) c(SO42−)× 103 (ppm)a c(S2−) (ppm)a
First test stage
336 1< / / 3.40 /
672 1< / / 3.58 /
Second test stage
792 1< / / 3.15 / First inoculation 816 555 / / 3.00 34 888 550 / / 3.00 34 936 39 / / 2.95 37 Second inoculation 960 611 >140 >140 2.60 204 1056 47 / / 2.45 / Third inoculation
Third test stage
1070 678 / / 2.40 206 First antimicrobial treatment
1094 506 / / 3.15 136
1152 468 >140 14 2.80 51
1416 363 >140 >140 2.95 /
1992 86 14 14 2.65 12
2088 226 >140 45 2.45 5
2180 / / / / / Second antimicrobial treatment
2200 / 0.3 0.9 2.30 /
Table 2
Cell density and chemical monitoring of the bulk medium in flow cell D (inoculation with Desulfovibrio desulfuricans) during whole test. Time (h) cell density× 103
(cells mL−1) APB× 103 (cells mL−1) SRB× 103 (cells mL−1) c(SO42−)× 103 (ppm)a c(S2−) (ppm)a
First test stage
336 1< / / 3.40 /
672 1< / / 3.58 /
Second test stage
792 1< / / 3.25 / First inoculation 816 141 / / 3.20 34 888 109 / / 3.20 34 936 12 / / 3.18 17 Second inoculation 960 1850 >140 >140 2.15 238 1056 55 / / 2.55 Third inoculation
Third test stage
1070 1600 / / 2.50 202 First antimicrobial treatment
1094 945 / / 3.30 34
1152 429 14 14 2.75 17
1416 128 25 >140 2.75 /
1992 70 1 1.4 2.25 20
2088 166 140 9.5 2.50 20
2180 / / / / / Second antimicrobial treatment
2200 / 0.3 0.2 2.20 /
appm = parts per million = 0.99 mg L−1.
could be product of SRBs metabolic activity (souring due to elevated sulfide production). Side effect of observed microbial flourishing was a significant increase in instantaneous corrosion rate. It can be observed that 24 h after the second inoculation, the stable and low 1/(Rp/˝) plateau established during the first test stage was
dis-turbed. This was displayed in a significant increase of the average 1/(Rp/˝) values up to 6 × 10⁻⁴in the flow cell D, and less expressed
increase up to 3.5× 10⁻⁴ in the flow cell A, (Fig. 5), that can be
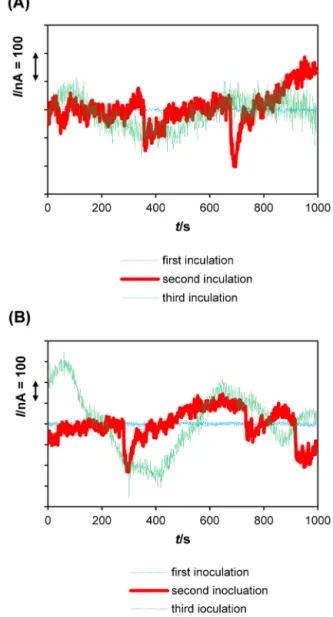
correlated with the increase in cell density and metabolic activity (Tables 1 and 2). Also, ECN exhibited higher magnitude of cor-rosion current fluctuations and clear transients, characteristic of stable localized corrosion (i.e. pitting) as shown onFig. 7. The sta-ble localized corrosion was featured by significant current drops (I/nA = 100–500) followed by a slower increase. Briefly, the rapid current increase during pit initiation and growth is followed by a slower decay leading to pit repassivation[38]. It is possible to assume that second inoculation led to a breach threshold of the protective corrosion product layer. This layer managed to resist to
the microbial activity introduced by the first inoculation but after the second inoculation, it suffered local breakdown and could not reestablish instantaneously, exposing localized areas of metal sur-face to different influences of e.g. aggressive ions such as Cl−, S2− and S2O32−, bacteria metabolic products. This often results in
for-mation of large cathodic areas (remained FexSy, most likely with
FeS) whereas significantly smaller unprotected regions of steel sur-faces are forming anodes, characterized by higher anodic current. Besides, observed increase in corrosion, and therefore most likely increase in dissolved Fe concentration may have inhibited forma-tion of a protective sulfide film on a steel specimens surfaces what could cause higher corrosion rates. This phenomenon has been pre-viously observed by other researchers[44,45].
Short time after the third inoculation, a sudden pH increase was observed in the both flow cells (up to 8.5,Fig. 4), most probably due to cathodic corrosion reaction of hydrogen evolution and release of hydroxide ions (OH−) into bulk medium, as a result of substan-tial increase in corrosion. This was reflected by the increase of the
Fig. 5. Average instantaneous corrosion rate (1/(Rp/˝)) and OCP (E(OCP)/V (vs. SCE)) values with standard deviation error bars for 12 o’clock positioned steel specimens
Fig. 6. Variations of typical current noise (I/nA = f(t)) obtained during the first test stage (te= 0–792 h, prior to inoculations) at te= 20 h, te= 200 h and te= 400 h: (A) in
flow cell D (inoculation with Desulfovibrio desulfuricans); (B) in flow cell A (inocula-tion with Desulfovibrio alaskensis). Data linearly detrended.
average 1/(Rp/˝) values (up to 9 × 10⁻⁴for flow cell A and 7× 10⁻⁴
for flow cell D,Fig. 5), and of the ECN amplitudes (Fig. 7). How-ever, the ECN did not exhibit the geometry characteristic for pitting. Nonetheless, metastable pitting or conjugation of multiple pits in visually detectable general corrosion pattern would not be revealed by EN signals and surface degradation still would have origin in localized corrosion.
Micrographs presented inFig. 8A and B are typical for steel spec-imens located at 6 o’clock position and retrieved from each flow cell at the end of the second test stage.
The steel specimens were covered with blackish deposits in which FexSyparticipated (sulfide presence verified by the chemical
test). Deposits were easily removed from steel specimens. This is in agreement with chemical and microbial information obtained during second test stage. Detection of blackish deposits containing sulfide suggests that postulated layer formed during the second test stage is predominantly composed of the FexSy, a new
compo-nent formed on steel surface. However, it is required to keep on mind that observed layer may be heterogeneous and may contain other compounds, such as GR(SO42−) and/or magnetite (Fe3O4),
characteristic for steel specimens immersed in seawater with active sulfidogenic microbial population [40,41,46]. Furthermore, SEM micrographs revealed a high variety of corrosion/biomineralization products at the metal surface suggesting that more than one mineral is participating in the corrosion deposit architecture. This indicates that members of indigent microbial population naturally
Fig. 7. Variations of typical current noise (I/nA = f(t)) obtained during the second test stage (te= 792–1070 h) obtained 24 h after each inoculation: (A) in flow cell
D(inoculation with Desulfovibrio desulfuricans); (B) in flow cell A (inoculation with Desulfovibrio alaskensis). Data linearly detrended.
contained in seawater (for example Clostridium[18]), in addition to the inoculated SRBs, are contributing to biomineralization process occurring on steel surfaces. Proof of this is the APB presence in both flow cells (Tables 2 and 3).
Moreover, observed corrosion products seem to be similar in presence of D. alaskensis (Fig. 8A) or D. desulfuricans (Fig. 8B), fea-tured with particulate aggregates. On both surface observed (from flow cell A inFig. 8A and from flow cell D inFig. 8B), some bacte-ria with the characteristic curved rod shape of vibrio species[47] were observed incorporated inside the mineral structure instead of formation purely organic biofilms. The vibrio shape bacteria occu-pied a small volume fraction as compared to the formed corrosion products and biomineralized structures. After specimen’s chemical cleaning, optical microscopy revealed presence of numerous pits with a diameter up to 100m and an average depth of 5–10 m as shown onFig. 9. These pits could be correlated with ECN transients observed 24 h after second inoculation, and indication occurrence of pitting on WEs surfaces.
3.1.3 . Third test stage
At the beginning of the third test stage, 19 h after the third ino-culation, flow cells were treated with 500 ppm of a glutaraldehyde
Fig. 8. SEM of steel specimens placed at 6 o’clock position and retrieved from flow cells after 1070 h of exposure: (A) specimen from cell A (inoculation with Desul-fovibrio alaskensis)—8500×; (B) specimen from cell D (inoculation with DesulDesul-fovibrio desulfuricans)—8000×.
based antimicrobial chemical for a period of 50 min (flow was stopped). Short time after the applied antimicrobial treatment, the pH decreased due to the intrinsic acidity of the antimicrobial chemi-cal (Fig. 4). A decrease of cell densities was also observed, in a higher range in flow cell D (from 1600 to 945 cells mL−1in few hours) than in the flow cell A (from 678 to 506 cells mL−1in the same period). Consequently to this decrease, an increase of sulfate concentrations Table 3
EDX analysis results of emphasized areas presented onFig. 13, all results given in weight fractions (wt(element)/%): (A) representative spectrums forFig. 13A; (B) representative spectrums forFig. 13B; (C) representative spectrums forFig. 13C.
Table A Spec.a C O S Ca Fe Sp1 18.2 35.9 5.2 3.0 37.6 Sp2 30.5 11.7 5.0 3.5 49.3 Sp3 2.6 6.9 6.7 13.3 70.5 Table B Spec.a C O S Ca Fe Sp1 3.1 5.3 6.5 13.5 71.4 Sp2 20.0 40.2 3.9 3.2 32.9 Sp3 3.4 6.0 2.5 1.3 86.8 Table C Spec.x C O S Ca Fe Sp1 15.1 19.9 12.6 4.2 48.3 Sp2 25.5 37.1 6.9 1.4 29.1 Sp3 20.1 9.2 13.2 2.6 68.1
aSpec. = complete analyzed spectrum for particular surface area.
Fig. 9. Micro photographs (100×) of steel specimens retrieved from flow cells after 1070 h of exposure and after corrosion product removal, revealing localized corrosion attacks: (A) specimen from flow cell A (inoculation with Desulfovibrio alaskensis); (B) specimen from flow cell D (inoculation with Desulfovibrio desulfu-ricans).
as well as a decrease of sulfide concentrations was measured indi-cating the effectiveness of the antimicrobial treatment. Moreover, 1/(Rp/˝) in both flow cells decreased to a value of 3.5 × 10⁻⁴
and recorded OCPs were E(OCP)/mV (vs. SCE)≈−720 (Fig. 5). Cur-rent fluctuations were found more expressed (Fig. 10) compared to those found before the antimicrobial treatment, maintaining
Fig. 10. Variations of typical current noise (I/nA = f(t)) obtained in flow cell A (inoculation with Desulfovibrio alaskensis) and flow cell D (inoculation with Desul-fovibrio desulfuricans) recorded 12 h after first antimicrobial treatment (te= 1087 h).
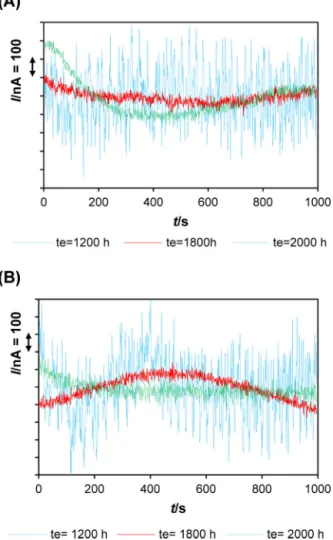
Fig. 11. Variations of typical current noise (I/nA = f(t)) obtained during the third test stage (te= 1070–2200 h) at te= 1200 h, te= 1800 h and te= 2180 h: (A) in flow cell
D(inoculation with Desulfovibrio desulfuricans); (B) in flow cell A (inoculation with Desulfovibrio alaskensis). Data linearly detrended.
constantly differences between minimum and maximum ampli-tudes peaks in range of approximately 1A (versus 100 nA). Even though graphs are not presented herein, it is significant to men-tion that in this short period after biocide treatment (2–10 h), EPN trend rose toward more positive values, from E/mV (vs. SCE) =−720 up to E/mV (vs. SCE) =−680 and then returned back to E/mV (vs. SCE) =−720 in the both flow cells. When antimicrobial was flushed out from flow cells, pH showed increasing trend behavior due to
Fig. 12. Variations of typical current noise (I/nA = f(t)) obtained in flow cell A (inoculation with Desulfovibrio alaskensis) and flow cell D (inoculation with Desul-fovibrio desulfuricans) recorded 12 h after the second antimicrobial treatment (te= 2192 h). Data linearly detrended.
Fig. 13. SEM micrographs (4000×) with emphasized areas submitted to EDX analysis of four 6 o’clock positioned specimens exposed in flow cell A (inoculation with Desulfovibrio alaskensis) for 2200 h.
income of fresh media. This process was slow and it resulted in pH 8.1 at te= 1450 h (Fig. 4). From that point until the test termination,
both flow cells exhibited a decrease in pH with final pH of 7.4 in flow cell A and 7.7 in flow cell D (Fig. 4).
Despite these fluctuations, measured pH was very similar to that of seawater from North Sea (base component of used media). During the same time period cell densities continued to slowly decrease (Tables 2 and 3). After a temporary increase initiated by the first antimicrobial treatment, sulfate concentration showed a decreasing trend during the whole third test stage (Tables 1 and 2).
Fig. 14. SEM micrograph (100×) with emphasized areas submitted to EDX analysis of 12 o’clock positioned specimen exposed in flow cell A (inoculation with Desul-fovibrio alaskensis) for 2200 h.
Acquired data are suggesting that bacteria continued to consume sulfate present in seawater; however, produced sulfide was found in low concentration in bulk medium (sulfide concentration con-tinued to decrease). In fact, it reacted with iron forming different FexSy compounds that can be observed on steel specimens’
sur-faces as well as in bulk medium where black particulates were found. In addition, part of sulfate probably reacted with resid-ual oxygen forming thiosulfate ions, and decreasing amount of available sulfate in bulk medium. Observed reduction in sul-fate concentration will reduce the molar ratio [SO42−]/[HCO3−]
and consequently lead to partial transformation of GR(SO42−) to
carbonated green rust (GR(CO32−) = FeII4FeIII2(OH)12CO3× 2H2O)
[42]. Moreover, possible increase of the carbonate concentration could result in the formation of carbonated compounds such as chukanovite (Fe2(OH)2CO3)[48,49].
The 1/(Rp/˝) decreasing trend observed in both flow cells after
antimicrobial treatment was reduced and material corrosion resis-tance stabilized to the initial level. This was maintained until test termination, and final 1/(Rp/˝) were around 2 × 10⁻⁴(Fig. 5). OCPs
exhibited similar behavior, featured with mildly decreasing OCPs and final value of E(OCP)/mV (vs. SCE) =−770 (Fig. 8). ECN sig-nals acquired 125 h after biocide treatment (Fig. 11, te= 1200 h)
exhibit lower amplitudes indicating decrease of surface electro-chemical activity compared to ECN signals obtained shortly after antimicrobial treatment (Fig. 12). Later on, the low current fluctu-ations observed at te= 1800 h and te= 2000 h in the range of 100 nA
(Fig. 11) indicated current intensity decrease, hence lower corro-sion too. This is in agreement with observed decrease of 1/(Rp/˝)
and reduced of the planktonic bacterial population. In conclusion, the probable formation of stable corrosion products and the par-tially suppressed microbial activity can be considered as the origin of the electrochemical behavior of carbon steel after the antimicro-bial treatment.
The second antimicrobial treatment (50 min with 1500 ppm) completely suppressed already decreased planktonic microbial activity. Here again, the pH decreased as a consequence of applied treatment. As previously mentioned, E(OCP)/mV (vs. SCE) and 1/(Rp/˝) values in both cell remained unchanged. However, as
observed immediately after the first biocide treatment, ECN exhib-ited particular alteration in its behavior (Fig. 12). The ECN in both cells demonstrated more erratic behavior compared to ones observed before antimicrobial treatment application. The observed curve shape and peak magnitude suggest elevated corrosion cur-rent and enhanced localized surface activity. These observations
Fig. 15. SEM micrographs (4000×) with emphasized areas submitted to EDX analysis of three 6 o’clock positioned specimens exposed in cell D (inoculation with Desulfovibrio desulfuricans) for 2200 h.
could indicate corrosion deposit breakdown, possibly initiated by pH decrease.
3.2. Post- test surface analysis
After the once-through flow loop was decommissioned, three 6 o’clock positioned steel specimens and one 12 o’clock positioned steel specimen (WE) from each cell were subjected to microscopical
Fig. 16. SEM micrograph (100×) with emphasized areas submitted to EDX analysis of 12 o’clock positioned specimen exposed in flow cell D (inoculation with Desul-fovibrio desulfuricans) for 2200 h.
(SEM analysis) and chemical (EDX analysis) examination in order to acquire more information about corrosion deposits building blocks and corrosion mechanisms nature.
3.2.1. Corrosion products architecture
The micrographs for 6 o’clock located steel specimens, examined with SEM/EDX system after 2200 h exposure in the flow cell A with a dominant presence of D. alaskensis species are presented inFig. 13. Table 3shows EDX analysis obtained on different points on the observed surface.
The micrographs reveal the deposition of corrosion products characterized with the dominant presence of Fe, Ca, S, C and O, but the proportions and amounts of specific elements are various, suggesting different mineral structures. Indeed, the simultaneous presence of Fe peak with O and C ones (spot Sp1 of Fig. 13A, Table 3A; spot Sp2 ofFig. 13B, Table 3B; spots Sp1 and Sp2 of Fig. 13C,Table 3C) is characteristic of the formation of iron min-erals, such as Fe2(OH)2CO3and GR(CO32−))[48,49]. These mineral
products were found in outer corrosion product structure. More-over, S peaks were identified with EDX analysis too. However, S was found in higher proportion at locations where analyses were performed close to the metal surface, as shown inFig. 13A Sp3 (Table 3A),Fig. 13B Sp1 (Table 3B) andFig. 13C Sp1, Sp2 and Sp3 (Table 3C). Concerning Ca peaks, analysis is suggesting that Ca was concentrated within localized and visually larger structures established in the outer layers of corrosion products, and often accompanied with the presence of O and C as shown inFig. 13A Sp3 (Table 3A), andFig. 13B Sp1 (Table 3B). The simultaneous presence
Fig. 17. Phenomenological model for corrosion products formed on the carbon steel surface during and post sulfidogenic bacteria process.
of Ca, C and O with local alkaline surface conditions (as recorded at the end of second test stage) could indicate the formation of cal-cite (CaCO3)[50]. To sum-up, taking into consideration relatively
low DO in the bulk medium (Fig. 1), mildly alkaline environment (Fig. 4) and OCP in range of E(OCP)/mV (vs. SCE) =−750 ± 20 (Fig. 2), it is likely that the corrosion/biomineralization products belong to several main mineral families: iron sulfides with FeS, iron oxides with Fe3O4, iron(III) oxyhydroxides in all likelihood with␣-FeOOH
and ␥-FeOOH, GR(SO42−), carbonate minerals most likely with
Fe2(OH)2CO3and GR(CO32−), as well as calcareous such deposits
as CaCO3on the top of this structure[42,49].
Otherwise, micrograph presented inFig. 14is characteristic for the 12 o’clock positioned WEs and removed from the flow cell A after 2200 h exposure. They reveal the presence of two dominant regions as corrosion deposits and transfer region defined by spot Sp3. Two dominant regions have similar chemical fingerprints to ones observed in a case of 6 o’clock positioned steel specimens. The first region, defined by spots Sp1, Sp2 and Sp4 onFig. 14, is dark col-ored and EDX analysis emphasized the presence of S, as well as high portions of Fe, O and C (Table 4), suggesting presence of FexSyin high
amount along with the presence of iron oxides and carbonate min-erals. In contrast, the second zone, represented by spots Sp5 and Sp6 onFig. 14, appears brighter compared to the dark region, is forming outer layer, and reveals high amount of Ca (Table 4). Addi-tionally, Fe, O, and C are well represented; suggesting formation of
Fig. 18. SEM micrographs (1000×) of 12 o’clock positioned steel specimens retrieved after 2200 of immersion in flow cells and chemically cleaned from cor-rosion deposits: (A) specimen from flow cell A (inoculation with Desulfovibrio alaskensis); (B) specimen from flow cell D (inoculation with Desulfovibrio desulfu-ricans).
Fig. 19. Macrographs and micrographs of 12 o’clock positioned specimen exposed in cell A (inoculation with Desulfovibrio alaskensis) for 2200 h after corrosion product removal: (A) Macrograph before cross section and cutting line; (B) Micrograph for depth determination of attack in more lighted coloured region; (C) Micrograph for depth determination of attack in darker coloured region.
Table 4
EDX analysis results of emphasized areas presented onFig. 14, all results given in weight fractions (wt(element)/%).
Spec.a C O Na Mg Al Si P S Cl Ca Cr Mn Fe Ni Cu Sr Sp1 8.6 42.7 / 0.4 0.3 / 0.1 16.6 / 0.2 / 0.2 30.8 / / / Sp2 6.5 34.7 / 0.2 0.4 0.2 0.4 7.9 0.6 / 1.1 1.2 42.0 1.1 3.8 / Sp3 5.1 53.6 / 1.0 0.3 0.3 / 0.1 / 1.0 / 0.4 38.2 / / / Sp4 12.5 36.7 0.8 1.4 0.2 0.2 / 17.8 / 1.4 / / 28.9 / / / Sp5 5.7 61.9 / 0.6 / / / / 0.2 15.1 / / 16.5 / / / Sp6 10.6 57.8 0.3 0.1 0.1 / / 0.1 0.1 27.1 / / 3.3 / / 0.5
aSpec. = complete analyzed spectrum for particular surface area.
iron oxides, iron carbonates and Ca-based minerals. Interesting to note for this particular region is the complete absence of S peak in investigated spectrums. To sum-up, micrographs suggest an initial formation of FexSy(inner layer) that is followed by the rise of
dif-ferent Fe minerals and Ca-based minerals on them (outer layer). However, this postulated layered structure may be not so obvious and some detected compounds may participate in construction of the both layers. Additionally, P peak was occasionally recorded (Sp1 and Sp2,Fig. 14) but overall impression differs a lot from observa-tions made in artificial seawater systems inoculated with different SRB strains, D. gabonensis and D. capillatus, for which P was present in much larger amount accompanied with less S[14]. Moreover, Si, Al and Mg peaks were detected (Fig. 14,Table 4). The Mg, in the form of Mg(II), possibly could substitute Fe(II) in GR compounds but it can also easily substitute Ca in calcite.
Micrographs presented in Fig. 15 show corrosion products formed on steel specimens located at 6 o’clock location after 2200 h immersion in the dominant presence of D. desulfuricans species (flow cell D). It is possible to observe corrosion products com-posed of Ca-based minerals (Fig. 15A SpX,Table 5A), carbonate minerals (Fig. 15B Sp4 andTable 5B), and also some FexSyminerals
(Fig. 15B Sp2, Sp3Sp4 andTable 5B). Moreover, a high amount of iron oxide minerals (Fig. 15C SpX,Table 5C) is present. It possesses
Table 5
EDX analysis results of emphasized areas presented onFig. 15, all results given in weight fractions (wt(element)/%): (A) representative spectrums forFig. 15A; (B) representative spectrums forFig. 15B; (C) representative spectrums forFig. 15C.
Table A Spec.a C O S Ca Fe Mg SpX 15.2 45.0 1.3 26.6 5.2 1.8 Table B Spec.a C O S Ca Fe Sp1 20.1 17.6 4.1 0.9 54.7 Sp2 2.2 7.1 10.7 1.1 78.8 Sp3 / 8.2 11.0 1.8 79.0 Sp4 1.8 6.6 14.2 3.3 74.0 Table C Spec.a O Fe SpX 10.0 90.0
aSpec. = complete analyzed spectrum for particular surface area.
resemblance, in terms of morphology and analysis, with magnetite mineral.
Micrographs presented inFig. 16reveal the presence of rela-tively homogenous minerals morphologies as corrosion products on the 12 o’clock positioned WE examined with SEM/EDX sys-tem after 2200 h exposure in the flow cell D. The S is very well
Table 6
EDX analysis results of emphasized areas presented onFig. 16, all results given in weight fractions (wt(element)/%).
Spec.a C O Na Mg Al Si P S Cl Ca Cr Mn Fe Ni Cu Zn Sp1 12.3 47.6 1.2 1.2 0.4 0.2 0.4 4.6 0.4 / 0.4 0.6 28.4 0.8 1.5 / Sp2 16.0 43.2 0.8 0.9 0.4 0.3 0.5 8.0 0.4 0.2 0.5 0.7 24.9 1.1 1.5 0.6 Sp3 14.2 54.7 0.3 0.9 0.4 / 0.1 11.8 0.5 0.6 0.2 0.2 16.2 / / / Sp4 15.7 52.4 0.3 0.9 0.1 / 0.1 13.6 0.8 1.2 / 0.1 14.7 / / / Sp5 19.6 49.8 0.5 1.1 1.2 / / 9.9 0.3 7.3 / / 10.4 / / / Sp6 8.1 66.2 1.8 0.3 0.5 0.1 0.2 2.9 0.6 / / 0.4 18.4 / 0.2 / Sp7 23.6 55.1 0.2 1.5 0.2 / 0.2 9.3 0.4 0.7 / / 8.8 / / / Sp8 17.4 53.1 0.9 1.1 0.5 0.1 0.3 9.4 0.3 0.8 0.2 0.3 15.0 0.3 0.3 /
aSpec. = complete analyzed spectrum for particular surface area.
represented in corrosion deposits (Fig. 16 in Sp2, 3, 4, 5, 7 and 8;Table 6). Then again, Ca is well represented only in some part (spot Sp5 inFig. 16,Table 6), regarded as the outer layer, indicating similar corrosion products architecture as previously described for the specimens removed from the flow cell A. This is equally sup-ported by the presence of C and O that are quantitatively dominant compared to other elements discovered in this scan.
Taking all the observations into account, a phenomenologi-cal model of the architecture of the corrosion deposits formed in our particular test conditions, is suggested, regardless cells were inoculated with D. alaskensis or D. desulfuricans species (Fig. 17). As FexSyminerals seemed placed deeper, in the inner layers of
corro-sion product structure, it could correspond to the biological sulfate reduction into sulfide ions. Undeniably, Desulfovibrio species are anaerobic bacteria capable of reducing sulfur compounds to sulfide, what finally may result with growth of FexSy.
In our work, where experiments have been conducted under anoxic conditions in North Sea seawater, FexSycompounds seem to
be the construction blocks of the first corrosion product layer which stays stable on the metal surface, even after a long time immer-sion in presence of elevated metabolic activity of SRBs. This layer may also contain GR(SO42−) and Fe3O4. Then, above this first layer,
mixed iron minerals (Fe3O4, Fe(III) oxyhydroxides such as␣-FeOOH
and␥-FeOOH, GR(SO42−), Fe2(OH)2CO3and GR(CO32−)) with
addi-tion of calcareous precipitates (CaCO3) are established. This layer
possibly could contain small amounts of FexSy(most likely FeS) too.
This structural environment (corrosion products, bacteria) seems to entail a localized corrosion process with the presence of pits on the steel surface.
3.2.2. Corrosion attack mechanism and evolution
In order to identify corrosion attack mechanisms and their evolution during the test time, steel specimens were cleaned of corrosion products/deposits and submitted to microscopical and metallurgical examination.
After corrosion products removal, the surface topography, rep-resentative of the 12 o’clock positioned WEs retrieved from both flow cells, appear very rough (Fig. 18) with numerous pits, with a diameter up to 50–60m for specimens retrieved from cell A (Fig. 18A) and 20–30m for specimens retrieved from cell D (Fig. 18B). Also, metallographic cross sections of same steel specimens were prepared in order to determine the depth and the characteristics of the corrosive attack (Figs. 19 and 20).
As previously mentioned (see Section 3.2.1), the corrosion deposits on the surface were subdivided in darker and brighter regions, even after the removal of corrosion products (19A and 20B). The darker zones are less spread on the specimens from the flow cell D (inoculated with D. desulfuricans). These different visual appearances correspond to different characteristics of attack in the metallographic cross section. The brighter areas are rather smooth, showing only a superficial attack (Fig. 19B) whereas higher rough-ness and pitting corrosion can be observed in the darker areas
Fig. 20. Macrograph and micrograph of 12 o’clock positioned specimen exposed in cell D (inoculation with Desulfovibrio desulfuricans) for 2200 h after corrosion prod-uct removal: (A) Macrograph before cross section and cutting line; (B) Micrograph for depth determination of attack.
(Fig. 19C). While the depth of the corrosion attack varies between approximately 20m to 40 m on the specimen from the flow cell A (inoculated with D. alaskensis,Fig. 19C), the degree of damage is lower regarding depth, in range of approximately 20m, on the specimen from the flow cell D (Fig. 20B), indicating lower material deterioration.
This is understandable, having on mind higher results suggesting that D. alaskensis has a higher corrosivity than D. desulfuricans. Regardless to size and depth of pits, the topogra-phies observed here are coherent with corrosion attack previously recorded in presence of SRBs, supporting hypothesis that biofilms constituted of SRBs lead to pitting corrosion[33].
The bulk microstructure of all steel specimens used in this study consists of ferrite and pearlite with randomly distributed MnS inclusions, which is the typical microstructure of the material
Fig. 21. Etched cross-sections SEM micrographs (250×) of 12 o’clock positioned specimen exposed for 2200 h: (A) from flow cell A (inoculation with Desulfovibrio alaskensis); (B) from flow cell D (inoculation with Desulfovibrio desulfuricans).
S275JR. On the etched cross section of the two specimens, selective attack in the vicinity of inclusion lines can be identified (Fig. 21). However a correlation cannot be clearly shown between a cor-rosion pit and the presence of an inclusion. The corcor-rosion pits in general show a dependency on the crystallographic orientation, which can be deduced from their square or rectangular appearance in the SEM images and from the rather straight boundaries of the pits in the cross section. This is not surprising knowing that bac-terial initial attachment occurs on or in the proximity of the grain boundaries. This phenomenon has origin in differential energy dis-tribution between the grain boundaries and matrix[2,51], resulting in higher energy allocated in grain boundaries that attract bacteria [51]. Therefore, it is expected that initial localized material deterio-ration will occur also on grain boundaries as shown in the presented micrograph.
Investigation centered on influence of MnS inclusion on cor-rosion attack provides inconclusive results. InFig. 22A and B it is possible to observe beginning of corrosion attack at location of inclusion. In that case the inclusion shows the typical linear appearance of MnS. On the contrary, lack of this mechanism is recorded onFig. 22B; the inclusion at the onset of corrosion is of circular shape (e.g. oxidic). The remaining corrosion pits are free of nonmetallic inclusions, which might be due to the advanced state of corrosive attack.
From material structure it is possible to see that corrosion ini-tiation is attracted to grain boundaries and inclusions. Yet, to gain more information it is required to study these processes in a short period after environment inoculation. It may be the case that MnS inclusions play role in the localized corrosion initiation[20,21]. Nonetheless, their role in further development of corrosion attack with time is attenuate.
Fig. 22. Cross-sections micrographs of 12 o’clock positioned specimen exposed in cell D (inoculation with Desulfovibrio desulfuricans) for 2200 h after corrosion prod-uct removal: (A) Micrograph showing beginning of corrosion attack on location of MnS inclusion; (B) Micrograph showing beginning of corrosion attack in presence and absence of MnS inclusion.
4. Conclusion
Herein presented results show that the presence of sulfidogenic species in the seawater environment may result in degradation of the surface of carbon steel, leading to a rougher surface topogra-phy as well as localized corrosion damage. However, a long-term exposure in systems where the high bacterial activity was recorded does not have to necessary result in elevated corrosion rates, as has been previously reported. The formation of the observed corrosion attack pattern was investigated for two influencing factors: (a) Influence of the material surface microstructure on the
degra-dation topography:
The influence of the steel surface microstructure in the observed deterioration process and impact on the damage layout is rec-ognized. Grain boundaries and inclusions (e.g. MnS) are playing a significant role during the initial stage of corrosion attack (pit initiation), although this can diminish during latter stages of cor-rosion and material degradation as shown in the work presented herein.
(b) Impact of environment established on the material surface: Microbial activity is affecting the mineralization process natu-rally occurring on the carbon steel surface leading to architectures composed of mixed iron(II) and (III) minerals such as iron sulfides, magnetite, iron oxyhydroxides, chukanovite and sulfated and car-bonated green rust as well as calcareous deposits. Inner layers of these structures could possibly provide an anaerobic habitat