HAL Id: hal-01643654
https://hal.archives-ouvertes.fr/hal-01643654
Submitted on 21 Nov 2017
HAL is a multi-disciplinary open access
archive for the deposit and dissemination of
sci-entific research documents, whether they are
pub-lished or not. The documents may come from
teaching and research institutions in France or
abroad, or from public or private research centers.
L’archive ouverte pluridisciplinaire HAL, est
destinée au dépôt et à la diffusion de documents
scientifiques de niveau recherche, publiés ou non,
émanant des établissements d’enseignement et de
recherche français ou étrangers, des laboratoires
publics ou privés.
Distributed under a Creative Commons Attribution| 4.0 International License
reveals genes involved in glucose and lipid metabolism
and immunity as valuable clues of intestinal maturity
Ying Yao, Valentin Voillet, Maëva Jégou, Magali San Cristobal, Samir Dou,
Véronique Romé, Yannick Lippi, Yvon Billon, Marie-Christine Père, Gaëlle
Boudry, et al.
To cite this version:
Ying Yao, Valentin Voillet, Maëva Jégou, Magali San Cristobal, Samir Dou, et al.. Comparing the
intestinal transcriptome of Meishan and Large White piglets during late fetal development reveals
genes involved in glucose and lipid metabolism and immunity as valuable clues of intestinal maturity.
BMC Genomics, BioMed Central, 2017, 18 (1), pp.647. �10.1186/s12864-017-4001-2�. �hal-01643654�
O
pen
A
rchive
T
OULOUSE
A
rchive
O
uverte (
OATAO
)
OATAO is an open access repository that collects the work of Toulouse researchers and
makes it freely available over the web where possible.
This is an author-deposited version published in :
http://oatao.univ-toulouse.fr/
Eprints ID : 18438
To link to this article : DOI :10.1186/s12864-017-4001-2
URL :
http://dx.doi.org/10.1186/s12864-017-4001-2
To cite this version : Yao, Ying and Voillet, Valentin and Jégou,
Maëva and San Cristobal, Magali and Dou, Samir and Romé,
Véronique and Lippi, Yannick and Billon, Yvon and Père,
Marie-Christine and Boudry, Gaëlle and Gress, Laure and Iannucelli, Nathalie
and Mormède, Pierre and Quesnel, Hélène and Canario, Laurianne and
Liaubet, Laurence and Le Huërou-Luron, Isabelle Comparing the
intestinal transcriptome of Meishan and Large White piglets during
late fetal development reveals genes involved in glucose and lipid
metabolism and immunity as valuable clues of intestinal maturity.
(2017) BMC Genomics, Vol. 18. pp. 1-17. ISSN 1471-2164
Any correspondance concerning this service should be sent to the repository
administrator:
staff-oatao@listes-diff.inp-toulouse.fr
R E S E A R C H A R T I C L E
Open Access
Comparing the intestinal transcriptome of
Meishan and Large White piglets during
late fetal development reveals genes
involved in glucose and lipid metabolism
and immunity as valuable clues of
intestinal maturity
Ying Yao
1,2, Valentin Voillet
3, Maeva Jegou
1, Magali SanCristobal
3, Samir Dou
4, Véronique Romé
1, Yannick Lippi
5,
Yvon Billon
6, Marie-Christine Père
4, Gaëlle Boudry
1, Laure Gress
3, Nathalie Iannucelli
3, Pierre Mormède
3,
Hélène Quesnel
4, Laurianne Canario
3, Laurence Liaubet
3and Isabelle Le Huërou-Luron
1*Abstract
Background: Maturity of intestinal functions is critical for neonatal health and survival, but comprehensive description of mechanisms underlying intestinal maturation that occur during late gestation still remain poorly characterized. The aim of this study was to investigate biological processes specifically involved in intestinal maturation by comparing fetal jejunal transcriptomes of two representative porcine breeds (Large White, LW; Meishan, MS) with contrasting neonatal vitality and maturity, at two key time points during late gestation (gestational days 90 and 110). MS and LW sows inseminated with mixed semen (from breed LW and MS) gave birth to both purebred and crossbred fetuses. We hypothesized that part of the differences in neonatal maturity between the two breeds results from distinct developmental profiles of the fetal intestine during late gestation. Reciprocal crossed fetuses were used to analyze the effect of parental genome. Transcriptomic data and 23 phenotypic variables known to be associated with maturity trait were integrated using multivariate analysis with expectation of identifying relevant genes-phenotypic variable relationships involved in intestinal maturation.
Results: A moderate maternal genotype effect, but no paternal genotype effect, was observed on offspring intestinal maturation. Four hundred and four differentially expressed probes, corresponding to 274 differentially expressed genes (DEGs), more specifically involved in the maturation process were further studied. In day 110-MS fetuses, Ingenuity® functional enrichment analysis revealed that 46% of DEGs were involved in glucose and lipid metabolism, cell proliferation, vasculogenesis and hormone synthesis compared to day 90-MS fetuses. Expression of genes involved in immune pathways including phagocytosis, inflammation and defense processes was changed in day 110-LW compared to day 90-LW fetuses (corresponding to 13% of DEGs). The transcriptional regulator PPARGC1A was predicted to be an important regulator of differentially expressed genes in MS. Fetal blood fructose level, intestinal lactase activity and villous height were the best predicted phenotypic variables with probes mostly involved in lipid metabolism, carbohydrate metabolism and cellular movement biological pathways.
(Continued on next page)
* Correspondence:Isabelle.luron@inra.fr
1Nutrition Metabolisms and Cancer (NuMeCan), INRA, INSERM, Université de
Rennes 1, UBL, Rennes, Saint-Gilles, France
Full list of author information is available at the end of the article
© The Author(s). 2017 Open Access This article is distributed under the terms of the Creative Commons Attribution 4.0 International License (http://creativecommons.org/licenses/by/4.0/), which permits unrestricted use, distribution, and reproduction in any medium, provided you give appropriate credit to the original author(s) and the source, provide a link to the Creative Commons license, and indicate if changes were made. The Creative Commons Public Domain Dedication waiver (http://creativecommons.org/publicdomain/zero/1.0/) applies to the data made available in this article, unless otherwise stated.
(Continued from previous page)
Conclusions: Collectively, our findings indicate that the neonatal maturity of pig intestine may rely on functional development of glucose and lipid metabolisms, immune phagocyte differentiation and inflammatory pathways. This process may partially be governed by PPARGC1A.
Keywords: Maturity, Intestine, Lipid and glucose metabolism, Inflammation, Microarray, Pig
Background
Mortality rate of young children is the best indicator of child health [1]. Despite a sharp reduction in the last 15 years, the total under-5 years mortality rate in the world was still as high as 5.9% of all viable fetuses in 2015 [1]. A recent analysis pointed out that late gesta-tion to postnatal day 27 is the most at risk period com-pared to other age ranges considering its greatest relative probability of infant dying and its slowest decline from 2000 to 2015 [1]. Studying prematurity is a way to understand the important factors involved in survival. Preterm birth complications are the main causes for stillbirth and neonatal infant death, followed by inflam-mation, diarrhea, severe infections, and asphyxia [2]. Altered carbohydrate and lipid metabolisms were ob-served in preterm neonates [3, 4]. Moreover, increasing evidences suggest that impaired infection control could be attributed to underdeveloped immune system in pre-term newborns [5–7]. Therefore delayed physiological maturity at birth compromises adaptation to extrauter-ine life, and accordingly impairs perinatal survival and child health.
The intestine, as the major organ for nutrient absorp-tion and the largest immune organ, fulfills its maturaabsorp-tion until 28–112 days of age in neonates [8]. The frequency and severity of necrotizing enterocolitis (NEC), the most common and deadly intestinal disease in neonatal inten-sive care units, increase with the degree of prematurity [9]. Though still poorly understood, existing data suggest that immaturity of the intestinal innate immune system associated with improper microbiota colonization is pre-disposing risk factor for NEC [10, 11]. Moreover, the intrauterine growth restriction (IUGR) that modifies the developmental pattern of the intestine is associated with increased neonatal morbidity and mortality, and worsens the risk of enteral feeding-induced NEC in preterm babies [12–14].
Fetal development of the intestine can be divided into three successful phases: cell proliferation and morpho-genesis, cell differentiation and functional development [15]. The first two well-described phases that end at around 22 weeks of gestation in humans, result in a fetal intestine with a morphology close to that of the adult and with some functional capacities, related to the expression of digestive enzymes and nutrient transporters [16]. Functional acquisition of the mucosal immune
system appears during mid-late gestation, mostly explaining the high infection risk in premature infants [17]. Insufficient vascularization and motility play some intermediary roles in NEC-associated pathologies in pre-term infants, such as ischemia and pneumatosis [10, 18]. Moreover, no aboral transport of luminal content occurs in the intestinal tract of fetuses younger than 30 weeks of gestation while mature motor patterns are well established in term newborns [16]. A broad range of prenatal changes such as modification of endocrine secretion and intestinal functional capacities was reported to occur from day 90 of gestation up to term in pigs [19, 20]. Multiple time points during this late fetal stage were used to investigate the developmental pattern of intestinal functions in fetuses [14, 19], but these studies did not care about intestinal maturity. Thus, a more in-depth deciphering of the late developmental pattern of intestinal functions in individuals with different mortality rate at birth is a meaningful strategy to identify candidate bio-logical pathways and regulators of intestinal maturity and may provide clues for perinatal survival and adequate adaptation to enteral feeding.
Because of the difficulty of getting human intestinal samples during late fetal development, an alternative to currently used intestinal cell lines and organ cultures is to take the opportunity offered by animal models such as the pig that share similar physiologic and clinical features with humans. The pig is increasingly used as a hypersensi-tive model for pediatric gastroenterology [8, 21, 22]. The Large White (LW) breed, genetically-selected for lean growth and prolificacy, displays a high rate of mortality at birth due to a lower physiological maturity of newborn piglets, whereas the Chinese Meishan (MS) breed pro-duces piglets with extremely low mortality rate although lighter birth weight [23, 24]. We hypothesized that distinct developmental profiles of the fetal intestine during late gestation could contribute to the differences in neonatal maturity between the two breeds. Through transcriptomic analysis, our aim was to comprehensively clarify intestinal maturation with the expectation of finding relevant biological processes and regulators by using these two porcine breeds, divergent in neonatal morbidity and mor-tality, at two ages during the late fetal developmental stage. MS and LW sows were inseminated with mixed semen (from breed LW and MS). Thereby, each litter was composed of both purebred (LW or MS) and crossbred
fetuses (LWMS from MS sows and MSLW from LW sows). This reciprocal design was used to investigate the possible impact of parental genomes on intestinal maturation. Finally transcriptomic data and 23 pheno-typic variables (blood parameters, indicators of intes-tinal morphometry and digestive enzyme activities) already known to be associated with maturity trait were integrated using multivariate analysis in order to identify relevant sets of genes that correlate with changes in phenotypic variables.
Methods
Experiment design and animal sampling
The experimental design was previously described [25]. Briefly, nine MS and nine LW sows were inseminated with mixed semen (LW and MS) to get litters composed of both purebred (LW or MS) and crossbred fetuses (LWMS from MS sows and MSLW from LW sows). MS and LW breeds were chosen as two extreme breeds for piglet mortality at birth, a better survival rate being ob-served in MS piglets although they are lighter at birth. In addition, tissue developmental process was taken into account by sampling fetuses in two late fetal periods, at 90 and 110 days of gestation (duration of gestation is 114 days in swine). Therefore to determine changes in intestinal morphometry, enzyme activity and gene expres-sion and in blood parameters during maturation, jejunum and umbilical cord blood were sampled from 63 porcine fetuses in eight different conditions: two gestational ages (day 90 and day 110) associated with four genotypes. All fetuses used in this study are from the experiment previ-ously described by Voillet et al. [25] and were obtained by caesarean delivery. After laparotomy of the sow, piglets were individually exposed and blood was sampled separ-ately from the umbilical artery and vein and plasma stored at −20 °C. After section of the umbilical cord, the fetus was euthanized with an intracardiac injection of 3 M po-tassium chloride and a middle segment of jejunum was sampled and placed into RNAlater (Applied Biosystems) at 4 °C for 24 h and then maintained at−20 °C until RNA extraction. For morphometry, a 1-cm adjacent jejunum sample was collected, rinsed with cold phosphate buffered saline and fixed in 4% paraformaldehyde for 24 h until serial dehydration in ethanol and embedding in paraffin. Finally, mucosa was scraped from an adjacent 50-cm seg-ment, frozen in liquid nitrogen and stored at−80 °C until enzyme activity analysis. Three to five fetuses per litter were collected and weighted and their gender recorded. They were selected taking into account their body weight that was the closest to the mean body weight of each litter. These fetuses were genotyped with eight microsatellite markers, to discriminate the crossed breeds from the pure breeds. Thereby 80 male fetuses (10 fetuses per group) were selected. Finally 63 fetuses were analyzed for
microarray experiment according to RNA quality. Blood parameters, intestinal morphometry and enzymes were also analyzed on these 63 fetuses.
Analysis of blood parameters
Blood parameters were analyzed using standard methods listed in Additional file 1: Table S1. Glucose, fructose, lac-tate, albumin, cortisol, noradrenaline, adrenaline, dopa-mine, free and total thyroxine (T4), free and total triiodothyronine (T3), insulin like growth factor 1 (IGF1) were chosen as indicators of carbohydrate and protein metabolisms and hormonal regulation that are reported to be modified during the late gestational period and to differ according to genotypes [26, 27].
Intestinal morphometry and enzyme activity analysis
Villous and crypt sizes were determined on haematoxylin-eosin-stained jejunum sections. A minimum of 15 well-oriented villus and 10 well-well-oriented crypts were measured under a light microscope (Nikon Eclipse E40, Nikon Instruments, France) using an image analysis software (NIS-Elements AR 3.0, Nikon Instruments). The specific activities of lactase and aminopeptidase N were deter-mined in jejunum mucosa as previously described [28]. The protein concentration was measured according to the method of Lowry [29].
Intestinal RNA extraction and microarray description
Total RNA was extracted and quantified from individual jejunum samples as previously described [30]. The porcine microarray (8 × 60 K, GPL16524, Agilent Technology) used consisted in 43,603 probes derived from the 44 K Agilent-026440 porcine specific microarray (V2, for 71% of total probes), 3773 probes from immune system, 9532 probes from adipose tissue and 3768 probes from muscle tissue, as already reported [25]. After quality control and quantity normalization steps, fluorescence signal data from 63 microarrays containing 39,446 spots were avail-able for further statistical analysis and log2- transformed. Annotation was based on Voillet et al. (2014) data [25]. Nevertheless, all differentially expressed probes (DEPs) were double-checked and some probes were manually an-notated by sequence blasting against NCBI or Ensemble (release 84) databases. Annotation was firstly blasted in NCBI and Ensemble against the Sus scrofa genome, and when necessary, successively against human, Mus muscu-lusand Rattus norvegicus genomes when available. 90.2% of DEPs were annotated, raw data and information are available in NCBI (GEO accession number GSE90980).
Quantitative Real-time PCR analysis of differentially expressed genes
The mRNA levels of DEGs between groups on microar-rays were validated by relative quantitative Real-time
PCR (qRT-PCR). Two micrograms of total RNA isolated from jejunum (n = 6, isolated for microarray analysis) was reverse transcribed using High capacity cDNA reverse transcription kit (Applied Biosystems). qRT-PCR analysis was performed using Fast SYBR Green technol-ogy on StepOnePlus system (Applied Biosystems). The primers were designed using Primer3 (NCBI, Primer-BLAST). When possible, primer pairs are located on exon-exon junction (Additional file 2: Table S2). Two-fold dilution series of cDNA from pooled samples were used to measure the specific amplification efficiency of each primer pair (99–104%). PCR cycle of amplification con-sisted of denaturation at 95 °C for 3 s and hybridization and extension at 60 °C for 30 s. Quantification cycle values of genes were converted into raw data with the highest expressed sample as a calibrator. The relative expressions of target genes were acquired after normalizing to the highly stable reference genes identified using GeNorm [31]. In this experiment, PPIA (peptidylprolyl isomerase A) and TBP (TATA box binding protein) were identified as stable reference genes. Pearson’s correlations were cal-culated between microarray values and qRT-PCR relative expressions.
Statistical analysis
Analyses were performed using the R software version 3.1.3 [32].
Blood parameters, jejunum morphometry and enzyme activities were analyzed by a two-way analysis of variance (ANOVA) with gestational age (d90 and d110), genotype (LW, MSLW, LWMS and MS) and the interaction between gestational age and genotype as main fixed effects. Normality of data and homogeneity of variance were confirmed by Shapiro and Bartlett tests, respectively; data were Box-Cox transformed when their distribution was not normal. Models and procedures used to analyze transcriptomic data have been described in Voillet et al. [25]. A mixed linear model was applied to microarray data using two fixed effects (gestational age and fetal genotype), their interaction, and the sow as random effect, then compared to a reduced model by F-type test to iden-tify DEPs for gestational age and/or fetal genotype. After correction by False Discovery Rate (FDR), the list of DEPs with a FDR-adjusted P value <0.01 was distributed into four sub-models using the Bayesian Information Criterion (BIC). Sub-model 1 combined the two fixed effects and their interaction (complete model); sub-model 2 involved the two fixed effects in an additive manner (additive model); sub-model 3 concerned only the effect of gestational age (gestational age model); and sub-model 4 included only the fetal genotype effect (genotype model). Moreover, to analyze the parental impact, a mixed linear model involving the two parental genotypes (maternal genotype and paternal genotype), the
gestational age, and their interactions was applied to microarray data [25].
Functional enrichment analysis and pathway analysis
Functional enrichment analysis of DEPs in purebred LW and MS was supplied by GeneCoDis 3.0 software [33] focused on Gene ontology (GO) Biological Process (BP), using the Homo sapiens genome (Ensembl 65 release) as reference. Functional enrichment analysis was applied on DEPs of the complete model with absolute log2-fold change ≥0.5 (corresponding to an absolute fold change 1.4) between day 90 and day 110. To set the statistical enrichment of a particular biological function, a hyper-geometric test was used. All P-values were adjusted using the FDR approach (FDR < 0.01).
DEPs of the complete model in purebred LW and MS that meet the conditions described above (adjusted P value ≤0.01 and absolute log2-fold change ≥0.5) were subjected to Ingenuity® Pathway Analysis [34] (IPA; Ingenuity Sys-tems, Qiagen, USA) for literature-based biological analysis. Standard settings of the network toolbox were applied with absolute log2-fold change≥0.5, adjusted P-value ≤0.01 and direct relationships. The Upstream Regulator Analysis was performed to identify potential upstream transcriptional regulators and ligand-dependent nuclear receptors of dif-ferentially expressed genes. The Fisher’s exact test P-value was used to calculate the probability that the observed and predicted regulated gene sets were unlikely to be iden-tified by chance alone. To evaluate the matching between observed and predicted up/down regulation patterns, acti-vation z-scores were also determined.
Multivariate integration and regression analysis
Multivariate statistics were used to select highly relevant genes that may predict phenotypic variable variation. We assessed the ‘uni-directional’ relationships between microarray dataset and phenotypic variables. The dataset used here including all expressed probes. For this pur-pose, the probes were considered as predictors of pheno-typic variables using the sparse partial least square regression model (sPLS) implemented in mixOmics R package [35]. sPLS regression is related to classical PLS regression but it proceeds with additional variable selec-tion that reduces noisy data and increases the predictive performance of the model, especially when the number of variables is far greater than the number of samples [36]. The number of genes selected in the first four com-ponents was tuned by Q2 criterion (> 0.09) to obtain the best predictive performance [37–39]. Mean square error of prediction (MSEP) and R2 were computed to assess the quality of prediction. With this approach, we finally retained the first component (Q2 = 0.21) and all gene-phenotypic variable relationship with an absolute correl-ation score > 0.75 to build a regression network with
sPLS gene-phenotypic variable relationship. In order to provide a more biological integrative view of this model, we proceeded with a functional annotation of sPLS selected-genes using IPA network toolbox. Cytoscape (version 3.4.0) was used for network illustration.
Results
Intestinal morphometry and enzyme activities
Villous surface and height increased with fetal age (P < 0.001) (Fig. 1). Purebred LW fetuses had lower villous surface and height compared to purebred MS at day 90 (P < 0.05) and compared to the other three genotypes at day 110 (P < 0.05). Irrespective of genotype, fetuses at day 110 had greater crypt surface and crypt depth and lower crypt width (P < 0.001), while the effects of genotype and the genotype × gestational age interaction were not signifi-cant (Fig. 1). Lactase and aminopeptidase N activity increased with age (P < 0.001), but were affected neither
by genotype nor by the genotype × gestational age interaction (Fig. 2).
Blood parameters
Fourteen blood metabolites and hormones were ana-lyzed in both umbilical artery and vein. These parame-ters were chosen as indicators of metabolic changes that occur late in gestation. Similar trends in parameters between artery and vein were found (Additional file 1: Table S1). Briefly, most of the parameters differed with gestational age: albumin (12.4%; 12.8%), cortisol (208.6%; 152.1%), noradrenaline (76.0%; 135.7%), dopamine (89.7%; 98.3%), total T4 (26.9%) and free T4 (10.1%) increased be-tween day 90 and day 110 of gestation while fructose (66.5%; 65.1%), lactate (42.2%; 39.8%) and adrenaline (82.4%; 62.2%) decreased during the same age period, in arterial and venous blood, respectively. Interestingly, blood fructose levels were 2.7–3.9 fold higher than glucose ones in fetuses at 90 days of gestation whereas differences
Fig. 1 Jejunum morphometry in fetuses with different genotypes (Genotype) at 90 and 110 day of gestation (Time). Data are means ± SEM, n = 6–9/group. Means not sharing the same superscript letter differed significantly (P ≤ 0.05); * P ≤ 0.05 for the effect of gestational age (Time). LW, purebred fetuses from Large White sows; MSLW, crossbred fetuses from Large White sows; LWMS, crossbred fetuses from Meishan sows; MS, purebred fetuses from Meishan sows
were no more observed at 110 days of age, illustrating possibly crucial role of fructose to stimulate growth of porcine fetus [40, 41]. The effect of genotype was signifi-cant for fructose (crossbred fetuses from LW sows, MSLW, had the highest fructose in artery and vein while crossbred fetuses from MS sows, LWMS, had the lowest fructose), albumin (purebred MS fetuses had the highest albumin in artery and vein while purebred LW fetuses had the lowest albumin in artery and vein) and T4 (cross-bred fetuses from LW sows, MSLW, had the highest total and free T4 while purebred LW fetuses had the lowest total and free T4). Finally the gestational age × genotype interaction was significant for lactate, albu-min and T4.
Influence of parental genotype on gene expression
Effects of paternal genotype or maternal genotype on intestinal maturation were detected by reciprocal crossing. Surprisingly, no probe was influenced by paternal geno-type. Only 28 DEPs (corresponding to 18 unique differen-tially expressed genes, DEGs) were found as affected by maternal genotype in interaction with gestational age (FDR < 0.05, Additional file 3: Table S3). Principal compo-nent analysis (PCA) analysis of the 28 DEPs illustrated the moderate effects of the maternal genotype (PC1 = 44.2%,
PC2 = 12.1% and PC3 = 10.0% of the total variance; Fig. 3a and b). However, PC1 mainly separated data from purebred MS fetuses at day 90 from those of purebred LW fetuses, PC2 separated data from fetuses from MS sows at day 110 from those of fetuses from LW sows, and PC3 separated data from fetuses from LW sows at day 90 from those of fetuses from MS sows at day 90.
Eighty-two percent of the 28 DEPs were identified in the complete model (Additional file 3: Table S3), among which 11 unique DEGs were only differentially expressed in MS, with absolute log2-fold change≥0.5, between day 110 and day 90. Spermine synthase (SMS) and SRPX2 genes are specifically located on the X chromosome. As only male fetuses were chosen in this study, these two genes were of maternal origin. The expression profile of SRPX2gene (Fig. 4a) illustrated how the maternal effect is observed at 90 days of gestation. Functional analysis of these genes indicated that they are involved in activa-tion of cell generaactiva-tion and differentiaactiva-tion, metabolism and angiogenesis.
Taken together, a barely effect of parental genome was found on offspring fetal intestinal maturation, and most of genes affected by the maternal genotype were identi-fied in the complete model. Considering our aim was to decipher candidate biological pathway and genes that
Fig. 2 Jejunum lactase and aminopeptidase N activities in fetuses with different genotypes (Genotype) at 90 and 110 day of gestation (Time). Data are means ± SEM, n = 6–9/group. * P ≤ 0.05 for the effect of gestational age (Time). LW, purebred fetuses from Large White sows; MSLW, crossbred fetuses from Large White sows; LWMS, crossbred fetuses from Meishan sows; MS, purebred fetuses from Meishan sows
shape intestinal maturity, the complete model which combined joint differences between gestational age and fetal genotypes was therefore worthy of further analysis.
Identification of intestinal DEPs
A total of 9518 probes was identified as differentially expressed (with a significant threshold of 1% with FDR cor-rection) and divided into four sub-models using the BIC criterion (Additional file 4: Table S4). The complete model involved 404 DEPs corresponding to 274 unique DEGs. This smallest subset of DEPs was the most meaningful for analyzing the indices of intestinal maturity. In other words, these 274 genes were involved in late intestinal develop-mental process with differences between genotypes.
The use of PCA for each model enabled to assess and visualize the experimental design power. Con-cerning the complete model, PC1, PC2 and PC3 ex-plained 29.6, 15.2 and 12.9% of the total variance and segregated fetuses according to their gestational ages and purebred genotypes (Fig. 3c and d showed a clus-ter with the data from fetuses at day 90 while a high dispersion of data from fetuses at day 110), illustrating the interaction between gestational age and genotype effects. The PCA results of other three sub-models were shown in Additional file 5: Figure S1.
Ontological analysis of DEGs between both gestational ages and purebred genotypes
A functional enrichment analysis was performed on DEPs from the complete model to identify enriched
biological processes (BP) during late fetal intestinal maturation using GeneCodis. Using the threshold of absolute log2-fold change ≥0.5, 80 DEPs (corresponding to 49 unique DEGs) were overexpressed at day 90 compared to day 110 and 161 DEPs (corresponding to 95 unique DEGs) were overexpressed at day 110 com-pared to day 90 (Additional file 4: Table S4). Overall the functional enrichment analysis revealed that dramatic changes occurred between gestational age day 90 and 110 (Additional file 6: Table S5). At 110 days of gesta-tion, most of the induced genes were involved in hormone regulation and nutrient metabolism (e.g. lipid, nitrogen compound and nutrient metabolism, glucocortic-oid and insulin signaling, gluconeogenesis and oxidation-reduction processes). In addition, axon guidance and immunity signaling (e.g. complement activation, chemo-taxis, response to stress, blood coagulation and immune response) were also modulated during the late period of gestation. Conversely, genes whose expression was re-duced at day 110 were included in the following biological pathways: SMAD protein signal transduction, xenobiotic metabolism, transmembrane transport, blood coagulation, regulation of cell proliferation and transcription, and proteolysis.
Genes involved in these enriched BPs were further an-alyzed separately according to each purebred genotype (Table 1). Interestingly, the number of up-regulated genes involved in glucose and lipid metabolic processes at day 110 was higher in MS than in LW. In contrast the number of up-regulated genes at day 90 was close
Fig. 3 PCA of the maternal effect (a, b) and the complete model (c, d). LW, purebred fetuses from Large White sows; MSLW, crossbred fetuses from Large White sows; LWMS, crossbred fetuses from Meishan sows; MS, purebred fetuses from Meishan sows
between LW and MS for most of BPs. It is noteworthy that four genes, whose expressions were different ac-cording to gestational age, were oppositely expressed in LW and MS (Table 2). Sushi-repeat containing protein x-linked 2 (SRPX2), up-regulated in MS while down-regulated in LW at day 110 compared with day 90, was found as a promoter of angiogenesis and neuronal devel-opment. Conversely, the probes coding chemokine lig-and 2 c-c motif (CCL2) lig-and guanylate binding protein 1 (GBP1) genes involved in inflammation and defense process, were over-expressed in LW and under-expressed in MS at day 110 compared with day 90.
GOBP functional enrichment was further con-firmed using disease and function analysis of IPA
(Fig. 5; Additional file 7: Table S6). In day 110-MS compared to day 90-MS fetuses, pathways of fatty acid metabolism, hormone synthesis, cell proliferation, vasculogenesis and neurodevelopment were predicted to be activated. In LW, activation of phagocytes and their immune response and inhibition of their apoptosis were found at day 110 compared to day 90. Among these enriched genes, glucose 6 phosphatase catalytic subunit (G6PC), phosphoenolpyruvate carboxykinase 1 (PCK1), lactate dehydrogenase A (LDHA), peroxisome proliferator-activated receptor gamma coactivator 1 alpha (PPARGC1A), insulin like growth factor 1 (IGF1) receptor (IGF1R), mito-gen activated protein kinase kinase 1 (MAP2K1), mamma-lian target of rapamycin (mTOR), SRPX2 and CD163 were
Fig. 4 Box-plot representation of genes differentially expressed in fetuses with different genotypes at 90 (d90) and 110 day of gestation (d110). a Genes up-regulated in day 110-MS compared to day 90-MS. b Genes up-regulated in LW compared to MS at day 110. c Genes up-regulated in MS compared to LW at day 110. The gene expression was log2 transformed. LW, purebred fetuses from Large White sows; MS, purebred fetuses from Meishan sows
up-regulated in MS compared to LW at day 110, while platelet factor 4 (PF4), CCL2 and GBP1 were up-regulated in LW compared to MS at day 110 (Fig. 4). Taken together, the distinct patterns of gene expression profiles and involved BPs in MS and LW genotypes at two key time points of gestational development illus-trate major differences in intestinal maturation between purebred MS and LW fetuses.
Identification of upstream regulators
We next thought to find upstream regulators that could explain the observed shifts in gene expression profiles and to identify candidate genes for prenatal intestinal maturation. Two ligand-dependent nuclear receptors and three transcriptional regulators were selected with an absolute activation z-score ≥ 2 in at least one geno-type (Table 3). Nuclear receptor subfamily three group c
Table 1 Enriched GOBPs at day 90 or 110 in the two purebred genotypes
Day Items GOBP Terms Genes
110 GO:0006957 complement activation C9 VSIG4 GO:0034641 cellular nitrogen compound, metabolic process SMS BCKDHB GO:0006094 gluconeogenesis PPARGC1A PCK1 GO:0008286 insulin receptor signaling pathway MTOR MAP2K1 IGF1R GO:0032868 response to insulin stimulus MTOR PCK1 GO:0051384 response to glucocorticoid stimulus MAP2K1 BCKDHB GO:0007584 response to nutrient MTOR BCKDHB GO:0055114 oxidation-reduction process CYP3A4 ACOX2 GO:0006629 lipid metabolic process BTNL3 APOD PCK1 GO:0006935 chemotaxis PF4 MAP2K1
GO:0008380 RNA splicing CCAR1 RNPC3 PPARGC1A JMJD6 GO:0006805 xenobiotic metabolic process CYP3A4 CYP17A1
GO:0006950 response to stress HSPB8 HSPA8 GO:0007411 axon guidance MAP2K1 LGI1
GO:0007165 signal transduction PRKG2 MTOR MAP2K1 FGL2 IGF1R PDE11A RASAL2 GO:0007596,
GO:0030168
blood coagulation, platelet activation PRKG2 PF4 PDE11A GO:0006955 immune response TCF12 PF4 IGHA1 IGF1R 90 GO:0060395 SMAD protein signal transduction BMP2 HNF4A
GO:0006805 xenobiotic metabolic process GSTA1 CYP11A1 HNF4A ALDH2 GO:0055085,
GO:0006811
transmembrane transport, ion transport KCNS3 AQP10 SLC38A3 GO:0007596 blood coagulation ANXA8 HNF4A GO:0008285 negative regulation of cell proliferation LEPREL1 BMP2 HNF4A GO:0045893 positive regulation of transcription BMP2 HNF4A GO:0006508 proteolysis TPSD1 CPE
In italic, genes are up-regulated in MS only, and in bold, genes are up-regulated in LW only. Genes up-regulated in both MS and LW are not represented (see details in Additional file6: Table S5)
Table 2 Gestational age-affected probes with opposite expression between LW and MS
Gene Probe BH Log2-Fold Change between day 110 and 90 in LW Log2-Fold Change between day 110 and 90 in MS Main GOBPs
CCL2 A_72_P412643 6.27E-07 0.562774745 −0.776799778 GO:0006954 inflammatory response CCL2 A_72_P675364 3.57E-07 0.598172442 −0.755798549 GO:0006954 inflammatory response GBP7 O10866 3.90E-06 0.713558263 −0.653564571 GO:0003924 GTPase activity
GBP1 gi|115,551,583|dbj|AK239047.1| 4.51E-05 0.697887594 −0.51343506 GO:0060333 interferon-gamma-mediated signaling pathway
SRPX2 A_72_P210412 1.00E-05 −0.635376842 0.6315505 GO:0001525 angiogenesis, GO:0051965 positive regulation of synapse assembly
member1 (NR3C1, also known as glucocorticoid hor-mone receptor, GR) and thyroid horhor-mone receptor beta (THRB) were predicted to be active in both breeds though on a higher magnitude in MS, somehow illustrat-ing similarity in upstream regulation between MS and LW genotypes. NR3C1 was found in the fetal genotype model with a higher expression in LW compared to MS (Additional file 8: Figure S2) while THRB was found in the gestational age model with a decreased expression at day 110 compared to day 90. In addition to catenin beta 1 (CTNNB1) and signal transducer and activator of tran-scription 6 (STAT6), PPARGC1A was predicted to be active in day 110-MS fetuses. PPARGC1A (also known
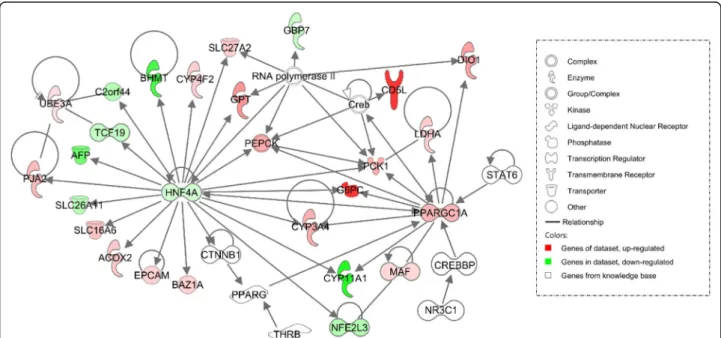
Fig. 5 IPA network approach using Disease and Function analysis applied to DEGs in MS (a) and LW (b) at day 110 compared to day 90. Genes in red and green were up-regulated or down-regulated in the study dataset, respectively. A higher color intensity means the higher degree of up or down-regulation, respectively. LW, purebred fetuses from Large White sows; MS, purebred fetuses from Meishan sows
Table 3 Upstream regulators of DEGs in purebred fetuses at day 110 compared to day 90
Upstream regulators Activation z-score LW MS NR3C1a 1.1 2.41 THRBa 1.2 2.18 PPARGC1Ab 2.23 CTNNB1b 2.18 STAT6b 2 a
ligand-dependent nuclear receptors,b
Transcriptional regulators. In italic, the upstream regulator is expressed in the complete model. The upstream regulators with an absolute activation z-score≥ 2 in MS or LW are only displayed
as PGC1α) the only upstream regulator from the complete model (Fig. 6) is known to be involved in regu-lation of fatty acid metabolism, vasculogenesis and hor-mone synthesis (Fig. 5a) as well as in gluconeogenesis. Taken together, PPARGC1A was identified as a potential important upstream regulator of several DEGs in day 110-MS fetuses.
Relationship between phenotypic variables and expression of genes
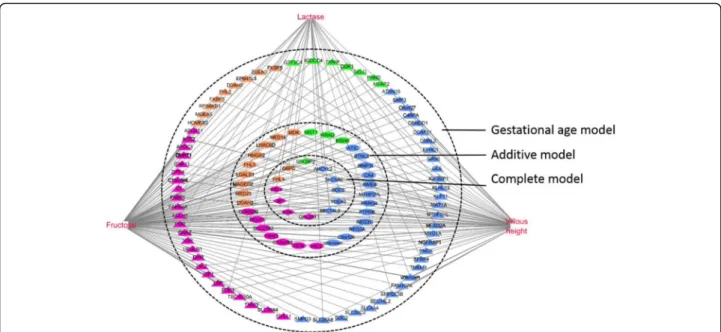
In the frame of complex systems biology, interactions between phenotypic and transcriptomic data can be explored using multivariate statistics. sPLS regression was used to assess the relationships between 23 pheno-type items (seven indices of intestinal morphometry, two indices of intestinal digestive enzyme activity and 14 blood parameters) and gene expression. All expressed probes were used for analysis. Blood fructose level, intestinal lactase activity and villous height were the phenotypic variables best predicted by probes co-variation (mean squared error prediction = 0.28, 0.35 and 0.38, respectively). Functional analysis of these 450 probes (corresponding to 250 unique annotated genes) using IPA network identified lipid metabolism, carbohydrate metabolism and cellular movement as the top over-represented biological pathways (Fig. 7; Additional file 9: Table S7). Blood fructose level covaried with 15 genes involved in carbohydrate metabol-ism, 36 genes involved in lipid metabolism and 11 genes involved in cellular movement. Among them, seven genes
identified in the complete model were positively (FHL3) or negatively (G6PC, DIO1, KHK, GPT, GAL3ST1 and SDCBP2) correlated to blood fructose level. Similarly, lactase activity covaried with seven genes involved in carbohydrate metabolism, eight genes involved in lipid metabolism and two genes involved in cellular movement. Among them, four genes were identified in the complete model and were positively (G6PC, DIO1 and KHK) or negatively (FHL3) correlated to lactase activity level. Finally villous height covaried with 11 genes involved in carbohydrate metabolism, 20 genes involved in lipid me-tabolism and four genes involved in cellular movement. Among them, seven genes that identified the complete model were positively (G6PC, DIO1, KHK, GPT, GAL3ST1 and SDCBP2) or negatively (FHL3) correlated.
Validation of differential gene expression by qRT-PCR analysis
To validate microarray results, seven differentially expressed genes of interest were selected to perform qRT-PCR. As shown in Table 4, the Pearson’s correlations between expression profiles of these genes measured by microarray and PCR was greater than 0.8 for all genes ex-cept CIRBP. The similarity of results between qRT-PCR and microarray confirmed the reliability of our microarray data (Additional file 10: Figure S3).
Discussion
The use of a relevant experimental design (eight condi-tions in a two by four factorial design) leading to
Fig. 6 Network 1 (carbohydrate and lipid metabolism, energy production) in MS at day 110 compared to day 90 using IPA. Genes in red and green were up-regulated or down-regulated in the study dataset, respectively. A higher color intensity means the higher degree of up or down-regulation, respectively. Genes in white were from the knowledge base
contrasting situations in terms of late fetal maturation as-sociated with the selection of DEPs (FDR-adjusted P value <0.01) highlighted the impact of complex relationships between gestational age and fetal genotype on maturity of the intestine. No paternal genotype effect occurred while that of maternal genotype was moderate and mainly ob-served at 90 days of gestation. Overall 4794 unique DEGs (9518 DEPs, 24.1% of expressed probes of the microarray with FDR of 1%) were found valuable. The GO functional enrichment analysis revealed that the dramatic changes in intestinal gene expression that occurred between gesta-tional age day 90 and day 110 concern genes involved in hormone regulation, nutrient metabolism, immune signal-ing and neuronal development. Furthermore, differences in the developmental pattern of the intestine were
observed during late gestation between the two porcine breeds, divergent in neonatal morbidity and mortality and with higher survival rate in MS piglets. Lipid and glucose metabolisms, cell proliferation, vasculogenesis and neuro-development pathways were activated in the intestine of day 110-MS compared to day 90-MS fetuses whereas im-mune pathways including phagocytosis, inflammation and defense processes differed between day 110-LW and day 90-LW fetuses. PPARGC1A (also known as PGC1α) was identified as a potential upstream regulator of DEGs in MS. Finally the multivariate analysis indicated that blood fructose, and intestinal lactase activity and villous height were the three phenotypic parameters explained with the highest score by overlapping clusters of DEGs.
Impact of parental genotype
Our experimental design included both pure breeds and the reciprocal crossed fetuses, allowing the exploration of the effect of paternal and maternal genotypes. No paternal genotype effect and only a moderate maternal genotype effect on intestinal gene expression (18 DEGs) were found in the current study. In contrast, a preferen-tial paternal genotype effect was found on the gene expression in the piglet muscle from the same experi-ment [25], confirming that the parental genotype effect is a tissue-specific effect [42]. Thus, we focused on the complete model for identifying the main biological mechanisms of prenatal intestinal maturity.
Fig. 7 Network of relationships between phenotypic variables and microarray data selected within the first component of the sPLS analysis. Retained all gene-phenotypic variable pairs showing an absolute correlation score > 0.75. Related biological functions of selected genes was analyzed using IPA. Red nodes, phenotype items (blood fructose level, jejunum lactase activity and villous height); pink symbols, genes involved in lipid metabolism; orange symbols, genes involved in carbohydrate metabolism; green symbols, genes involved in cellular movement; blue symbols, other biological functions; diamond shape symbol indicates a differential expressed gene that was included in the complete model; elipse symbol indicates a differential expressed gene that was included in the additive model; triangle symbol indicates a differential expressed gene that was included in the gestational age model. sPLS, spare Partial Least Squares; IPA, Ingenuity Pathway Analysis
Table 4 Correlation between qRT-PCR expression and microarray data for selected genes
Genes Pearson’s correlation P value
CCL2 0.93 <0.001 CD163 0.83 <0.001 CIRBP 0.61 <0.001 FABP1 0.97 <0.001 GBP1 0.82 <0.001 G6PC 0.88 <0.001 PPARGC1A 0.82 <0.001
Biological implication of gene regulation in MS and LW during late gestation
Eighty percent of DEPs (7632 DEPs corresponding to 3866 DEGs) were influenced by the fetal gestational age (distributed among the gestational age model, the addi-tive model and the complete model), demonstrating the great switch of gene expression that occurred between day 90 and day 110 of gestation. This was already observed in muscle development at the end of gestation in pig [25] and in sheep [43]. The wide changes in intes-tinal gene expression at the end of gestation confirm this gestational phase as a critical period for intestinal func-tional maturation. Accordingly 70% of DEGs that best explained the gestational age- and genotype-induced changes (first component of sPLS analysis) of the first three selected phenotype parameters (blood fructose, intestinal lactase activity and villous height) in the multi-variate analysis were included in the gestational age model. Similarly, functional maturation of the fetal in-testine occurs during mid-late gestation in humans [16]. Indeed most of the digestive enzymes, nutrient transporters and molecules involved in lipid and glucose metabolism measured in the human fetal intestine begin to be detectable shortly after the period of morphogenesis and increase with gestational age [16, 44].
The gestational age-induced developmental pattern of genes involved in glucose and lipid metabolism discrimi-nated the two porcine genotypes, providing further evidences that these key genes and biological functions are involved in maturation of piglet intestine. Body en-ergy reserves, i.e. glycogen and fat, are important predis-posing factors involved in the maturation of liver and muscle [45, 46]. Muscle transcriptomic analysis has pre-viously underlined the higher ability of MS fetuses to store and mobilize glycogen, known to be essential for early postnatal survival [25]. Consistent with these data, the expression of G6PC, PCK1 and LDHA was increased in the intestine of day 110-MS fetuses (Fig. 4a and c). In preterm piglets the intestinal expression of LDHA was previously reported to be down-regulated [47]. The gene PPARGC1A (or PGC1ɑ) is a transcription coactivator that modulates metabolic pathways after binding to dif-ferent transcription factors [48, 49]. The knockdown of PGC1ɑ in mice almost abolishes the expression of PCK1 and G6PC [50]. Insulin and IGFs by binding to IGF1R exert multiple mitogenic effects through activation of numerous signaling pathways like phosphaitidylinositol 3 kinase (PI3K) and MAPK. mTOR belongs to the PI3K related kinase family, integrates signals from growth fac-tors, nutrients, energy and stress (hypoxia, DNA dam-age) to induce metabolism response and regulate the cell cycle that is required for embryonic development [51]. Therefore the increased expression of both PPARGC1A and targeted genes such as mTOR, IGF1R and MAP2K1,
exclusively in day 110-MS fetuses (Fig. 4a and c) could explain the activated glucose and lipid metabolic pro-cesses and cell proliferation in MS at day 110 of gesta-tion and participate to the better survival rate of MS neonates. A greater energy reserve would better meet the high demand of the intestine for growth and func-tions at birth, and thereby potentially promote mucosal barrier development in agreement with the higher villous size measured in the intestine of day 110-MS fetuses. In addition the specific up-regulation of SRPX2 and PPARGC1A expression in MS between day 90 and day 110 would promote angiogenesis thereby increasing nutrient supply to other organs, which is good for survival. Defaults in intestinal vasculature are also risk for postnatal enteral feeding in preterm neonates [18]. Overall one valuable key for maturity of the intestine could be a well-developed epithelial barrier and its vascularization associated with activated metabolic pro-cesses that provide energy reserves for functioning of other organs.
Another major difference between the two genotypes was the developmental pattern of the intestinal immune system. In contrast to MS, genes up-regulated at day 110 of gestation in LW are involved in phagocyte activation and inflammation (PF4, CCL2 (also known as monocyte chemoattractant protein, MCP1) and GBP1) (Fig. 4b). PF4 is released from activated platelets, acts to facilitate blood clotting and plays a key pro-inflammatory role in inflammatory bowel disease and NEC [17, 52]. CCL2 is a chemokine secreted by monocytes, macrophages and endothelial cells; a higher CCL2 secretion was reported in immature human intestine compared to mature xeno-graft [9]. GBP1, induced by interferon, is involved in early activation of immune response to pathogen infection [53]. Moreover a lower expression of CD163 (Fig. 4c) and transforming growth factor beta 2 (TGFB2) (Additional file 8: Figure S2) was observed in day 110-LW fetuses compared to day 110-MS. CD163 is a differentiation marker of the macrophage lineage with increased ex-pression along the differentiation process [54]. Pro-inflammatory monocytes from blood differentiate into non-inflammatory intestinal resident macrophages when stimulated by TGFB2 [55, 56]. Therefore a lower CD163 and TGFB2 expression in day 110-LW may indicate less mature monocytes in LW intestine. TGFB2 also improves immune development of immature intestinal epithelial cells, thereby preventing their excessive inflammatory response [57–59]. Expression and activity of TGFB2 were decreased in intestinal tissues from NEC patients [55]. In our study TGFB2 expression decreased between day 90 and day 110, but to a higher extent in LW. In contrast the expression and activity of TGFB2 in the intestine was reported to increase with advanced gestational age in humans and pigs, even though TGFB2 level is still low in
human babies and pig neonates [17, 55, 60]. Further exploration is needed for understanding this discrepancy. The differentiation of maturated pro-inflammatory monocytes into intestinal resident macrophages and the progressive suppression of inflammation in intestinal epithelium cells are crucial for neonatal intestinal homeostasis and bacterial tolerance [17]. Overall the defective intestinal immune capacity associated with a higher pro-inflammatory status may indicate a lower immune defense ability and a higher risk of inflamma-tory response to environmental pathogens in LW neo-nates, that may participate to the higher morbidity and mortality scores reported in LW compared to MS neonates.
Upstream regulators for prenatal intestinal maturity
IPA analysis revealed five upstream regulators with z-score ≥ 2. NR3C1 (also known as glucocorticoid receptor, GR), with a higher z-score in day 110-MS than in day 110-LW fetuses, is involved in major physiological functions, including metabolism, cell growth and differen-tiation and immunity [61]. Glucocorticoids are well known to be involved in the late gestation to prepare organs to extra-uterine environment [45]. Serum cortisol level was reported to be higher and total GR expression in the liver was lower in newborn Erhualian piglet (a Chinese indigen-ous breed, close to MS) compared to LW piglet [62]. Consistently, similar breed differences in intestinal NR3C1 expression were observed between MS and LW at day 110 (Additional file 8: Figure S2). PPARGC1A upstream regu-lator also displays a high activation z-score in MS and its expression is higher in day MS compared to day 110-LW fetuses (Fig. 4c). In addition PPARGC1A is related to other upstream regulators and target genes of PPARGC1A were found to be consistently induced, making it the most interesting upstream regulator retrieved in our study. PPARGC1A has been reported to primarily regu-late energy metabolism, especially fatty acid metabolism and gluconeogenesis, according to the nutrient/hormo-nal environment [48, 50]. In addition, activation of PPARGC1A is also of interest as it has being documented to coordinate the expression of anti-inflammatory proper-ties and vascularization [49].
Integration of blood and intestinal phenotypic variables and intestinal transcriptome
To get insight into the relationships between phenotype items and gene expression and to identify the key vari-ables which can explain the biological outcomes of inter-est, sPLS was used to combine the phenotypic and microarray datasets without considering the fixed effects of fetal genotype and gestational age. Our correlation analysis revealed strong relationships between jejunum gene expression patterns and three phenotypic variables
(blood fructose level, intestinal lactase activity and intes-tinal villous height). Piglet genotype did not modify the gestational age-induced increase in lactase activity, whereas it tended to modify the gestational age-induced changes in villous height (increase between day 90 and day 110) and blood fructose level (decrease between day 90 and day 110). Indeed, at day 110, higher values for villous height were observed in purebred MS and cross-bred fetuses compared to purecross-bred LW and the lowest values of fructose level were observed in crossbred MS and purebred MS. Blood fructose level was mostly corre-lated with genes involved in carbohydrate and lipid metabolisms, such as ketohexokinase (KHK), deiodinase 1 (DIO1) and G6PC (Fig. 7). Because of physiological differences in placentation between the two species, fructose is the primary hexose in the fetal pig blood but not in that of human [27]. Recently, fructose was dem-onstrated to stimulate trophectoderm cell proliferation and hyaluronic acid production, as did glucose, promot-ing the growth and development of the conceptus [63]. In addition, hyaluronic acid is an important promoter of embryonic vasculogenesis [64] and fructose has a better ability to stimulate anabolic metabolism than glucose in hepatocyte and cardiomyocytes through the action of KHK [65]. Therefore, the higher expression of genes involved in energy metabolism associated with the lower fructose level in day 110-MS fetuses may indicate advanced intestinal maturity in MS compared to LW piglets. Our data corroborates a recent metabolomics ana-lysis in human neonates showing that insulin-dependent metabolism was inhibited in preterm compared to term babies [3]. Villous height was previously used as an intes-tinal maturity marker; the increasing villous height with fetal age means a greater absorptive area for enteral nutri-tion at birth [16]. Covarying with villous height, up-regulated expression of genes involved in carbohydrate and lipid metabolisms as well as in cellular movement such as G6PC, KHK and syndecan binding protein (or syntenin) 2 (SDCBP2), was observed in day 110-MS fetuses (Figs. 4c and 7). As discussed above, a higher metabolic activity could provide nutrient and energy for enterocyte proliferation and intestinal development. Moreover, SDCBP2 was proved to affect cell survival and cell division through its high affinity to plasma membrane and nuclear phosphatidylinositol 4,5-bisphosphate [66]. Finally it is well known that increase in lactase expression is concurrent with the fetal increase in duodenal villi size and peaks at birth to handle milk lactose digestion [16]. Consistently, the gestational age-induced lactase activity was correlated with genes involved in energy metabolism. It is noticeable that the number of genes correlated with lactase activity changes and identified in the complete model was much lower than those correlated with blood fructose and villous height variables, suggesting that fetal
intestinal lactase development is predominately an intrinsic age-related program [67]. Taken together, the three phenotypic variables highlighted in the current study were remarkably explained by clusters of overlapping DEGs. The additional analysis of phenotypic variables related to the mucosal immune system warrants fur-ther investigations.
Conclusion
The results of this exploratory study provide a compre-hensive overview of prenatal intestinal maturity. Consider-able transcriptomic changes occurred during late gestation and were genotype-dependent. Improved epithelial struc-ture and anabolic metabolism in day 110-MS fetuses highlighted the importance of mature intestinal metabolic capacities in neonates, corroborating the fact that meta-bolic dysfunction is associated with higher mortality risks in preterm infants. Blood fructose playing a great role in carbohydrate and lipid metabolism during late gestation was identified as a valuable clue of intestinal maturity and we propose that PPARGC1A, as an upstream gene regula-tor, may be a useful target to evaluate it. On the other hand, activated phagocytes and inflammatory response in day 110-LW fetuses may correlated to the delay in in-testinal differentiation of macrophages and epithelial cells during late intestinal maturation. The expression profiles of genes related to immunity (PF4, CCL2, GBP1, CD163 and TGFB2) that could be valuable in-dicators of intestinal immune maturity in neonates, warrant further investigations with validation in the immature intestine of preterm newborns or neonates with intra-uterine growth retardation.
Additional files
Additional file 1: Table S1. Concentration of blood parameters from umbilical cord of purebred fetuses (LW or MS) and crossbred fetuses (LWMS and MSLW) at 90 and 110 days of gestation [68–71]. (PDF 351 kb) Additional file 2: Table S2. Primer sequences used for qRT-PCR. PPIA, peptidylprolyl isomerase A; TBP, TATA box binding protein; CCL2, C-C motif chemokine ligand 2; CIRBP, cold inducible RNA binding protein; FABP1, fatty acid binding protein 1; GBP1, guanylate binding protein 1; G6PC, Glucose 6 phosphatase; PPARGC1A, peroxisome proliferator-activated receptor gamma coactivator 1-alpha. (PDF 160 kb)
Additional file 3: Table S3. Complete list of DEPs depending on parental genotype effect. (XLSX 13 kb)
Additional file 4: Table S4. Complete list of DEPs in the four sub-models. The complete model involved 404 DEPs corresponding to 274 unique DEGs. The additive effect of gestational age and genotype was observed for 2871 DEPs corresponding to 1771 unique DEGs (30.2%). The gestational age effect that led to 4357 DEPs corresponding to 2462 unique annotated genes was the largest portion of DEPs (45.8%) while the effect of the fetal genotype included 1886 DEPs corresponding to 1251 unique DEGs (19.8%). (XLSX 898 kb)
Additional file 5: Figure S1. PCA analysis of the additive model, the gestational age model and the fetal genotype model. (a) For the gestational age model, the PC1 explained 30.0% of the total variance and segregated data from fetuses according to their age. (b) For the genotype model, the
data from purebred LW and MS fetuses were clearly separated along the PC1 (24.3%) while the data from crossbred fetuses segregated on the PC3 (10.5%). (c) The gestational age segregation was also clear cut in PC1 (24.4%) of the additive model, while the purebred fetuses segregated on PC2 (16.2%). (PDF 153 kb)
Additional file 6: Table S5. Complete list of enriched GOBPs of four sub-models. The top 10 enriched biological pathways in the additive model were protein metabolism (cellular protein metabolism, protein folding and protein phosphorylation), cell cycle (mitotic cell cycle, cell division and apoptosis), blood coagulation, gene expression and cell adhesion. The top 10 enriched biological pathways of DEPs in the gestational age model were predominantly associated with protein metabolism, cell division (mRNA and RNA metabolism, apoptosis and anti-apoptosis, translation), blood coagulation, endocrine development and immunity. The top 10 enriched biological pathways in the fetal genotype model were mainly involved in cell cycle (cell cycle, cell division, negative regulation of apoptosis and chromatin modification), carbohydrate metabolism, immunity (cytokine signaling, interferon-gamma signaling), protein transport (protein transport and transmembrane transport) and blood coagulation. (XLSX 130 kb)
Additional file 7: Table S6. IPA Disease and function analysis of DEGs in MS and LW at day 110 compared to day 90. (XLS 37 kb)
Additional file 8: Figure S2. Box-plot representation of NR3C1 and TGFB2 expression in fetuses with different genotypes at 90 (d90) and 110 day (d110) of gestation. (PDF 120 kb)
Additional file 9: Table S7. Relationships between phenotypic variables and microarray data: list of genes selected within the first component of the sPLS analysis. Retained all gene-phenotypic variable pairs showed an absolute correlation score > 0.75. Related biological functions of selected genes was analyzed using IPA. (XLSX 36 kb)
Additional file 10: Figure S3. Box-plot representation of the seven tested genes in qPCR compared to their microarray expression. (PDF 359 kb)
Abbreviations
CCL2:Chemokine ligand 2, c-c motif; CTNNB1: Catenin beta 1;
DEGs: Differentially expressed genes; G6PC: Glucose 6 phosphatase catalytic subunit; GBP1: Guanylate binding protein 1; IGF1R: Insulin like growth factor 1 receptor; IUGR: Intrauterine growth restriction; KHK: Ketohexokinase; LDHA: Lactate dehydrogenase A; LW: Large White; MAP2K1: Mitogen activated protein kinase kinase 1; MS: Meishan; mTOR: mammalian target of rapamycin; NEC: Necrotizing enterocolitis; NR3C1: Nuclear receptor subfamily 3 group c member1; PCK1: Phosphoenolpyruvate carboxykinase 1; PF4: Platelet factor 4; PI3K: Phosphatidylinositol 3 kinase; PPARGC1A: Peroxisome
proliferator-activated receptor gamma, coactivator 1 alpha; SDCBP2: Syndecan binding protein 2; SMS: Spermine synthase; sPLS: spare Partial Least Squares; STAT6: Signal transducer and activator of transcription 6; SRPX2: Sushi-repeat containing protein x-linked 2; TGFB2: Transforming growth factor beta 2; THRB: Thyroid hormone receptor beta
Acknowledgements
The authors thank all the staff involved in the animal care and feeding, in the animal slaughtering and in the expert sample analysis.
Funding
This project received financial support from French National Agency of Research (PORCINET project, ANR-09-GENM005). YY is supported by the China Scholarship Council (CSC)-INRA joint PhD program. VV is a PhD fellow supported by the INRA GA and PHASE departments and the region Midi-Pyrénées. The funders had no role in the study design, data collection and analysis, decision to publish, or preparation of the manuscript.
Availability of data and materials
Microarray data are available in Gene Expression Omnibus (GEO) under the accession number GSE90980. All data generated or analyzed during this study are included in this published article (and its supplementary information files).
Authors’ contributions
LL and LC conceived and designed the study. YB supervised the performance testing, from animal production to biological sampling. NI was the project data manager. MJ and VR extracted RNA and performed control quality. YL provided the transcriptomic data set. VV, YY, MJ, SD analyzed the expression data set supervised by MSC, LL and ILHL. MCP, HQ, PM, MJ, GB and ILHL provided data on blood and intestinal parameters. YY and ILHL wrote the manuscript with help of VV and LL. LL, HQ and ILHL supervised the project. All authors read and approved the final manuscript.
Ethics approval and consent to participate
The experimental protocol was designed in compliance with legislations of the European Union (directive 86/609/EEC) and France (decree 2001–464 29/05/01) for the care and use of laboratory animals (agreement for animal housing number C-35-275-32). The technical and scientific staff obtained individual accreditation (Ref: MP/01/01/01/11) from the ethics committee (région Midi-Pyrénées–France) to experiment on living animals.
Consent for publication Not applicable.
Competing interests
The authors declare that they have no competing financial interests.
Publisher’s Note
Springer Nature remains neutral with regard to jurisdictional claims in published maps and institutional affiliations.
Author details
1
Nutrition Metabolisms and Cancer (NuMeCan), INRA, INSERM, Université de Rennes 1, UBL, Rennes, Saint-Gilles, France.2Animal Nutrition Institute,
Sichuan Agricultural University, Chengdu, Sichuan, China.3GenPhySE,
Université de Toulouse, INRA, INPT, ENVT, Castanet Tolosan, France.4PEGASE,
INRA, Agrocampus Ouest, Saint-Gilles, France.5Toxalim (Research Centre in Food Toxicology), Université de Toulouse, INRA, ENVT, INP-Purpan, UPS, Toulouse, France.6GenESI, UE1372, INRA, Surgères, France.
Received: 19 February 2017 Accepted: 1 August 2017
References
1. Liu L, Hill K, Oza S, Hogan D, Chu Y, Cousens S, Mathers C, Stanton C, Lawn J, Robert BE. Levels and Causes of Mortality under Age Five Years. In: Black RE, Laxminarayan R, Temmerman M, Walker N, editors. Disease control priorities. Washington DC: The World Bank; 2015. p. 71–84.
2. Lawn JE, Cousens S, Zupan J. 4 million neonatal deaths: When? Where? Why? Lancet. 2005;365(9462):891–900.
3. Wilcock A, Begley P, Stevens A, Whatmore A, Victor S. The metabolomics of necrotising enterocolitis in preterm babies: an exploratory study. J Matern Fetal Neonatal Med. 2015;29(5):758–62.
4. Decaro MH, Vain NE. Hyperglycaemia in preterm neonates: What to know, what to do. Early Hum Dev. 2011;87(Suppl 1):19–22.
5. Sadeghi K, Berger A, Langgartner M, Prusa A-R, Hayde M, Herkner K, Pollak A, Spittler A, Förster-Waldl E. Immaturity of infection control in preterm and term newborns is associated with impaired toll-like receptor signaling. J Infect Dis. 2007;195(2):296–302.
6. Wisgrill L, Groschopf A, Herndl E, Sadeghi K, Spittler A, Berger A, Förster-Waldl E. Reduced TNF-α response in preterm neonates is associated with impaired nonclassic monocyte function. J Leukoc Biol. 2016;100(3):607–12.
7. Forster-Waldl E, Sadeghi K, Tamandl D, Gerhold B, Hallwirth U, Rohrmeister K, Hayde M, Prusa AR, Herkner K, Boltz-Nitulescu G, et al. Monocyte toll-like receptor 4 expression and LPS-induced cytokine production increase during gestational aging. Pediatr Res. 2005;58(1):121–4.
8. Sangild PT, Thymann T, Schmidt M, Stoll B, Burrin DG, Buddington RK. Invited review: the preterm pig as a model in pediatric gastroenterology. J Anim Sci. 2013;91(10):4713–29.
9. Nanthakumar NN, Young C, Ko JS, Meng D, Chen J, Buie T, Walker WA. Glucocorticoid responsiveness in developing human intestine: possible role
in prevention of necrotizing enterocolitis. Am J Physiol Gastrointest Liver Physiol. 2004;288(1):G85–92.
10. Torrazza RM, Li N, Neu J. Decoding the enigma of necrotizing enterocolitis in premature infants. Pathophysiology. 2014;21(1):21–7.
11. Neu J. Necrotizing enterocolitis: the mystery goes on. Neonatology. 2014; 106(4):289–95.
12. Garite TJ, Clark R, Thorp JA. Intrauterine growth restriction increases morbidity and mortality among premature neonates. Am J Obstet Gynecol. 2004;191(2):481–7.
13. Morgan J, Young L, McGuire W. Slow advancement of enteral feed volumes to prevent necrotising enterocolitis in very low birth weight infants. Cochrane Database Syst Rev. 2013; doi:10.1002/14651858. CD001241.
14. Wang X, Lin G, Liu C, Feng C, Zhou H, Wang T, Li D, Wu G, Wang J. Temporal proteomic analysis reveals defects in small-intestinal development of porcine fetuses with intrauterine growth restriction. J Nutr Biochem. 2014;25(7):785–95.
15. Dietz WH. Nutritional Adaptation of the Gastrointestinal Tract of the Newborn. In: Kretchmer N, Minkowski A, editors. Nestle Nutrition Workshop Series, Vol. 3. New York: Raven Press; 1984.
16. Montgomery RK, Mulberg AE, Grand RJ. Development of the human gastrointestinal tract: Twenty years of progress. Gastroenterology. 1999; 116(3):702–31.
17. Maheshwari A. Immunologic and hematological abnormalities in necrotizing enterocolitis. Clin Perinatol. 2015;42(3):567–85.
18. Young CM, Kingma SDK, Neu J. Ischemia-reperfusion and neonatal intestinal injury. J Pediatr. 2011;158(Suppl 2):25–8.
19. Sangild PT, Schmidt M, Elnif J, Bjornvad CR, Westrom BR, Buddington RK. Prenatal development of gastrointestinal function in the pig and the effects of fetal esophageal obstruction. Pediatr Res. 2002;52(3): 416–24.
20. Sangild PT, Fowden AL, Trahair JF. How does the foetal gastrointestinal tract develop in preparation for enteral nutrition after birth? Livest Prod Sci. 2000; 66(2):141–50.
21. Oosterloo BC, Premkumar M, Stoll B, Olutoye O, Thymann T, Sangild PT, Burrin DG. Dual purpose use of preterm piglets as a model of pediatric GI disease. Vet Immunol Immunopathol. 2014;159(3–4):156–65.
22. Roura E, Koopmans SJ, Lallès JP, Le Huerou-Luron I, de Jager N, Schuurman T, Val-Laillet D. Critical review evaluating the pig as a model for human nutritional physiology. Nutr Res Rev. 2016;29(1):60–90.
23. Canario L, Cantoni E, Le Bihan E, Caritez JC, Billon Y, Bidanel JP, Foulley JL. Between-breed variability of stillbirth and its relationship with sow and piglet characteristics. J Anim Sci. 2006;84(12):3185–96.
24. Canario L, Père MC, Tribout T, Thomas F, David C, Gogué J, Herpin P, Bidanel JP, Le Dividich J. Estimation of genetic trends from 1977 to 1998 of body composition and physiological state of Large White pigs at birth. Animal. 2007;1(10):1409–13.
25. Voillet V, Sancristobal M, Lippi Y, Martin PG, Iannuccelli N, Lascor C, Vignoles F, Billon Y, Canario L, Liaubet L. Muscle transcriptomic investigation of late fetal development identifies candidate genes for piglet maturity. BMC Genomics. 2014;15:797.
26. Li R, Sun Q, Jia Y, Cong R, Ni Y, Yang X, Jiang Z, Zhao R. Coordinated miRNA/mRNA expression profiles for understanding breed-specific metabolic characters of liver between Erhualian and Large White pigs. PLoS One. 2012;7(6):e38716.
27. Père MC. Materno-foetal exchanges and utilisation of nutrients by the foetus: comparison between species. Reprod Nutr Dev. 2003;43:1–15. 28. Marion J, Petersen YM, Romé V, Thomas F, Sangild PT, Dividich JL,
Huërou-Luron IL. Early weaning stimulates intestinal brush border enzyme activities in piglets, mainly at the posttranscriptional level. J Pediatr Gastroenterol Nutr. 2005;41(4):401–10.
29. Lowry OH, Rosebrough NJ, Farr AL, Randall RJ. Protein measurement with the Folin phenol reagent. J Biol Chem. 1951;193(1):265–75.
30. D’Inca R, Kloareg M, Gras-Le Guen C, Le Huërou-Luron I. Intrauterine growth restriction modifies the developmental pattern of intestinal structure, transcriptomic profile, and bacterial colonization in neonatal pigs. J Nutr. 2010;140(5):925–31.
31. Vandesompele J, De Preter K, Pattyn F, Poppe B, Van Roy N, De Paepe A, Speleman F. Accurate normalization of real-time quantitative RT-PCR data by geometric averaging of multiple internal control genes. Genome Biol. 2002;3(7):research0034.