Publisher’s version / Version de l'éditeur:
Vous avez des questions? Nous pouvons vous aider. Pour communiquer directement avec un auteur, consultez la première page de la revue dans laquelle son article a été publié afin de trouver ses coordonnées. Si vous n’arrivez pas à les repérer, communiquez avec nous à PublicationsArchive-ArchivesPublications@nrc-cnrc.gc.ca.
Questions? Contact the NRC Publications Archive team at
PublicationsArchive-ArchivesPublications@nrc-cnrc.gc.ca. If you wish to email the authors directly, please see the first page of the publication for their contact information.
https://publications-cnrc.canada.ca/fra/droits
L’accès à ce site Web et l’utilisation de son contenu sont assujettis aux conditions présentées dans le site LISEZ CES CONDITIONS ATTENTIVEMENT AVANT D’UTILISER CE SITE WEB.
Internal Report (National Research Council of Canada. Institute for Research in Construction), 1989-10
READ THESE TERMS AND CONDITIONS CAREFULLY BEFORE USING THIS WEBSITE.
https://nrc-publications.canada.ca/eng/copyright
NRC Publications Archive Record / Notice des Archives des publications du CNRC : https://nrc-publications.canada.ca/eng/view/object/?id=3f23fccb-afe7-4bf3-a5ff-a823d03d540f https://publications-cnrc.canada.ca/fra/voir/objet/?id=3f23fccb-afe7-4bf3-a5ff-a823d03d540f
NRC Publications Archive
Archives des publications du CNRC
For the publisher’s version, please access the DOI link below./ Pour consulter la version de l’éditeur, utilisez le lien DOI ci-dessous.
https://doi.org/10.4224/20358595
Access and use of this website and the material on it are subject to the Terms and Conditions set forth at
Evaluation of the Fire Resistance of Protected Steel Columns
'Ref . I
Ser I 1 Natlonal Research Conseil national
Council Canada de recherches Canada
lnstitut de recherche en construction
Evaluatjon of the Fire Resistance
of Protected Steel Columns
T.T. Lie and B.A. Macaulay
Internal Report No.
583
Date of issue:
October 1989ANALYZED
This is an internal report of the Institute for Research in Construction. Although not intended for general distribution, it may be cited as a reference in other publications.
1. INTRODUCTION
During a fire, building structural members may be exposed to heating at very high temperatures, and as a consequence their strength may decrease substantially. To prevent loss of strength that could result in failure, steel membm are usually protected with an insulating material.
There is a critical temperature at which structural steel loses so much strength that it can no longer support the load. The critical temperature depends on many factors; one of the most important is the load to which the member is subjected. This critical temperature increases with decreasing load and, therefore, the fire resistance of the member, which can be defined as the time it takes to reach the critical steel temperature, also increases if the load is decreased.
The objective of this study is to determine the critical temperature of wide flange steel columns and their fire resistance as a function of load. For this purpose the results of three fire tests carried out on loaded columns and calculated fm resistances [1,2]
2
2. TEST SPECIMENS
The specimens consisted of three protected steel columns as specified in Table 1. The columns were. 3810 mm in total length including 533 x 533 x 25 mm endplates (Fig. 1). The cross-sectional dimensions of the columns and insulation are shown in Fig. 2 and are listed in Table 2.
The temperam of the steel column was measured with 0.91 mm thick chromel-alumel thermocouples, which
were.
peened into the steel at four levels. The location of the3. TEST APPARATUS
The tests were carried out by exposing the columns to heat in a furnace specially built for testing loaded columns and walls. The test furnace was designed to produce the conditions to which a member might be exposed during a fire, i.e:tempe&tures, structural loads, and heat transfer. It consists of a steel framework supported by four steel columns, with the furnace chamber inside the framework (Fie. 4). The
characteristics and instrumentation of the furnace are described
h
& d l in Ref. [4].Only a brief description of the furnace and its main components is given here.
3.1 Loading Device
A hydraulic jack with capacity of 1000 t acted along the axis of the column to produce a load. The jack was located at the bottom of the furnace chamber. The plate on top of the jack was used as a platform to which the column was attached.
3.2 Furnace Chamber
The furnace chamber has a floor area of 2642 x 2642 mm and is 3048 mm high. The interior faces of the chamber are lined with insulating materials that efficiently transfer heat to the specimen. There are 32 propane gas burners in the furnace - chamber, arranged in eight columns containing four burners each. The total capacity of the burners is 4700 kW (16 million Btu/h). Each burner can be adjusted individually, which ensures a high degree of temperature uniformity in the furnace chamber. The pressure in the furnace chamber is adjustable and was set somewhat lower than atmospheric pressure.
3.3 Instrumentation
The furnace temperatures were measured with the aid of eight chromel-alumel thermocouples. Each thermocouple was located 305 mm from the test specimen, at various heights. Two thermocouples were placed opposite each other at intervals of 610 mm along the height of the furnace chamber. The location of their junctions and their numbe&g are &own in Fig. 5. Thermocouples 4 and 6 were located at a height of 610 mm from the floor. Thermocou~les 2 and 8 at 1220
mm.
Thermocou~les 3 and5 at 1830 mm and Thermckouples 1 &d 7 at 2440 mm. The temperatures measured by the thermocouples are averaged automatically and the average temperature was used as the criterion for controlling the furnace temperature.
The loads were controlled and measured using pressure transducers. The accuracy of contlollin~ and measurine loads is a~uroximatelv
. .
20 kN at lower load levels and relatively b e k r at higher loids.The axial deformation of the test specimen was determined by measuring the displacement of the jack that supports the column. The displacement was measured using transducers with an accuracy of 0.002
rnrn.
4. TEST CONDITIONS AND PROCEDURES
The column end plates were bolted to the load head at the top and the hydraulic jack at the bottom. End conditions were fixed-futed for all three tests.
4.1 Loading
Prior to commencing the
f
m
tests the columns were tested under concentric loads applied in stages, the last stage occuring at least 45 minutes before testing. Column No. 1 was subjected to a load of 1760 kN and Columns Nos. 2 and 3 to a load of 1424 kN.4.2 Fire Exposure
The columns were exposed to heating such that the average temperature in the furnace closely followed the ASTM-El19 [5] or ULC-S101 [6] standard temperature-time c w e . This c w e can be approximated by the following equation:
Tf = 20
+
750 [ 1 - exp ( -3.795534~.)]+
170.41dt where : Tf = temperature in OCz = nme in hours
4.3 Recording of Results
Temperature readings were taken at each thennocouple location at two minute intervals. Axial strain was also measured.
The columns were considered to have failed, and the tests were terminated, when the hydraulic jack which has a maximum speed of 76 mmlmin could no longer maintain the load.
5. CALCULATION METHOD
The calculation of the fire resistance of a steel column is a two step process. First, the temperatures reached by the column at any time during the fire must be determined, either by test, by semi-empirical prediction formulas [7] or by thermal analysis [2].
Because the thermal properties of the material protecting the steel were not known, the steel temperatures during exposure to fire were determined by measurement during tests.
The next step in the calculation of fire resistance is determining the structural response of the column. The behavior of the column can be assessed bv analvsis of stresses and strains in the loaded column, and determining the strength'i.e. tlie
maximum load that the column can cany during the exposure to the fue. For any given load there is a critical steel temperature at which strength becomes insufficient to carry the load. By calculating the time it rakes to reach the critical temperature the fue resistance of the column can be derived as a function of the load.
5.1 Critical Steel Temperature
In typical structural design for steel members, a factor of safety on strength and load is incorporated to take into account variability of material performance and the load to which the member may be subjected. If a steel member is heated in fue, however, it may reach the temperaGe at which its strength or stiffness decreases to the point that this safety factor is reduced to zero and the member fails. This temDerature, which is a function bf the type of member, its end support conditions and the foad applied, is the actual critical temperature of the member. This critical temperature, which for the columns considered in this study may be defmed as the average steel temperature at the midheight section at the point of failure, can be derived by analysis of the behaviour of the member at elevated temperatures. For this purpose, the relevant high temperature properties of the steel need to be known.
5.2 Steel Properties
When exposed to fue, steel gradually loses strength and stiffness. These properties, characterised by the yield strength and modulus of elasticity of the steel, decrease as the temperature increases. Data concerning the dependence of these ~rouerties on temmranue have been remrted bv several authors Ref. 121. In this
'study, material prbperties will be used that are sbmewhat conservative'but are reasonably representative of those reported in most of the literature. The steel properties us& in this study are given in Appendix A in this paper.
5.3 Calculation of Strength During Fire
The strength of the column during exposure to fire can be calculated by a method based on a load deflection analysis described in Reference
[a].
In this method, the columns. which are fwed at the ends during the tests, are idealised as pin-ended columns'of length KL (Fig. 6). In a previ&s study [9] it was estimated that for columns tested fiwed at the ends, the effective lengthKL
is about 2000mm.The load on the column is intended to be concentric. Due to imperfections of the column and the loading device, a small eccentricity exists. Therefore in the calculations a very small initial load eccentricity will be assumed. After runs of the computer program showed that for small eccentricities up to about 10mm.
the influence of eccentricity on fire resistance is very small , a value of 0.2mm reflecting a nearly concentric load, was selected for the initial eccentricity.
The curvature of the column is assumed to vary from pin-end to mid-height according to a straight line relation, as illustrated in Fig. 6. For such a relation the deflection at mid-height y, in terms of the curvature of the column at this height, can be given by
For any given curvature, and thus for any given deflection at mid-height, the axial strain is varied until the internal moment at the mid-section is in equilibrium with the applied moment given by the product
load x (deflection
+
eccentricity)In this way, a load deflection curve can be calculated for specific times during the exDosure to fire. From these curves the strength of the column, i.e. the maximum load thit the column can carrv. can be determined for each time. In the calculation of
column strength, the fodowing assumptions were made:
(1) The properties of the steel are those described in Appendix A. (2) Plane sections remain plane.
(3) The insulation does not conmbute to carrying the load.
Based on these assumptions, the change of column strength during exposure to f i e was calculated. In the calculation method, which is described in Ref. [2], the section is divided in a number of elements. For each element the strains, stresses and the load carried by the element are calculated. The load that the column can carry and the moments in the section were obtained by adding the loads carried by each element and the moments contributed by them.
The equations used in the calculation of the strength of the column during exposure to fire are given below. The strain in an element of the steel can be given as the sum of the thermal expansion of the steel (&T)~
,
the axial strain of the column & and the suaindue to bending of the column zdp, where zs is the horizontal distance of the steel element to the vertical plane through the x-axis of the column section, and p is the radius of curvature. For the steel at the right of the x-axis the strain (&)R is given by
For the steel elements at the left of the x-axis the strain (&s)L is given by
The stresses in the elements of the network are calculated using the stress-strain relations for steel given by the Eqs. (4)-(10) in Appendix A. These relations are
With the aid of Eqs. (1)-(12), the saesses at mid-section in the steel elements can be
calculated for any value of the axial strain E and curvature p. From these stresses, the load that each element cames and its contribution to the internal moment at mid-section can be derived. By adding the loads and moments, the load that the column canies and the total internal moment at mid-section can be calculated.
The fire resistance of the column is derived by calculating the strength i.e. the maximum load that the column can cany at several consecutive times during the exposure to fire. This strength reduces gradually with time. At a certain point the strength becomes so low that it is no longer sufficient to support the load, and the column fails. The time to reach this failure point is the fire resistance of the column.
6 .
RESULTS
6.1 Measured Results
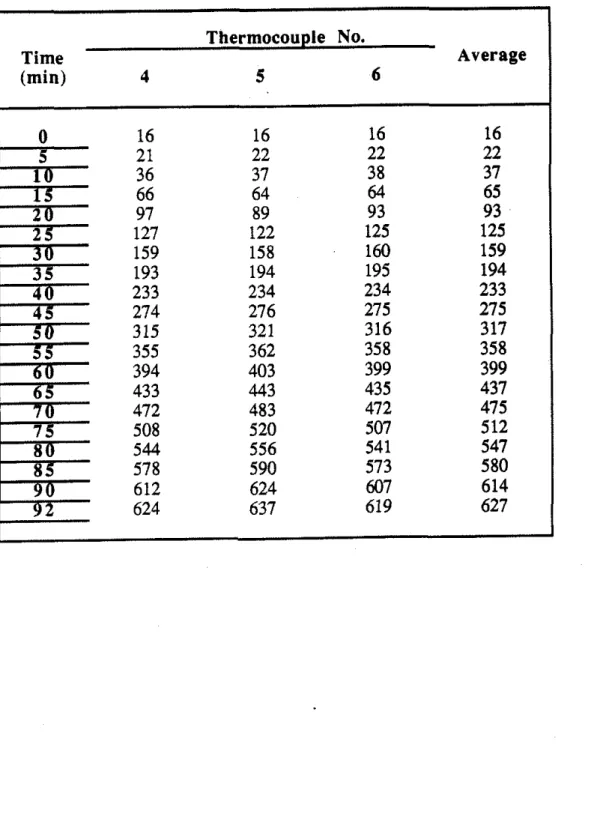
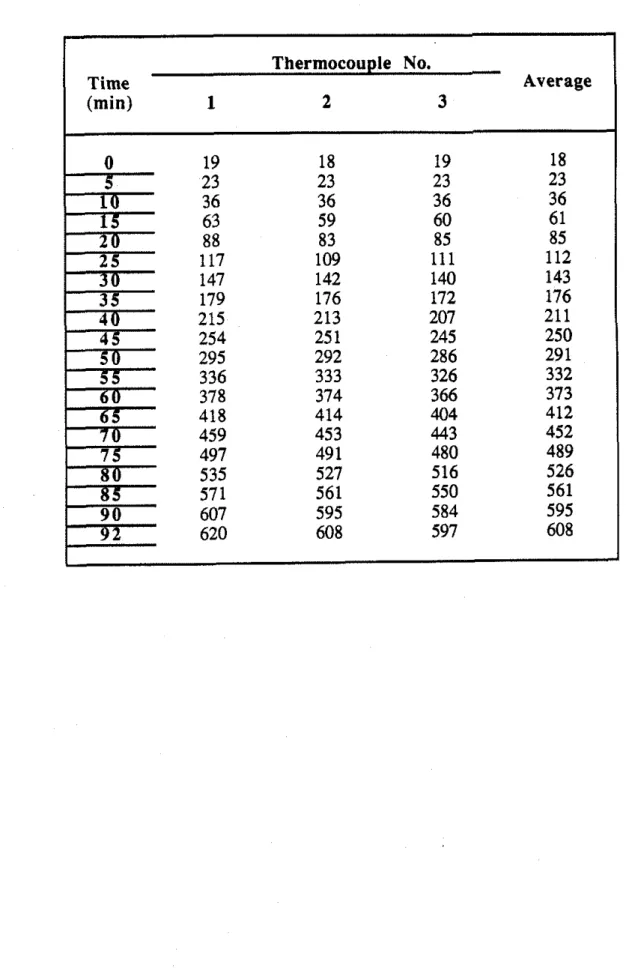
The temperatures measured during the fire test at four levels in Column No. 1 are listed in Tables 3-6, those measured in Column No. 2 in Tables 9-12, and those measured in Column No. 3 in Tables 15-18.
In Tables 7, 13 and 19, the average steel temperature at midheight of the columns, the average of
all
temperatures in each column, the average furnace temperatures and the standard furnace temperaturesare
given. The furnace temperatures during the three tests are also plotted in Figs 8-10.The average steel temperature at midheight of each column was obtained by averaeine the temueratures measured at Levels
- "
2 and 3. These midheight steeltemperatures are ihown for the three columns in Figs 11-13. They were used as input data in the calculation of the fire resistance of the columns.
In the Tables 8,14 and 20, the axial deformations of the three test columns, measured during the tests, are given. The test columns after the tests are shown in Figs. 14-16.
6.2 Calculated Results
In Figs 11-13 curves are shown, consisting of a number of straight lines, that are representative of the average temperatures at midheight of the columns during the tests. The use of these curves as input data
w
i
l
l
facilitate the calculation of the fire resistance of the columns. The expressions describing the temperature curves are given in Appendix B by the Eqs. (13)-(21).Using the mathematical model, described earlier in this paper, calculations were made of the axial deformations of the columns during the exposure to fire. Calculations were also made of the critical temperature and the fue resistance of the columns as a function of the load.
In Figs. 17-19 calculated axial deformations are compared with measured axial deformations. It can be seen that calculated deformations are somewhat higher than those measured. The differences, which near the failure points are in the order of 5 mm
may be regarded as small, if it is taken into account that these are the differences between calculated and measured deformations for a column length of about 3800 mm. It is likely that the main cause of the differences is creep of steel, which becomes more pronounced at higher temperatures. A part of the creep, however, is implicitly taken into account in the mechanical properties of steel used.
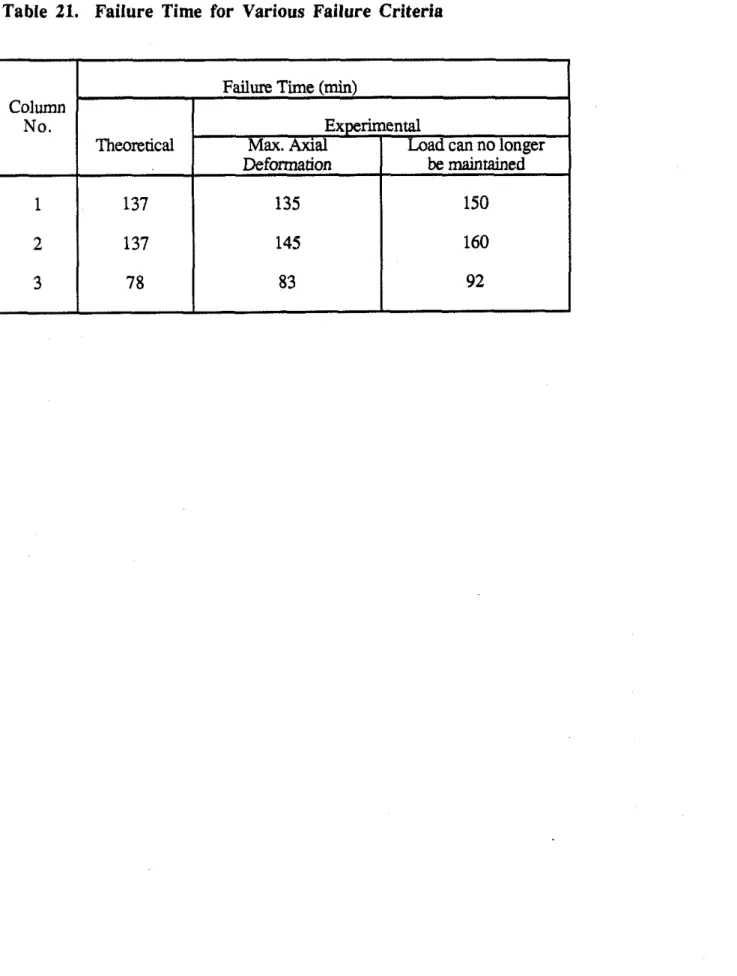
In Table 21, the calculated and measured failure times of the columns are given for various failure criteria At present, there are no generally accepted failure criteria for columns. It has been customary to consider attainment of a specific lateral deflection of the column during a
f i
test as failure. This deflection varies from country to country but lies in the range of 50-150 mm, corresponding to an axial deformation of about 2-At the Institute for Research in Construction, the column is considered to have failed when the hydraulic loading system can no longer apply the contemplated load. This criterion, although well defined because of the fixed maximum ram speed, is dependent on the capabilities of the loading system. Since the maximum ram speed is high (76 mm/min) the loading system will be able to apply the load until very large deflections occur, as can be seen in Figs. 17-19. Therefore the use of this criterion will result in relatively favourable failure times. According to the results given in Table 21, these failure times are about 10-15 minutes greater than the times at which the column becomes unstable i.e. reaches the maximum expansion and begins to deflect.
In this study the failure point has been defmed as the point at which the column reaches the maximum expansion. For steel columns it appears to be a bener criterion than the criterion of maintaining the load by the ram. If this failure criterion is used, calculated failure times, which are defined as the times at which the column can no longer support the applied load, are in good agreement with the measured failure times.
Using the mathematical model the fire resistances and critical temperatures of the tested columns were calculated as a function of the load. The calculated results are
given in Table 22 and are ploned in Figs. 20 and 21. It can be seen that the fire resistance and critical steel temperature are considerably dependent on the load. In the practical region, namely, for loads below about 2200 kN for Column No. 1, and loads below about 1700 kN for the Columns Nos. 2 and 3, the fire resistance as well as the critical steel temperature vary with the load approximately linearly. This will facilitate extension of fire resistance and critical temperature from one load to other loads.
Because the relation between fire resistance, critical temperature and load is known, the fire resistance can be derived for any given load and insulation by determining on unloaded columns the time it takes to reach the critical steel temperature.
10
CONCLUSION
The mathematical model employed in this study is capable of predicting the critical steel temperature and tire. resistance of protected steel columns with
an
accuracy that is adequate for practical purposes. The maximum difference between calculated and measured fue resistances is about six percent when the maximum expansion of the columns is taken as criterion of failure.If the thermal properties of the insulation are not known the fue resistance of the column can be derived by calculating for a given load the critical steel temperature of the column, using the mathematical model, and determining by testing of an unloaded column the time it takes for the steel to reach the critical steel temperature. If the thermal properties of the protecting material are known, the temperature course of the steel can be calculated using existing validated mathematical models for the
determination of the steel temperature of fire exposed protected steel columns, and the
REFERENCES
1. Lie, T.T. and Hamathy, T.Z., A Numerical Procedure tocalculate the Temperature of Protected Steel Columns Exposed to Fire, Fire Study No. 28, Division of Building Research, National Research Council of Canada, NRCC 12535, 1972.
2. Lie, T.T. and Almand, K.H.,A Method to Predict the Fire Resistance of Steel Building Columns, To be published.
3. Handbook of Steel Construction, Canadian Institute of Steel Construction, Willowdale, 1976.
4. Lie, T.T., New Facility to Determine Fire Resistance of Columns, Canadian Journal of Civil Engineering, Vol7, 1980.
5. Standard Methods of Fire Tests of Building Construction and Materials, ASTM E119- 83, American Society for Testing and Materials.
6 . Standard Methods of Fire Endurance Tests of Building Construction and Materials CAN4-S101-M82, Undenwiters Laboratories of Canada.
7 . European Recommendations for the Fire Safety of Steel Structures, Calculation of the
Fire Resistance of h a d Bearing Elements and Structural Assemblies Exposed to the Standard Fire, Elsevier, Amsterdam-Oxford-New York, 1983.
8. Allen, D.E. and T.T. Lie, Further Studies of the Fire Resistance of Reinforced Concrete Columns, National Research Council of Canada, Division of Building Research, NRCC 14047,1974.
9. Centre Technique Industriel de la Consauction Metallique (CTICM), Methode de Prkvision par la Calcul du Comportement au Feu des Structures en Acier, Document Technique Unifik (DTU), Revue Construction Metallique, No. 3,1982.
APPENDIX A
The strength and modulus of elasticity of steel at elevated temperatures are based on the formulas for these properties given in Ref.[9]. The stress-strain relations (Eqs. (4)-(10)) were derived using these formulas for stresses and strains up to the 0.002 offset yield strength. For greater stresses it was conservatively assumed, based on information in the literature,that the stress-strain relations are straight lines through the 0.002 offset points and the points defined by a 0.01 offset and a stess equal to 1.1 of the yield strength. The stress-strain relations for various temperatures are illustrated in Fig.5.
-n relations for es 5 e P f~ =
E~
es for es>
e P 2 fT = 12.5 f Es+
0.975 fyT-
12.5 (fyT) /ETYT
where the proportional limit
0.975fvt
-
1 2 . 5 ( f V d 2 ~ ~the yield strength
for 0 < T 1 600°C
and the modulus of elasticity for 0 < T 2 600°C
for 600 < T < 1000OC
In the calculations the following values for f and Eo have been used:
YO f = 300 MPa
E?"
= 200000 m a 0 Coefficient of th for T < 1000OC as = (0.004 T+
12) x 10- 6 for T 2 1000OC as = 16 x 10- 6APPENDM
B
Eauations for the Average Temverature of the Columns at Midheight durine Fire
Tests (for use as Input Data)
Column No. 1 for 0 5 2 5 16.7 Tas = 5.89
+
0.57 7 for 16.7 < 2 5 59.27 Tas = -24.21+
2.41 2 for 2 > 59.27 Tas = -186.49+
5.15 2 Column No. 2 for 0 5 9.85 Tas = 16.48+
0.55 2 for 9.85 < T 5 29.63 Tas =-15.14+
3.76 2 for 29.63 c 2 5 49.17 Tas = 77.85+
0.62 2 for 2 >49.17 Tas = -1 17.65 +4.60 2A4 Column No. 3 for 0
<
T 1 19.97 Tas = 5.94+
3.66 2 for2 ~ 1 9 . 9 7
Tas = -68.69+
7.39 TNOMENCLATURE
Notations
e eccentricity of load (m) E modulus of elasticity f~
stress of steel at temperature T (MPa)
:YT yield strength of steel at temperature yield strength of steel at room temperature ( m a ) T ( m a )
It0
effective length factorL unsupported length of column (m) T temperature ("C)
Y lateral deflection of column at mid-height (m)
z coordinate
Greek
1-a
coefficient of thefinal expansion 'C1E strain (m m )
R radius of curvature (m) time (min)
curvature of column at mid-height (m-')
average
at room temperature of the fze
pertaining to the proportional stress-strain relation of steel
INDEX OF TABLES AND FIGURES Table 1 Table 2 Table 3 Table 4 Table 5 Table 6 Table 7 Table 8 Table 9 Table 10 Table 11 Table - - - - 12 Table 13 Table 14 Table 15 Table 16 Table 17 Table 18 Table 19 --. -. Table 20 Table 21 Table 22 Figure 1 Figure 2 Figure 3 Figure 4 Figure 5 Figure 6 Figure 7 Figure 8 Figure 9 Figure 10 Figure 11 Figure 12 Figure 13 Figure 14 Figure 15 Figure 16 Figure 17 Figure 18 Figure 19 Figure 20 Figure 21
Specifics of Test Specimens
Dimensions of Column and Insulation
Temperature Measured in Column No. 1, Level 1 Temperature Measured in Column No. 1, Level 2
Temperature Measured in Column No. 1, Level 3 Temperature Measured in Column No. 1, Level 4
Average Column and Furnace Temperatures (Column No. 1) Measured Axial Deformation of Column No. 1
Temperature Measured in Column No. 2, Level 1 Temperature Measured in Column No. 2, Level 2 Temperature Measured in Column No. 2, Level 3 Temperature Measured in Column No. 2, Level 4
Average Column and Furnace Temperatures (Column No. 2) Measured Axial Deformation of Column No. 2
Temperature Measured in Column No. 3, Level 1 Temperature Measured in Column No. 3, Level 2 Temperature Measured in Column No. 3, Level 3 Temperature Measured in Column No. 3, Level 4
Average Column and Furnace Temperatures (Column No. 3) Measured Axial Deformation of Column No. 3
Failure T i e for Various Failure Criteria
F i
Resistance and Critical Temperature of Test Column as a Function of LoadElevation and Cross Section of Test Columns Cross Section of Columns and Insulation Location of Thermocouples
Location and Numbers of Thermocouples in Column Furnace Chamber
Test Furnace
Load-Deflection Analysis
Stress-Strain Relations for Structural Steel
Furnace Temperature during Test of Column No. 1
Furnace Temperature during Test of Column No. 2 Furnace Temperature during Test of Column No. 3 Average Steel Temperature at Midheight of Column No. 1 Average Steel Temperature at Midheight of Column No. 2 Average Steel Temperature at Midheight of Column No. 3 Axial Deformation of Column No. 1 as a Function of Time Axial Deformatioo of Column No. 2 as a Function of Time Axial Deformation of Column No. 3 as a Function of Time Fire Resistance of Test Columns as a Function of Load
Critical Steel Temperature of the Test Columns as a Function of Load
Column 1 after Test Column 2 after Test Column 3 after Test
.-
in-
V)=,2s
E 5 2 E.-
3-
s i
" - E 5 2 EZ B W
H in'3
:.g
.-
g E
-
Eg
w-
5
P
2
az z
UE
z
4
,
.
0) u!z
F- F- q r? d2
2
-F-
3
E 2 N N3
3
N C) - m mTable 3. Temperature (OC) Measured in Column No. 1, Level 1 (457mm)
Thermocouple No.
Time Average
Table 4. Temperature (OC) Measured in Column No. 1, Level 2 (1422mm) Thermocouple No. 1 0 5 346 317 358 340 1 1 0 373 343 385 367 115 398 368 410 392 1 2 0 422 393 435 417 125 445 417 457 440 1 3 0 469 439 480 462 1 3 5 49 1 459 500 483 1 4 0 5 13 480 521 505 1 4 5 534 502 54 1 526 1 5 0 553 527 560 547
Table 5. Temperature (OC) Measured in Column No. 1,
Level 3 (2387mm)
Thermocouple NO.
Time Average
Table 6. Temperature (OC) Measured in Column No. 1,
Table 7. Average Column and Furnace Temperatures (OC) in Column No. 1 Time (min) 0 5 1 0 1 5 2 0 2 5 3 0 3 5 4 0 4 5 5 0 5 5 6 0 6 5 7 0 7 5 8 0 8 5 9 0 9 5 1 0 0 105 1 1 0 115 1 2 0 125 130 135 1 4 0 145 1 5 0
Average Average Average Standard
Mid Total Furnace Furnace
Column Column 7 8 45 20 8 8 593 538 10 10 673 704 16 17 719 760 24 25 770 795 34 35 811 82 1 46 46 832 843 58 58 858 862 7 1 70 87 8 87 8 83 82 893 892 96 95 905 905 108 107 918 916 123 121 95 1 927 143 140 954 937 168 164 960 946 194 189 97 1 955 222 216 980 963 250 243 990 97 1 27 8 27 1 998 97 8 305 297 1004 985 332 324 1013 99 1 359 350 1031 996 386 377 1026 1001 412 403 1040 1006 437 428 1049 1010 46 1 452 1053 485 476 1059 1017 507 498 1065 529 520 1069 1024 550 541 1071 579 565 , 1073 1031
Table 8. Measured Axial Deformation of Column No. 1 Time (min) Deformation -2.80 -2.80 -2.80 -2.80 -2.63 -2.28
-
1.89-
1.45 -0.97 -0.50i
Table 9. Temperature (OC) Measured in Column No. 2, Level 1 (457mm) Thermocouple No. Time Average (min) 1 0 11 1 2 0 16 23 15 15 5 16 23 16 16 1 0 24 19 19 22 1 5 45 42 34 39 2 0 66 62 57 62 2 5 87 86 78 84 3 0 101 102 97 100 3 5 101 101 101 101 4 0 107 101 101 103 4 5 122 102 105 109 5 0 141 107 119 122 5 5 162 120 138 140 6 0 185 142 160 162 6 5 208 166 183 185 7 0 232 191 208 210 7 5 257 216 233 235 8 0 283 243 259 262 8 5 308 269 285 287 9 0 334 296 31 1 314 9 5 359 322 337 339 1 0 0 385 347 363 365 1 0 5 409 372 388 390 1 1 0 434 397 413 414 11s 457 42 1 437 438 1 2 0 480 444 460 461 1 2 5 501 466 482 483 1 3 0 522 488 504 505 1 3 5 543 509 524 525 1 4 0 565 533 546 548 1 4 5 585 557 567 570 1 5 0 604 580 587 590 1 5 5 619 599 603 607 1 6 0
*
620 647 634Table 10. Temperature (OC) Measured in Column No. 2, Level 2 (1422mm)
Table 11. Temperature (OC) Measured in Column NO. 2, Level 3 (2387mm) Thermocouple NO. 145 548 509 542 533 1 3 0 569 530 562 554 155 588 551 580 573 1 6 0 637 572 596 602
Table 12. Temperature (OC) Measured in Column No. 2,
Level 4 (335Zmm)
Table 13. Average Column and Furnace Temperatures (OC) in Column No. 2 Time (min) 0 5 1 0 15 2 0 2 5 3 0 3 5 4 0 4 5 5 0 5 5 6 0 6 5 7 0 7 5 8 0 85 9 0 9 5 1 0 0 105 1 1 0 115 1 2 0 125 1 3 0 135 1 4 0 145 150 155 1 6 0
-
Average Average Average Standard
Mid Total Furnace Furnace
Column Column 17 17 45 20 18 18 576 538 23 23 667 704 40 39 719 760 60 59 77 1 795 81 80 807 821 97 96 83 1 843 100 101 870 862 102 102 877 878 107 106 894 892 117 117 909 905 133 133 929 916 153 153 935 927 174 174 949 937 196 197 964 946 220 22 1 97 3 955 244 245 976 963 269 270 99 1 97 1 294 295 998 978 319 320 1006 985 344 345 1015 99 1 369 369 1023 996 393 393 1029 1001 417 417 1036 1006 440 440 1041 1010 463 462 105 1 485 484 1059 1017 506 505 1110 527 526 1059 1024 548 547 1040 569 568 1042 1031 588 586 1076 618 613 1103 1038
Table 14. Measured Axial Deformation of Column No. 2
Time Deformation
(min)
I Table 15. Temperature (OC) Measured in Column NO. 3, Level 1 (457mm) Thermocouple No. Time (min) 1 0 1 1 12 Average 0 10 10 10 10 5 13 14 13 13 10 26 28 25 26 15 47 49 45 47 2 0 76 74 72 74 2 5 107 94 98 99 3 0 138 124 128 130 35 167 158 159 161 4 0 201 195 194 196 4 5 237 232 23 1 233 5 0 278 273 27 1 274 5 5 318 315 311 314 6 0 355 357 35 1 354 6 5 391 396 390 392 7 0 426 434 426 429 7 5 460 469 460 463 8 0 495 503 494 497 8 5 527 535 525 529 9 0 560 566 557 561 92 572 578 569 573
Table 16. Temperature (OC) Measured in Column No. 3, Level 2 (1422mm)
Thermocouple No.
Table 17. Temperature (OC) Measured in Column No. 3, Level 3 (2387mm) Thermocouple No. Time Average (min) 4 5 6
0
16 16 16 16 5 21 22 22 22 1 0 36 37 38 37 1 5 66 64 64 65 2 0 97 89 93 93 2 5 127 122 125 125 3 0 159 158 160 159 3 5 193 194 195 194 4 0 233 234 234 233 4 5 274 276 275 275 5 0 315 32 1 316 317 5 5 355 362 358 358 6 0 394 403 399 399 6 3 433 443 435 437 7 0 472 483 472 475 7 5 508 520 507 512 8 0 544 556 541 547 8 5 578 590 573 5 80 9 0 612 624 607 614 9 2 624 637 619 627Table 18. Temperature (OC) Measured in Column No.3, Level 4 (3352mm)
Thermocouple No.
I
Table 19. Average Column and Furnace Temperatures (OC) in Column No. 3 Time (min) 0 5 1 0 15 2 0 2 5 3 0 3 5 4 0 4 5 5 0 5 5 6 0 6 5 7 0 7 5 8 0 8 5 9 0 9 2Average Average Average Standard
Mid Column Total Column Furnace Furnace
15 14 46 20 19 19 586 538 33 32 675 704 59 56 726 760 86 83 772 795 116 111 808 821 148 142 832 843 182 175 869 862 219 212 876 878 260 25 1 895 892 301 292 912 905 342 333 925 916 382 373 938 927 420 41 1 950 937 457 449 960 946 492 484 970 955 526 5 19 978 963 558 55 1 993 97 1 590 584 1004 97 8 602 596 1002 985
Table 20. Measured Axial Deformation of Column No. 3
Time Deformation
(min)
-2.80
Table 21. Failure Time for Various Failure Criteria Column No. 1 2 3
Failure Time (min)
Theoreacal 137 137 78 Experimental Deformation 135 145 83
rn
be maintained 150 160 92Table 22. Fire Resistance and Critical Temperature of Test Columns as a Function of Load Column No.1
-
W10x60, 39mm Sprayed fibre insulation Test load: 1760 kN Load (kN) 3400 3326 3263 3203 2983 2617 2202 1953 1672 1359 1039 906 789 685 590 Column No.2-
W10x49, 55mm Cementitious mixture insulation Test load: 1424 kN Fire Resist. (min) 0 20 40 60 80 100 120 130 140 150 160 165 170 175 180 Load (kN) 2634 2592 2539 2448 2266 2028 1722 1553 1357 1140 906 711 553 423-
Column No.3-
W10x49, 30mm Sprayed fibre insulation Test load: 1424 kN Crit. Temp. ("C) 6 24 72 123 226 329 432 483 535 586 638 663 689 715 741 Load (kN) 2641 2569 2459 2315 2143 1927 1672 1374 1204 1016 837 689 562 455 Fire Resist. (min) 0 20 40 60 80 100 120 130 140 150 160 170 180 190 Fire Resist. (min) 0 20 30 40 50 60 70 80 85 90 95 100 105 110 Crit. Temp. ("C) 17 60 103 158 250 342 434 480 526 572 618 664 710 756 Crit. Temp. ("C) 6 79 153 227 301 375 449 523 560 596 633 670 707 744FIGURE
1.
ELEVATION AND CROSS SECTION OF TEST COLUMNS254 mm
254 m m
COLUMN No. 1 COLUMN Nos. 2 AND 3
FIGURE 3. LOCATION OF THERMOCOUPLES ENDPLATE LEVEL 4 LEVEL 3 LEVEL 2 LEVEL 1
T O P V I E W 1 , 2 C O l U M N F U R N A C E 3 , 4 5 r 6 C H A M B E R 7, 8 I I I D O O R ( E A S T S I D E )
FIGURE 5. LOCATION OF THERMOCOUPLES IN FURNACE
I
DEFLECTION CURVATURE0 1 I
0 20 40
a
W 100 120 1 4 0TIME ( min
)
0
0 20 40 60 80 100 120 140 160
TIME ( min )
Figure 9. Furnace Temperature during Test of Column No. 2
I
o 20 40 00 m I
w
TIME
(
min)
600. 0 Meaaured 500
-
-
Representative Curve 400-
JQO-
200-
TIME(
min)
Figure 1 1 . Average Steel Temperature a t Midheight of Column No. 1
-
600-
o Measured"
5 0 0 --
Representative CUN*P
V-
W 400-
-
W a 2 2 0 0 --
W I--
0 20 40 w 00 100 1 20 140 1W TIME(
min)
Figure 17. Axial Deformation of Column No. 1 as a Function of Time n
E m -
E
Vz
15 0--
FIUIIERMr.
-
-nlmmmx 0 0 / 0-
/.
0g
1 0 --
Ke
W 5 - P.
3'
2
O -.
-
-
-5 0 20 40 60 110 100 110 140 160 TIME(
min)
V 0
z
1 5 - W 5 - P 0 20 40 60 00 100 120 140 1 W TIME(
min)
Figure 18. Axial Deformation of Column No. 2 as a Function of Time
I
0 20 40 80 80 100 120
TIME
(
min)
200 180
-
n C 100-
140- V-
y
120-
3
loo-
I--
g
e o -
-
2
8 0 - CQUClND.3 W-
=
40.e
-
20-
-
0 0 S Q O l O O O l S Q O Z O O O 2 5 4 0 J a O O ~ 4 a x , LOAD(
kN)
a
200F"
E
loo0
Figure 21. Critical Steel Temperature of the Test Columns as a Function of Load