Publisher’s version / Version de l'éditeur:
International Journal of Heat and Mass Transfer, 44, May 9, pp. 1803-1815, 2001-05-01
READ THESE TERMS AND CONDITIONS CAREFULLY BEFORE USING THIS WEBSITE.
https://nrc-publications.canada.ca/eng/copyright
Vous avez des questions? Nous pouvons vous aider. Pour communiquer directement avec un auteur, consultez la première page de la revue dans laquelle son article a été publié afin de trouver ses coordonnées. Si vous n’arrivez pas à les repérer, communiquez avec nous à [email protected].
Questions? Contact the NRC Publications Archive team at
[email protected]. If you wish to email the authors directly, please see the first page of the publication for their contact information.
NRC Publications Archive
Archives des publications du CNRC
This publication could be one of several versions: author’s original, accepted manuscript or the publisher’s version. / La version de cette publication peut être l’une des suivantes : la version prépublication de l’auteur, la version acceptée du manuscrit ou la version de l’éditeur.
For the publisher’s version, please access the DOI link below./ Pour consulter la version de l’éditeur, utilisez le lien DOI ci-dessous.
https://doi.org/10.1016/S0017-9310(00)00227-1
Access and use of this website and the material on it are subject to the Terms and Conditions set forth at
A Mass transfer model for simulating volatile organic compound emissions from "wet" coating materials applied to absorptive substrates
Yang, X.; Chen, Q.; Zeng, J.; Zhang, J. S.; Shaw, C. Y.
https://publications-cnrc.canada.ca/fra/droits
L’accès à ce site Web et l’utilisation de son contenu sont assujettis aux conditions présentées dans le site LISEZ CES CONDITIONS ATTENTIVEMENT AVANT D’UTILISER CE SITE WEB.
NRC Publications Record / Notice d'Archives des publications de CNRC:
https://nrc-publications.canada.ca/eng/view/object/?id=8ea3aa04-2880-47ea-9624-a0f4b4019fdf https://publications-cnrc.canada.ca/fra/voir/objet/?id=8ea3aa04-2880-47ea-9624-a0f4b4019fdf
A Mass transfer model for simulating volatile
organic compound emissions from 'wet'
coating materials applied to absorptive
substrates
Yang, X.; Chen, Q.; Zeng, J.; Zhang, J. S.;
Shaw, C. Y.
A version of this paper is published in / Une version de ce document se trouve dans : International Journal of Heat and Mass Transfer, v. 44, no. 9, May 2001, pp.
1803-1815
www.nrc.ca/irc/ircpubs
A mass transfer model for simulating volatile organic compound emissions
from “wet” coating materials applied to absorptive substrates
X. YANG1*, Q. CHEN1, J. ZENG2, J.S. ZHANG3, and C.Y. SHAW2
1 Building Technology Program, Massachusetts Institute of Technology, 77 Massachusetts Avenue, Cambridge, MA 02139, USA
2 National Research Council of Canada, Institute for Research in Construction, Indoor Environment Program, M-24, Montreal Road, Ottawa, Ontario K1A 0R6, Canada.
3 Department of Mechanical, Aerospace & Manufacturing Engineering, Syracuse University, 147 Link Hall, Syracuse, NY 13244, USA
* Present address: Department of Civil, Architectural, and Environmental Engineering, University of Miami, Coral Gables, FL 33124-0630, USA, Fax: (305) 284-3492
Abstract
A numerical model has been developed to simulate volatile organic compound (VOC) emissions from “wet” coating materials. The model considers the VOC mass transfer process in the air and material-air interface, and diffusion in the material film and also in the substrate. Our numerical simulations confirmed that the emissions from “wet” materials applied to an absorptive substrate are dominated by evaporation at the beginning followed by internal diffusion, which had been hypothesized based on previous experimental data. The numerical model has been validated based on the data from small-scale environmental chamber tests.
Nomenclature
A property of compounds
C VOC concentration [mg m-3]
Ca air phase VOC concentration [mg m-3]
Ca,0 initial air phase VOC concentration [mg m-3]
Cl,0 initial VOC concentration in the “wet” source [mg m-3]
Cm VOC concentration in the material film [mg m-3]
Cms VOC concentration at the film-substrate interface [mg m-3]
Cm,0 initial VOC concentration in the material film [mg m-3]
Cp specific heat [J kg-1 K-1]
Cs VOC concentration in the substrate [mg m-3]
Cs,0 initial VOC concentration in the substrate [mg m-3]
D0 initial diffusion coefficient in the material film [m2 s-1]
Da VOC diffusion coefficient in the air [m2 s-1]
Dm effective diffusion coefficient in the material film [m
2 s-1] Dm,0 initial VOC diffusion coefficient in the material film [m2 s-1]
Ds VOC diffusion coefficient in the substrate [m2 s-1]
Ds,0 initial diffusion coefficient in the substrate [m2 s-1]
Ed activation energy [kJ mol-1]
gi component i of the gravitation vector [m s-2]
Kma material-air partition coefficient [-]
L characteristic length of the source [m]
Ls thickness of the substrate [m]
P air pressure [Pa]
q VOC emission rate [mg m-2 s-1]
) ( q ~
n−
τ a term determined by the history of Cs, Ds, Ls, and ∆τ [mg m-2 s-1]
R universal gas constant (=8.3145 J mol-1 K-1)
Reh Reynolds number based on h, Vhρ/µ
ReL Reynolds number based on L, VLρ/µ
S VOC source term [mg m-3 s-1]
Sc Schmidt number of VOC
T absolute temperature [K]
uj (j=1,2,3) three components of air velocity [m s-1]
V air velocity at the center of the inner chamber [m s-1]
xj (j=1,2,3) coordinates
y the normal direction of the film surface
X0 coefficient to calculate the sorption rate on a solid material
Greek Symbols
α liquid expansion factor
δ thickness of the “wet” film [m]
τ time [sec]
µ molecular viscosity of air [Pa.s]
ρ air density [kg m-3]
∆τ time step [sec]
Subscripts
a air phase
i, j spatial coordinate indices
m material film
ma material film - air interface
ms material film - substrate interface
n the nth time step
n- times prior to the nth time step
ref reference
1 Introduction
Interior architectural coatings such as wood stains, vanishes, and paints are widely used in buildings. Most of these “wet” coatings contain petroleum-based solvents and thus emit a wide variety of volatile organic compounds (VOCs). These VOCs can increase indoor air pollution [1]. Hence, understanding the emission characteristics of “wet” materials is important for preventing indoor air pollution problems.
Currently, characterization of VOC emissions from “wet” coating materials are mainly by experimental approach. The approach uses environmental test chambers to measure VOC emissions under controlled indoor conditions [2]. The measurement of emissions can be either directly or indirectly. An example of direct measurement is the use of an electronic balance to monitor the weight decay of a “wet” source as a function of time [3]. Indirect measurement monitors the time-dependent chamber VOC concentration changes resulting from emissions of the substrate and uses either empirical or simple physical equations to calculate the emission rates.
Using environmental chambers, previous studies have indicated that the emission process of “wet” materials appears to have three phases [3]. The first phase represents the period shortly after the material is applied but is still relatively wet. The VOC emissions in this phase are characterized by high emission rates but fast decay. It appears that emissions are related to evaporation at the surface of the material. In the second phase, the material dries as emissions
transition from an evaporation-dominant phase to an internal-diffusion controlled phase. In the third phase the material becomes relatively dry. In this phase the VOC off-gassing rate decreases and so does the decay rate. The dominant emission mechanism in this phase is believed to be the internal diffusion of VOCs through the substrate [4, 5, 6]. Previous studies have also found that the emissions of “wet” materials are likely to depend on environmental conditions (e.g., temperature, air velocity, turbulence, humidity, VOC concentration in air) and also physical properties of the material and the substrate (e.g., diffusivity).
Since the emission behavior of “wet” materials can be affected by many factors, it would be too expensive to investigate the emissions purely by experiments. A feasible way would be to develop computer models to simulate the emission processes based on limited experimental data. Source models are also useful for analyzing the emission data obtained from test chambers, for extrapolating the test results beyond the test period, for developing simplified methods and procedures for emission testing, and for evaluating the impact of various building materials on VOC concentrations in buildings.
Previous emission source models for “wet” materials are mainly focused on the evaporation dominant stage. For example, the Vapor pressure and Boundary layer (VB) model [7] considers emission as a pure evaporation process and neglects internal diffusion. It has been found that such a model does not work for the entire emission process, especially when the material becomes relatively dry [8, 9]. Recently, researchers have proposed semi-empirical models [e.g., 9] to examine the entire process (from “wet” to dry). However, the use of empirical factors limits
the general applicability of these models. Further, existing models fail to consider the impact of substrates on emissions.
In this paper, a comprehensive emission model that applies to the entire emission process of a “wet” material applied to a realistic substrate has been developed. The model considers VOC mass transfer in the air and material-air interface, diffusion in the material film, and also diffusion in the substrate. It is able to predict the VOC emission rates of a “wet” material under different environmental conditions.
The following section analyzes the emission mechanisms for “wet” materials applied to a porous, absorptive substrate (e.g., oak board). A description of the model development and validation follows.
2 The emission mechanisms
The scenario considered is a “wet” coating material applied to an absorptive substrate such as wood. For simplicity, we assume that the amount of coating material is small so that all the liquids will be absorbed by the porous substrate after application. VOCs can be contained in the substrate as free liquid in the cell cavities or bound VOCs held in the cell walls.
When the substrate with applied “wet” coating material is exposed to air, VOCs will gradually be off-gassed from the film surface. During the emission process, several mechanisms of external and internal VOC mass transfer occur. These mechanisms include evaporation at the material
surface, movement of free or bound VOCs, VOC vapor diffusion in the material film, and VOC diffusion from the material film to the substrate. Each of these mechanisms, shown in Figure 1, will now be discussed.
2.1 Evaporation
After a “wet” material is applied to a substrate, the VOCs will evaporate at the material-air interface. In general, the rate of evaporation of a partially saturated porous medium to a convective medium depends on the phase distributions on, and adjacent to, the interface. Figure 1 shows that, from a microscopic point of view, the interface of a macroscopically flat surface is not planar. The distribution of the liquid phases on this interface is very complex and depends on a solid topology, the degree of roughness of the surface, and the amount of “wet” material applied, etc. The phase distributions on the air-exposed side are governed by environmental conditions, i.e., temperature, airflow, relative humidity, and the air phase VOC concentration. At the beginning of the emission process, the liquid phase is close to saturation, so environmental conditions dominate the rate of evaporation. As more VOCs are off-gassed, the surface saturation decreases along with the vapor pressure and emission rates. At the same time, the dominant emission resistance gradually changes from evaporation to internal mass transfer, such as the movement of free or bound VOCs and vapor flow.
2.2 Movement of free and bound VOCs
The compounds absorbed by the substrate are either free liquids stored in the pore cavities or bound to the cell walls. Free liquids may develop immediately after the application. They are then more likely to be bound to the cell walls by physical or chemical forces.
Movement of free or bound VOCs cannot be simply defined as a diffusion process. Rather, this is due to capillary motion along very fine capillaries. However, extensive literature on a similar phenomena of movement of bound water in a porous material uses an analogous form of Fick’s second law to describe the process [e.g., 10, 11]. In this approach, movement of free or liquid moisture is usually described by well-defined mass transfer equations. All the mechanisms characterizing this process depend on a single property: the diffusivity of the moisture. Clearly, diffusivity depends on the microscopic structure of the material. Moreover, evidence shows that diffusivity is also a strong function of temperature and water content [12, 13]. Similarly, the movement of free and bound VOCs is also affected by the substrate structure, temperature, and VOC concentrations in the material.
2.3 Vapor flow
During the emission process, liquid or bound VOCs may also evaporate inside the substrate, resulting in the vapor flow through the voids of porous material by convection and diffusion. Two kinds of diffusion are key to this process: molecular diffusion and Knudsen diffusion. When the capillary size is large compared to the mean molecular free path of VOC, λ, molecular
diffusion prevails. On the other hand, when the capillary size is smaller than λ, the Knudsen diffusion predominates.
The vapor flow from a “wet” coating material applied to a wood substrate are expected to be much less than the bound VOC flow due to two reasons. First, the material film absorbed by the substrate is usually very thin. The internal cavities of the substrate are mostly occupied by the liquids when the material is applied so there is not enough “room” for evaporation to take place inside the cavities. Second, for most surface coating materials the additives on the material surface quickly dries and hardens to prevent vapor VOCs from filtrating through the material surface. Hence, the effect of vapor flow will not be considered in our subsequent study.
2.4 VOC diffusion from the material film to the substrate
The existence of VOC diffusion from the material film to the substrate is based on the assumption that once the “wet” material is applied to a substrate, a recognizable front will form between the material film and the rest of the substrate. At the beginning of the emission process, the pore space is filled with liquid above the front but is free from the liquid below the front. Hence, VOCs will also diffuse to the substrate from the material film due to the concentration gradient located on the boundary.
Because of the porous property of the substrate, the VOC diffusion to the substrate is also a sum of diffusion processes including dissolution into and permeation through the cell walls and diffusion through the cell walls from one wall to the next. In addition, VOCs may also evaporate
in the cell cavities and diffuse through the holes in the cell walls. A microscopic view of the entire diffusion processes will yield a picture that is too complicated to be solved. Hence, simplified approaches are needed to characterize the in-substrate diffusion. One of the simple approaches is the use of continuum model. Similar to the approach for describing the movement of free or bound VOCs from a material film, the continuum model treats the material as a homogeneous medium that can be characterized by an effective diffusion coefficient, Deff.
Introduction of Deff allows the use of Fick’s law to predict the mass transfer within a porous
material. Recognizing that VOC diffusion in the substrate is so complicated that detailed mechanistic models are impossible to use, the continuum model will also be used in our study to address the in-substrate diffusion. Such a model, though, cannot distinguish individual differences between mechanisms, but can be employed to address the in-substrate diffusion due to its simplicity.
3 The mathematical model
Based on the discussion of the emission mechanisms in the previous section, a mathematical model that describes the mass transfer processes for a “wet” material applied to a porous substrate can be established. In addressing this problem, we make the following assumptions:
(1) The amount of coating material applied is small so that the material is quickly absorbed by the porous substrate after the application, and a wet layer with a uniform initial VOC concentration is formed inside the substrate. The upper boundary of the wet layer is exposed to ambient airflow and the lower boundary is the substrate initially unaffected by the wet film.
(2) Both the material film and substrate can be treated, from a macroscopic point of view, as homogeneous. Hence, it is possible to define an effective VOC mass diffusivity (including TVOC).
(3) During the emission process, VOCs in the material film and the VOC vapor pressure are in thermodynamic equilibrium at the material-air interface. The VOC off-gassing only occurs at the material-air interface.
(4) The VOC gradients are considered as the only driving force for mass transfer.
(5) The mass transfer rate between the air and material is very small. Hence, heat generation/release associated with the emissions is negligible.
(6) The VOCs are passive contaminants and have no impact on airflow.
(7) There is no chemical reaction inside the material film or the substrate to generate or consume VOCs.
Using the above assumptions, the VOC emissions from a “wet” material are governed by mass transfer in four different layers: the material film, the substrate, the material-air interface, and the air phase. The following sections present the governing equations of VOC mass transfer in these layers.
3.1 Material film
Based on the previous discussion, the transient VOC diffusion process in the material film can be expressed in a form analogous to Fick’s law:
) x C D ( x C j m m j m ∂ ∂ ∂ ∂ = ∂τ ∂ (1)
The key to using Eq. (1) effectively is to determine the Dm. It is a function of the pore structure, the material type, compound properties, temperature, and the VOC concentration in the material film. For a given “wet” material-substrate-VOC system, the Dm is considered a thermally activated process and can be expressed by the following Arrhenius-type equation:
) exp( ) ( ) , ( RT E C D T C D d m m m = − (2)
Crank and Park [14] explained that the activation energy will be larger for bigger molecules. Glasstone et al. [15] showed that the Ed may be related to the energy of evaporation for the solute molecules. Limited data obtained by Crank and Park [14] suggested that the Ed for different gasses in polymers varies within a limited range (4.0 - 12.0 kcal/mole), which agrees with the results given by others [e.g., 16, 17, 18]. For example, Barrer [16] cited the Ed values for CO2 ranging from 7.3 Kcal/mole in polybutadiene to 14.4 kcal/mole in isoprene acrylonitrile rubbers. Van Amerongen [17, 18] found the E of N and O in three different polymers ranging from 6.8
to 12.4 Kcal/mole. However, too little data have been collected over a wide range of materials to allow definitive conclusions to be drawn.
The temperature for indoor applications only vary within a small range. Hence, it may be possible to estimate the Ed using the above results as reference data. For example, Chen and Lin [19] used (for unknown reasons) Ed =7.3 kcal/mole (30.5 kJ/mole) for moisture in polymer solution. Later in section 5.2, we present the results when the same value of Ed is used for VOCs.
The determination of the dependence level of Dm on VOC concentrations, however, will involve major difficulties. Currently, theories for calculating liquid-state diffusion coefficients are quite idealized, and none is satisfactory in providing relations for calculating the correct diffusion coefficient [20]. Another factor hindering the determination of the Dm for VOC is the presence of the substrate. Since the “wet” material is embedded in a porous substrate, VOC diffusion with the presence of a substrate is generally slower than diffusion in a material film without the substrate. There are two reasons for the lower effective diffusion coefficient. First, during diffusion through the porous substrate, part of the VOCs are retained by the internal surface of the substrate. This tends to slow or retard the mass transfer through the substrate. Second, due to the tortuous nature of the internal diffusion path in the substrate, it takes VOCs longer to diffuse through the substrate.
In the numerical study that follows, we use a third-power empirical equation to describe the dependence of Dm on VOC concentration in the material film:
3 0 , 0( ) ) ( m m m C C D C D = (3)
Eq. (3) is based on a similar study of the dependence of moisture transfer on moisture content in a hygroscopic material [13]. Note the equation may not apply for a very small Cm /Cm,0 (when
material film is totally dry) in that it will lead to an infinitely small Dm as Cm /Cm,0 approaches 0.
The VOC diffusivity in a dry film needs to be measured directly or estimated with long-term (e.g., several weeks or months) experimental data. As an approximation, the VOC diffusion coefficient in the substrate (see section 3.2) can be used as an asymptote of Dm at low Cm.
For the convenience of future applications, Eqs. (2) and (3) can be rewritten as:
3 0 , 0 , ( ) ) , ( m m m m m C C D T C D = (4) and ) RT E exp( D Dm,0 = 0 − d (5)
where for a specific material film and VOC, Dm,0 at a reference temperature needs to be determined by experimental data. The Dm,0 at a temperature different from the reference temperature can then be calculated using Eq. (5).
3.2 Substrate
By using the “continuum model” and Fick’s law, the transient VOC diffusion process in the substrate may be described by:
) x C D ( x C j s s j s ∂ ∂ ∂ ∂ = ∂τ ∂ (6)
Similar to the diffusivity in the material film, the dependence of Ds on temperature and VOC concentration should also be considered. However, Schwope et al. [21] has suggested that the concentration dependence on the diffusion coefficient may be ignored below a concentration ratio (a dimensionless ratio of the VOC concentration in the material to the material density) of 1%. Recognizing that the VOC concentration in the substrate will be small, the dependence of the Ds on the VOC concentration can thus be ignored. The dependence of Ds on temperature is assumed to follow the Arrhenius equation as:
) RT E exp( D D d 0 , s s = − (7)
The VOC flux at an arbitrary displacement of material is given by:
j s s x C D q ∂ ∂ − = (8)
In general, the VOC diffusion rate in a substrate can be solved numerically. However, the Ds in
most solid substrates is usually very small. If a direct numerical simulation of VOC diffusion in the substrate is used, a very fine grid distribution in the substrate is needed to eliminate the false numerical diffusion. Such a solution requires a fast computer with large capacity. To avoid this, we developed a new sorption model to analytically solve the VOC mass transfer rate. In this way, no numerical grid in the substrate is needed. The sorption model, detailed by Yang [22] and Yang and Chen [23], calculates the time-dependent VOC mass transfer (sorption) rate by the substrate as (Figure 2): ) ( ~ ) ( ) ( n = X0Cms n +q n− qτ τ τ (9)
Eq. (9) links the VOC sorption rate with the VOC concentration at current time step, Cms(τn), and the effect of its history on sorption, q~( )
n−
τ , in a linear form. The sorption model can serve as a boundary condition to the numerical cell of the material film. In this way, no numerical grids in the substrate are needed.
3.3 Material-air interface
At the material-air interface, the VOC changes phase from the material (liquid or solid) side to the air side. Henry’s Law states that at equilibrium, the ratio of the concentration of a volatile solute in a solvent, Cm (mg/m3), to the solute’s concentration in the vapor phase above the
solvent-solute mixture, Ca (mg/m3), is a constant. Although Henry’s Law is valid only for
interest [24]. When the same units are used for both Cm and Ca, Henry’s Law can be expressed as: a ma m K C C = (10)
where Kma is a constant, which frequently is called the dimensionless material-air partition coefficient. For a “wet” coating material that emits different VOCs, the headspace analysis [22] is usually used to determine Kma at a reference temperature (e.g., 23 °C). Assuming the Kma at the
reference temperature, Tref, is Kma(Tref), the Kma at a different temperature, T, will be [22]:
) 1 1 ( 2185 . 0 10 ) ( ) ( T Tref A ref ref ma ma T T T K T K − = (11)
where A is the property of the compounds [4].
3.4 Air
The VOC transport in the air is determined by diffusion through the boundary layer at the material-air interface. Since the VOC boundary condition at the material-air interface cannot be determined a priori, the problem should be posed and solved as a conjugate mass transfer. Hence, a complete set of airflow and VOC transport equations in the air phase are needed in order to fully describe the VOC transport process in the air. For an incompressible and Newtonian flow,
the conservation equations for continuity, momentum (using Boussenisseq approximation for buoyancy), energy, and VOC species are as follows:
Continuity equation: 0 ) u ( xj ρ j = ∂ ∂ (12) Momentum equation: ) ( ) ( ) ( ) ( i ref i j i j i j j i g T T x p x u x u u x u − − ∂ ∂ − ∂ ∂ = + µ ρ β ∂ ∂ ρ ∂ ∂ ρ ∂τ ∂ (i=1,2,3) (13) Energy equation: T p j j j j S c 1 ) x T Pr ( x ) T u ( x ) T ( + ∂ ∂ µ ∂ ∂ = ρ ∂ ∂ + ρ ∂τ ∂ (14)
Air phase VOC transport equation:
S ) x C Sc ( x ) C u ( x ) C ( j a j a j j a ∂ +ρ ∂ µ ∂ ∂ = ρ ∂ ∂ + ρ ∂τ ∂ (15)
be solved numerically to obtain the distributions of air velocity and temperature. In case the flow is turbulent, we also need a suitable turbulence model so that we can simulate the airflow and VOC transport on a personal computer. In the study that follows, only laminar flow will be considered although the general principle applies to turbulent flow as well.
3.5 Boundary conditions
Appropriate boundary conditions for velocities, temperature, and VOC species are needed in order to close the governing equations. The common velocity and temperature boundary conditions, including inlet, outlet, and walls, can be found in the literature [e.g., 25] and will not be discussed here.
The boundary conditions for VOCs are:
Ca,inlet=0 at the air inlet (16)
y C D y C D a a m m ∂ ∂ − = ∂ ∂
− at the material-air interface (17)
y C D y C D s s m m ∂ ∂ − = ∂ ∂
− at the film-substrate interface (18)
s m C
C = at the film-substrate interface (19)
0 , = = s L y s
where y is the normal direction of the film surface. The VOC boundary conditions are also illustrated in Figure 2.
3.6 Initial conditions
The VOC initial conditions are:
Ca, 0 = 0 in the air (21)
Cm, 0 = Cl,0/α in the material film (22)
Cs, 0 = 0 in the substrate (23)
In Eq. (22) the liquid expansion factor (α) is introduced to represent the absorptivity of the substrate. Physically, α means that once a “wet” material is applied to an absorptive substrate, the volume of the liquid film absorbed by the substrate will expand by a factor of α to the initial volume, and the initial VOC concentration in the film will decrease by a factor of α. The method for estimating α is given by Yang [22].
3.7 Numerical method
The mass transfer model developed above applies to the entire emission process of “wet” materials (from wet to dry). The numerical simulation of the above equations requires a simultaneous solution together with the airflow and VOC transport equations. However, since VOC emissions have a negligible impact on air flow and heat transfer, the process can be
separated into two parts. First, we simulate the airflow and obtain the steady-state distributions of air velocity and temperature using a CFD (computational fluid dynamics) program. This is done by solving Eqs (12) – (14) with appropriate flow boundary conditions. The flow and temperature results are then incorporated into the VOC mass-transfer equations (Eqs. (1) - (11) and (15) – (23)) for simulating emissions.
4 Experimental work
The above mathematical model is based solely on the mass transfer mechanisms during each phase. Theoretically, the model can predict VOC emissions provided that the physical properties of the compounds and substrate are given. Although the properties such as the material-air partition coefficient can be experimentally measured, others, such as the effective diffusivities in the material film and substrate, are more difficult to obtain accurately. To obtain these unknown diffusivities as well as to validate the mathematical model proposed, we conducted a series of experiments to measure the VOC emissions from a commercial wood stain using a small-scale environmental chamber.
Figure 3 shows the configuration of the small-scale chamber [6]. The chamber consisted of an inner and an outer chamber, both made of stainless steel. The outer chamber (1.0 m long × 0.8 m wide × 0.5 m high or 0.4 m3 in air volume) facilitated the control of temperature and humidity. Conditioned air was supplied to the outer chamber to maintain a constant temperature and humidity [2]. The inner chamber in which the test material was placed acted like a wind tunnel that provided controls for the local velocity over the surface of material samples under testing. The local
velocity was controlled by a stainless tube-axial fan. The fan drew air through the inner chamber and discharged it through the holes into the outer chamber. A microcomputer was used to monitor and control the test conditions, including the air-exchange rate, temperature, and humidity within the chamber, air velocity above the material, ambient air temperature and relative humidity. Complete mixing in the chamber can be achieved in approximately 15 minutes of operation [8].
A commercial wood stain applied on oak substrates of 0.06 m2 (0.24m×0.25m) was tested in the small-scale environmental chamber. The testing material was placed in the inner chamber. An electronic balance was used to monitor the weight loss due to the VOC emissions from the testing material [3]. The flow over the material was parallel to the material surface. The air velocity above the material at the center of the inner chamber was controlled at approximately 0.15m/s, which corresponds to a common air velocity found indoors [26, 27]. The air exchange rate of the entire chamber was 1.0 air change per hour (ACH) and the relative humidity in the chamber was controlled at 50±2%. The chamber was operated at four temperatures, i.e., 20.5±0.5°C, 23.5±0.5°C, 27.5±0.5°C, and 31.5±0.5°C, representing low to high indoor temperatures.
5 Results and discussion
This section presents both the measured and simulated results of “wet” material emissions. In the following, the test case in which the temperature was 23.5±0.5°C is called the reference case because the measured emission data of that case were used to obtain the unknown diffusion
coefficients. The diffusivity values for different temperatures are then calculated based on the reference diffusivity and Eqs. (5) and (7) for the material film and substrate, respectively. Results for temperatures other than the reference temperature are used to validate the model developed.
5.1 Simulation of the reference case
We started the reference cases by first simulating the airflows in the small-scale chamber. The Reynolds number of the flow, Reh, in the inner chamber was:
Reh=Vhρ/µ (24)
For the reference case, V = 0.15 m/s and h = 0.08 m. The Reh was 800, which means the flow
was laminar. The simulated airflow patterns using a commercial CFD code [28] in a section over the material are shown in Figure 4. Figure 5 gives the simulated velocity distribution by CFD above the material in the inner chamber. The air exchange rates in the inner chamber was about 1800 air changes per hour (ACH) based on the air velocity in the inner chamber (0.15 m/s). However, the air exchange rate in the whole chamber was only 1.0 ACH. The exhaust fan in the inner chamber exhausted the contaminated air to the outer chamber, resulting in a bulk velocity of about 0.01 m/s for the outer chamber.
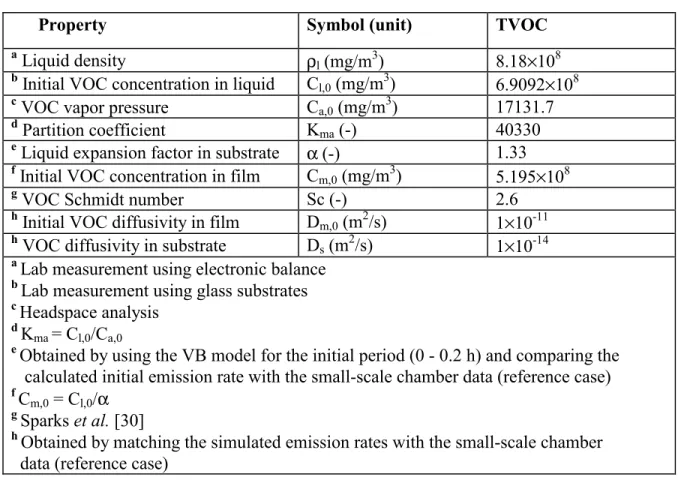
Table 1 lists the physical properties for total VOC (TVOC) emissions from the wood stain. Detailed procedures for obtaining the properties are given by Yang [22]. It should be noted that in this study, we assume that the TVOC mixture has lumped properties and the properties of the
most dominant component in the solvent mixture can approximate the average properties of the TVOC mixture. This is clearly an approximation because the composition of the mixture may change over time. However, Guo et al. [29] have shown that the assumption is adequate for petroleum-based “wet” sources such as wood stains.
Figure 6 compares the measured and simulated TVOC emission rates in the small-scale chamber for the reference case using both the numerical model and the VB model. The average air phase mass transfer coefficient used in the VB model was 4.03 m/h (V = 0.15 m/s). The value was obtained by CFD simulation. Since the VB model assumes no internal diffusion in the material film and the substrate, it only applies to the period when the emissions are dominated by evaporation. The difference of the emission rates predicted by the VB and numerical models indicates the effects of diffusion. The results show that evaporation dominated the emission process only during the first 0.2 hour. After that, emissions gradually became internal-diffusion-controlled which rendered the VB model invalid. The results confirmed that emissions from “wet” materials applied to an absorptive substrate are dominated by evaporation at the beginning and internal diffusion afterwards, which had been hypothesized based on previous experimental data.
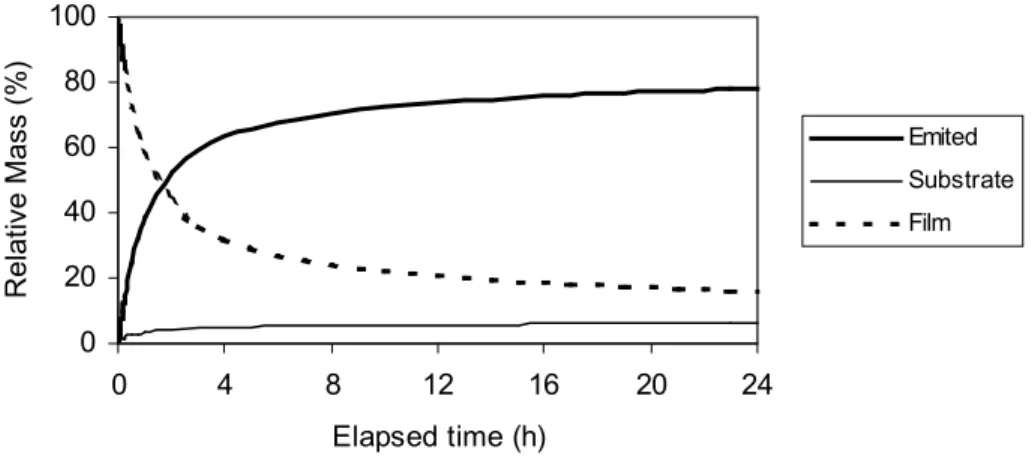
An analysis of VOC mass balance during the emission process further helped us to quantitatively characterize the “wet” material emissions and the substrate effect. Figure 7 gives the predicted percentages of the VOC mass emitted from the material, diffused from the film to the substrate, and remaining in the material film, respectively. At the beginning, VOC emitted very quickly. About 63% of the VOCs were emitted within the first 4 hours, while about 5% of the VOCs were
diffused into the substrate. After that, both the emission amount and substrate sorption amount increased slowly. At τ=24 hour the percentage of VOCs emitted, diffused (to the substrate), and remaining inside the film were 78.1%, 6.1%, and 15.8%, respectively. This means that after 24 hours, only about 15% of the VOCs remained in the material film. Emissions from this small amount, however, is expected to last for a long period of time due to slow diffusion inside the material film and the substrate.
By using the numerical model, it is also possible to examine the VOC distributions in different mass transfer layers as illustrated in Figure 2. Figure 8 shows the relative VOC concentration distributions in the material film (y/δ<1), at the material-air interface (y/δ=1), and the air phase boundary layer (y/δ>1) at different times. The VOC distributions in the substrate was not shown because the concentrations in the substrate were not calculated directly (the mass transfer to the substrate was calculated using the sorption model).
Figure 8 depicts the VOC evolution in different layers. At the beginning (e.g., 0 - 15 minutes), the VOC concentration in the material film was close to the initial concentration (C/Cm,0 → 1).
The concentration gradient in the film was small. At the same time, the VOC concentration in the air was also small except in the area very close to the interface (y/δ<10). Emissions in this period were dominated by the VOC phase change at the interface and gas phase mass transfer. As time goes on, the concentration gradient in the material film especially near the interface became larger while the gradient in the air phase boundary layer became smaller. This indicated that diffusion began to dominate the gas phase mass transfer. The above results support our previous conclusions based on the VOC emission rates. During this process (τ>15 min), the air phase
concentration in the boundary layer first increased due to the air phase mass transfer, and then decreased due to the decreasing emission rates from the source.
5.2 Validation of the model based on the small-scale chamber data
As discussed earlier, we obtained the unknown diffusivities, Dm,0 and Ds, based on the measured
data of the reference case. With the property values and Eqs. (5), (7), and (11), the model should apply to different environmental conditions (velocity, ventilation rate, temperature). In the following, we will test whether the model can correctly predict the emissions at different temperatures.
Using the partition coefficient (Kma) and diffusion coefficients (Dm,0 and Ds) for wood stain at
23.5 °C as the reference data (which have been obtained), Kma, Dm,0, and Ds at different
temperatures, as calculated using Eqs. (5), (7), and (11), are listed in Table 2. A value of 30.5 kJ/mole for activation energy (Ed) was used to calculate the temperature dependence of Dm,0 and
Ds.
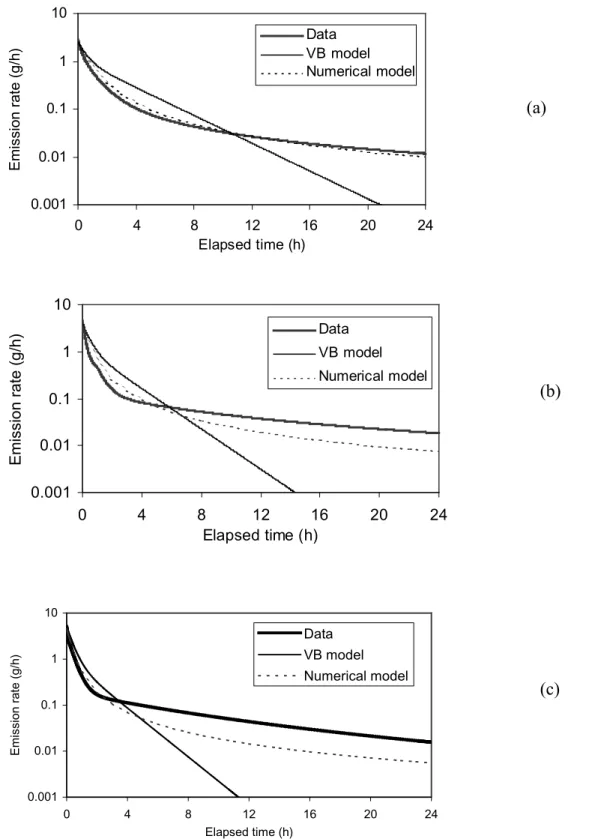
Figure 9 compares the measured and simulated VOC emission rates (using both numerical and VB model) of wood stain at different temperatures. The results of the numerical model generally agree with the data. However, a relatively large discrepancy was found for the high temperature cases (27.5 °C and 31.5 °C) especially during the diffusion dominant period (τ > 10 h). Possible reasons for this could derive from both simulation and experimental errors. Eqs. (5), (7), and (11) may not be accurate for TVOC at high temperatures (e.g., 31.5 °C). On the other hand, the
measurement data gathered at a higher temperature could be affected by moisture fluctuations during this period [22]. Despite such discrepancies, the results from the numerical simulation match the experimental data reasonably well.
6 Conclusions
A numerical model has been developed to simulate the VOC emissions from “wet” coating materials applied to absorptive substrates. The model is based on the VOC mass transfer of the entire “wet” material-substrate system. The system includes four layers: air, material-air interface, material film, and the substrate. The model is a detailed prediction tool to account for the interaction of different mechanisms, such as internal diffusion and evaporation, and their impact on emissions. It can also be used to quantitatively evaluate the effects of a single factor, such as air velocity and temperature on emissions. The use of the model could also significantly reduce the need of chamber measurements, which are expensive, time consuming, and may be subject to measurement errors. The use of the numerical model leads to the following conclusions:
(1) The numerical simulations have confirmed that the emissions from the “wet” materials applied to an absorptive substrate are dominated by evaporation at the beginning and internal diffusion afterwards, which had been hypothesized based on previous experimental data.
(2) The numerical model requires material properties such as VOC diffusivities in the material film and the substrate. The current study used small-scale chamber data to obtain these properties. With these property values, the numerical model can be used to study “wet” material emissions in
different conditions. The numerical model has been validated based on the data from small-scale environmental chamber tests.
Acknowledgements
This investigation is supported by the US National Science Foundation (Grant CMS-9623864) and National Research Council of Canada.
References
1. World Health Organization (WHO), Indoor air quality: organic pollutants, Copenhagen, WHO regional office for Europe (EURO Report and Studies I111) (1989).
2. ASTM, Standard Guide for Small-scale Environmental Chamber Determinations of Organic
Emissions from Indoor Materials/products, American Society of Testing and Materials, Philadelphia (ASTM D5116) (1990).
3. J. S. Zhang, G. Nong, C. Y. Shaw, and J. M. Wang, Measurements of volatile organic compound (VOC) emissions from wood stains by using an electronic balance, ASHRAE
Transactions Vol. 105, Part 1 (1999).
4. J. C. S. Chang and Z. Guo, Characterization of organic emissions from a wood finishing product wood stain, Indoor Air, 2, 146-153 (1992).
5. C. Wilkes, M. Koontz, M.. Ryan, and C. Cinalli, Estimation of emission profiles for interior latex paints, Proceedings of Indoor Air’96, Nagoya, Japan (1996).
6. J. S. Zhang, C. Y. Shaw, J. M. Kanabus-Kaminska, R. A. MacDonald, R. J. Magee, E. Lusztyk and H. J. Weichert, Study of air velocity and turbulence effects on organic compound emissions from building materials/furnishings using a new small test chamber,
Characterizing Sources of Indoor Air Pollution and Related Sink Effects, ASTM STP 1287,
Bruce A. Tichenor (ed.), American Society of Testing and Materials, Philadelphia, 184-199 (1996).
7. Z. Guo and B. A. Tichenor, Fundamental mass transfer models applied to evaluating the emissions of vapor-phase organics from interior architectural coatings, Proceedings of
EPA/AWMA Symposium, Durham, NC (1992).
8. X. Yang, Q. Chen and J. S. Zhang Impact of early stage incomplete mixing on estimating VOC emissions in small test chambers, Indoor Air, 8, 180-189 (1998).
9. L. E. Sparks, Z. Guo, Z., J. C. S. Chang and B. A. Tichenor, Volatile organic compound emissions from latex paint – Part 1 chamber experiments and source model development,
Indoor Air, 9, 10-17 (1999).
11. N. E. Wijeysundera, B. F. Zheng, M. Iqbal and E. G. Hauptmann, Numerical simulation of the transient moisture transfer through porous insulation, Int. J. Heat Mass Transfer, 39, 995-1004 (1996).
12. C. Chirife, Fundamentals of the drying mechanism during air dehydration of foods, Advances
in Drying (A.S. Mujumdar ed.), 2, 73-80, Hemisphere, Washington DC (1983).
13. P. Chen and C. T. Pei, A mathematical model of drying processes. Int. J. Heat Mass
Transfer, 32, 297-310 (1989).
14. J. Crank and G. S. Park (Eds), Diffusion in polymers, Academic Press, London (1968).
15. S. Glasstone, K. J. Laider and H. Eyring, The Theory of Rate Processes, McGraw-Hill Book Company, Inc., New York (1941).
16. R. M. Barrer, J. Phys. Chem., Wash. 61, 178 (1957).
17. G. J. van Amerongen, J. Polym. Sci., 5, 307 (1950).
19. J. J. Chen and J. D. Lin, Simultaneous heat and mass transfer in polymer solutions exposed to intermittent infrared radiation heating, Numerical Heat Transfer, Part A, 33, 851-873 (1998).
20. R. C. Reid, J. M. Prausnitz and T. K. Sherwood, The Properties of Gases and Liquids, McGraw-Hill Book Company (1977).
21. A. D. Schwope, W. J. Lyman and R. C. Reid, Methods for assessing exposure to chemical substances, Vol. 11: Methodology for estimating the migration of additives and impurities
from polymetric materials, U.S. Environmental Protection Agency, Office of Toxic Substances, Washington, DC, EPA/560/5-85-015 (1989).
22. X. Yang, Study of building material emissions and indoor air quality, Ph.D. Thesis, Massachusetts Institute of Technology, Cambridge, MA (1999).
23. X. Yang and Q. Chen, A model for numerical simulation of VOC sorption by building materials, Proceedings of the 8th International Conference on Indoor Air Quality & Climate, Indoor Air '99, August 8-13, Edinburgh, Scotland (1999).
24. M. M. Clark, Transport Modeling for Environmental Engineers and Scientists, John Wiley & Sons, New York (1997).
25. X. Yuan, Q. Chen, L. R. Glicksman, Y. Hu, and X. Yang, Measurements and computations of room airflow with displacement ventilation, ASHRAE Transactions, 105(1), 340 – 352 (1999).
26. G. H. Hart and D. Int-Hout, The performance of a continuous linear air diffuser in the perimeter zone of an office environment, ASHRAE Transactions, 86(2), 107-124 (1980).
27. J. S. Zhang, C. Y. Shaw, L. C. Nguyen-Thi, R. A. Macdonald and G. Kerr, G., Field measurements of boundary layer flows in ventilated rooms, ASHRAE Transactions, 101(2) (1995).
28. CHAM, PHOENICS Version 2.1, CHAM Ltd, UK (1996).
29. Z. Guo, L. E. Sparks, B. A. Tichenor and J. Chang, Predicting the emissions of individual VOCs from petroleum-based indoor coatings, Atmospheric Environment (in Press).
30. L. E. Sparks, B. A. Tichenor, J. Chang and Z. Guo, Gas-phase mass transfer model for predicting volatile organic compound (VOC) emission rates from indoor pollutant sources,
Table 1: Physical properties of wood stain applied to oak substrates (23.5 °C)
Property Symbol (unit) TVOC
a
Liquid density ρl (mg/m3) 8.18×10⁸
b
Initial VOC concentration in liquid Cl,0 (mg/m3) 6.9092×10⁸ c
VOC vapor pressure Ca,0 (mg/m3) 17131.7
d
Partition coefficient Kma (-) 40330
e
Liquid expansion factor in substrate α (-) 1.33
f
Initial VOC concentration in film Cm,0 (mg/m3) 5.195×10⁸ g
VOC Schmidt number Sc (-) 2.6
h
Initial VOC diffusivity in film Dm,0 (m2/s) 1×10-11
h
VOC diffusivity in substrate Ds (m2/s) 1×10-14
a
Lab measurement using electronic balance
b
Lab measurement using glass substrates
c
Headspace analysis
d K
ma = Cl,0/Ca,0 e
Obtained by using the VB model for the initial period (0 - 0.2 h) and comparing the calculated initial emission rate with the small-scale chamber data (reference case)
f
Cm,0 = Cl,0/α g
Sparks et al. [30]
h
Obtained by matching the simulated emission rates with the small-scale chamber data (reference case)
Table 2 Values of partition coefficient (Kma) and diffusion coefficients (Dm,0 and Ds) for wood
stain(TVOC) under different temperatures. Properties Temperature (°°°°C) Kma Dm,0 (m2/s) Ds (m2/s) 20.5 49112 0.87×10⁻¹¹ 0.87×10⁻¹⁴ 23.5 40330 1×10-11 1×10-14 27.5 31953 1.18×10⁻¹¹ 1.18×10⁻¹⁴ 31.5 25476 1.38×10⁻¹¹ 1.38×10⁻¹⁴
Figures and Graphics
Figure 1 Schematic representation of the emission mechanisms of a “wet” material embedded in
a porous substrate. (a) = evaporation; (b) = movement of free and bound VOCs; (c) = vapor flow; (d) = diffusion to substrate.
Figure 2 Description of VOC sorption by the substrate and VOC boundary conditions.
Material film
Film-substrate interface Eqs. (18) and (19) Substrate
Air Film-air interface, Eq. (17)
Other side of substrate, Eq. (20) a d
P
P
o
o
r
r
e
e
b c
S
S
o
o
l
l
i
i
d
d
“
“
W
W
e
e
t
t
”
”
c
c
o
o
a
a
t
t
i
i
n
n
g
g
q(τn) Cms(τn)Figure 3 The small-scale chamber for emission measurements.
Figure 4 Predicted velocity vectors in the small-scale chamber.
Figure 5 Simulated velocity distribution above the material in the inner chamber of the small-scale chamber, h = 0.08 m (inner chamber height).
0.001 0.01 0.1 1 10 0 4 8 12 16 20 24 Elapsed time (h) Emis s ion rat e (g/ h ) Data VB model Numerical model
Figure 6 Comparison of measured and simulated TVOC emission rates from wood stain in the
small-scale chamber. 0.0 0.2 0.4 0.6 0.8 1.0 0.00 0.04 0.08 0.12 0.16 Velocity (m/s)
Figure 7 Predicted percentages of TVOC mass emitted from the material, diffused from the film to the substrate, and left in the material film.
Figure 8 Predicted TVOC distributions in the material film (y/delta (δ) < 1), material-air
interface (y/ δ =1), and the air phase boundary layer (y/ δ >1).
0 20 40 60 80 100 0 4 8 12 16 20 24 Elapsed time (h) Re la ti ve Ma ss ( % ) Emited Substrate Film 0.01 0.1 1 10 100 1000
1.E-08 1.E-06 1.E-04 1.E-02 1.E+00
C/Cm,0 y /delt a 15 min 1 hour 5 hour 10 hour 24 hour
0.001 0.01 0.1 1 10 0 4 8 12 16 20 24 Elapsed time (h) E m issi o n r a te ( g /h ) DataVB model Numerical model 0.001 0.01 0.1 1 10 0 4 8 12 16 20 24 Elapsed time (h) Emis s io n ra te (g /h ) Data VB model Numerical model 0.001 0.01 0.1 1 10 0 4 8 12 16 20 24 Elapsed time (h) Emissio n r a te ( g /h ) Data VB model Numerical model
Figure 9 Comparison of measured and simulated TVOC emission rates of wood stain under
different temperatures: (a) 20.5 °C, (b) 27.5 °C, (c) 31.5 °C.
(a)
(b)