Business Strategy of Nucleic Acid Memory
for Digital Information Storage
By
Ryan de Ridder
M.S. Mathematics (2008) University of Virginia
B.A. Mathematics & Physics (2007) University of Virginia
MIASSACHUTT ILNSTITUTE OF TECHNOLOGY
MAR 3
0
2017
LIBRARIES
ARCIVES
Submitted to the System Design & Management Program In Partial Fulfillment of the Requirements for the Degree of
Master of Science in Engineering & Management
at the
Massachusetts Institute of Technology
February 2017
C 2017 Ryan de Ridder. All Rights Reserved
The author hereby grants to MIT permission to reproduce and to distribute publicly, paper and electronic copies of this thesis document, in whole or in part, in
a iy,,dium now known or hereafter created.
Written by
Signature redacted
Ryan de Ridder MIT System Design & Management Program January 20, 2017
Certified by
Signature redacted
Accepted by
MIT Sloan
Signature
Al~ke ndra Iacifeczyk Thesis dvisor Shokl of Man gement
redacted
Warren Seetmg Weber-Shaughness Professor of Mechanical Engindering
Business Strategy of Nucleic Acid Memory
for Digital Information Storage
by
Ryan de Ridder
Submitted to the System Design & Management Program
on January 20, 2017 in Partial Fulfillment of the Requirements for the Degree of Master of Science in Engineering & Management
Abstract
Nucleic acid memory (NAM) is the storage of digital data by encoding the information into the medium of nucleic acids. This is often called DNA storage, as typically, but not necessarily, the information is stored in the nucleobases that comprise DNA. Baum first introduced this idea in
1995, but it wasn't until 2012 that Church proved the idea on a larger scale. NAM has a number
of features that make it very promising as a data storage medium. The three typically highlighted are capacity density, data retention (i.e., durability), and energy usage.
NAM should enter the data storage market, as a hardware product, through the ~$4.5B
archiving market, by targeting large storage service providers and large data-intensive corporations with on-premise operations. A NAM product has the potential to reduce the capital and operational cost base of these companies, by millions of dollars per year. An architecture strategy should be employed to enter the market, relying on control over underlying ideas and partnerships to barricade the company from competition.
NAM is a decade away from commercialization, making this a very risky early stage venture.
The costs need to come down at least 100,000-fold before the technology is cost competitive with current solutions. Additionally, there are a number of scientific and engineering issues that need to be carefully resolved. Due to the risks, the only viable funding source is government grants. If early stage funding were secured, IP should be developed in the core NAM technology of storage and access and an interim revenue source established. This would allow the
company a strong chance to thrive in the competitive storage industry, if and when NAM becomes cost competitive.
Thesis Supervisor: Aleksandra Kacperczyk
Table of Contents
ABSTRACT ... 3 TABLE OF CONTENTS ... 5 TABLE OF FIGURES ... 7 DATA STORAGE ... 9 D A TA T YPES ... 9 STO RA G E A TTRIBUTES ... 10 STORAGE TERMINOLOGY ... 11 STORAGETECHNOLOGY ... 13 STORAGE MARKET ... is STO RA G E D EM A N D ... 16 M A R KET S IZE ... 1 7 A RCH IV ING M A RKET ... 20IN D USTRY D YNA M ICS ... 2 2 NUCLEIC ACID M EM ORY ... 25
P RO C ESS ... 2 6 F EA T U R ES ... 3 3 ISS U ES ... 3 7 O U T LO O K ... 3 8 NAM STRATEGY ... 39 FRA M EW O R K ... 3 9 M A R K ET ... 4 3 C U STO M ER ... 4 4 C O M PET IT IO N ... 4 7 V A LU E C REATIO N ... 5 0 F U N D IN G ... 5 4 R ISKS ... 5 6 CONCLUSION ... 57 APPENDIX ... 58
STORAGE HARDWARE PROVIDERS ... 58
STORAGE SERVICE PROVIDERS ... 59
ARCHIVING MARKET PLAYERS ... 59
IN T ERV IEW S ... 6 0
Table of Figures
FIGURE 1: KEY DIFFERENCES BETW EEN ARCHIVAL AND BACKUP ... 10
FIGURE 2: TIER TERMINOLOGY...12
FIGURE 3: TERMINOLOGY RELATIONSHIP ... 13
FIGURE 4: HARD DISK DRIVE (HDD)...14
FIGURE 5: DIGITAL VIDEO DISC (DVD)...14
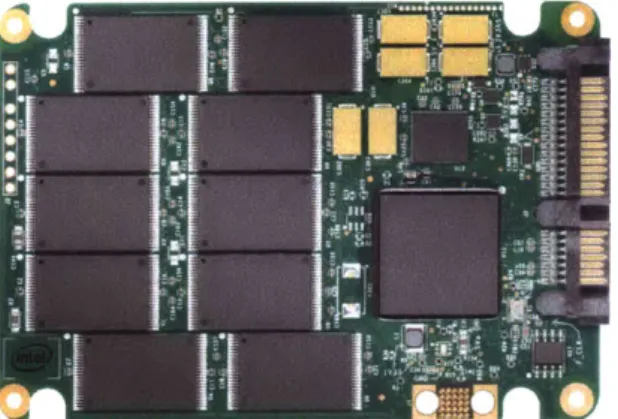
FIGURE 6: SOLID STATE DRIVE (SSD)...15
FIGURE 7: GLOBAL M EMORY DEMAND SOURCES ... 16
FIGURE 8: GLOBAL M EMORY DEMAND ... 17
FIGURE 9: W ORLDW IDE IT M ARKET'...18
FIGURE 10: W ORLDW IDE CLOUD IT INFRASTRUCTURE M ARKET FORECAST BY DEVELOPMENT TYPE ... 19
FIGURE 11: W ORLDW IDE ENTERPRISE STORAGE M ARKET ... 19
FIGURE 12: W ORLDW IDE ENTERPRISE STORAGE SYSTEMS REVENUE, BY VENDOR ... 20
FIGURE 13: W ORLDW IDE INFORMATION ARCHIVING REVENUE PROJECTIONS ... 21
FIGURE 14: COMPARISON OF HARDWARE PROVIDER AND CLOUD SERVICE PROVIDER ... 22
FIGUR E 15: VALUE CURVE COMPARISON ... 23
FIGURE 16: DATA STORAGE COMPLAINTS AND CHALLENGES ... 24
FIGURE 17: DATA STORAGE INDUSTRY OVERVIEW ... 25
FIGURE 18: HIGH LEVEL NA M SYSTEM ... 26
FIGURE 19: NAM W RITING AND READING PROCESS DECOMPOSITION...27
FIGURE 20: HIGH LEVEL NAM PROCESS...27
FIGURE 21: ROTATING TERNARY SCHEME ... 28
FIGURE 22: ENCODING PROCESS DECOMPOSITION ... 28
FIGURE 23: ATCG BLOCK REPRESENTATION ... 29
FIGURE 24: ACCESS PROCESS DECOMPOSITION...31
FIGURE 25: COST PER M EGABASE OF DNA SEQUENCING...32
FIGURE 26: PROCESS DIAGRAM ... 33
FIGURE 27: COMPARISON OF STANDARD M EMORY TECHNOLOGIES TO CELLULAR DNA ATTRIBUTES'... 34
FIGURE 28: TECHNOLOGY AREAL DENSITY INCREASES & TIMESCALES... 35
FIGURE 29: M EMORY-RETENTION TIMES FOR DNA IN AIR AND W ATER ... 35
FIGUR E 30: INNOVATION S-CURVE ... 38
FIGURE 31: FOUR ENTREPRENEURIAL STRATEGIES ... 40
FIGURE 32: ARCHITECTURE VERSUS DISRUPTION ... 41
FIGURE 34: NAM COMPETITIVE LANDSCAPE IN A PORTER'S FIVE FORCES FRAMEWORK ... 48
FIGURE 35: NAM COMPETITOR ENTRY LIKELIHOOD ... 49
FIGURE 36: NA M PRODUCT ... 49
FIGURE 37: TIMESCALES FOR W HICH NAM IS COST-EFFECTIVE ... 52
Data Storage
Computer data storage is the technology of recording digital data in some medium in order to preserve the information. These storage mediums are often discussed and compared across various attributes that describe capability and measure performance. Because of the varying attributes the different storage mediums and technologies are used for unique storage needs. These use cases are described by industry specific terminology, including online, offline, tier, and temperature. The main technologies currently filling the storage requirements are solid state drives, hard disk drives, magnetic tape, and optical discs.
Data Types
Data is prevalent throughout the modern world. It is pervasive in personal lives, research organizations, government agencies, and corporations and is used for countless purposes. For data management, though, there are only three fundamental purposes.
* Production data is the primary data an organization uses for daily processes and
operations. This essential data is served to clients and users, and must be readily available for frequent and rapid access.
" Backup data is a copy of all or part of the production data that is used for recovery
purposes. Backups are typically short term as they reflect consistently changing production data.
* Archive data is primary data that is no longer needed for production purposes and so
has been placed in long-term storage for retrieval when and if necessary.
Production data is the backbone type, and is the source of the other types. Backup data is a copy of some or all of the production data. Archive data is yesterday's production data that is stored for posterity. Often backup and archive are conflated, so Figure 1' displays some of the key differences. In short, archival data is primary information that is rarely accessed and backup data is a copy of primary information used for recovery.
Figure 1: Key differences between archival and backup
Archive Backup
Primary information Copy of information Used for compliance and efficiency: Used for recovery:
data retained in original form - improves availability, allowing enables response to legal or applications to be restored to a regulatory action point in time
offloads information from production systems and storage
Typically long-term: Typically short-term:
- months, years or even decades - days or weeks
Storage Attributes
Regardless of the data's purpose, all storage technologies are described through the following attributes2 (ordered alphabetically). Generally, these attributes either describe a technical
capability (accessibility, addressability, capacity, mutability, and volatility) or a performance measure. A technology's attributes determine what use cases it may fulfill.
" Accessibility
o Random access storage allows for any location to be accessed at any moment in roughly the same amount of time.
o Sequential access storage only allows for access in sequence. " Addressability
o Location-addressable storage means each accessible unit of information is selected with its numerical memory address.
o File-addressable storage means the information is divided into files that are
selected through human-readable directories.
o Content-addressable storage means each accessible unit of information is
selected based on the contents stored therein.
" Capacity
o Raw capacity refers to the total number of bits or bytes that a medium can hold.
o Storage density is the capacity divided by the unit of length, area or volume.
" Mutability
o Read/write storage or mutable storage can be overwritten at any time.
o Write once read many (WORM) storage or immutable storage allows one write. o Slow write, fast read storage is mutable, but write is much slower than read.
* Performance
o Latency is the time it takes to access a particular storage location.
o Throughput is the rate at which data can be read from or written to storage. o Granularity is the size of the largest chunk of data that can be accessed
efficiently without introducing additional latency.
o Reliability is the probability of a spontaneous bit value change. o Energy use is the amount of energy used to store the information.
* Volatility
o Volatile storage requires power to maintain the stored information. Typically, RAM (random access memory) is volatile.
o Non-volatile storage retains the stored information even if not powered. Flash, hard disks and tape are all non-volatile.
Storage Terminology
The industry uses various sets of related terminology, often loosely, leading to confusion. The following terms are not a comprehensive list of terminology used, but cover the basic
components of the vernacular. The terms online, nearline and offline3 generally refer to how
quickly the data is accessible.
* Online storage is data storage that is immediately available for input and output. * Nearline storage is not immediately available, but can be made online without human
intervention.
* Offline storage is not immediately available, and requires some human intervention to
become online (typically used for backup and archival).
Similarly, primary, secondary, tertiary and offline4 refer to the hierarchical "proximity" to the
CPU and how the data is accessed, as opposed to how quickly.
" Primary storage is the only type of storage directly accessible to the CPU. It is often
volatile RAM. Access speeds are typically measured in billionths of a second.
* Secondary storage is not directly accessible by the CPU. It is non-volatile storage, often stored on hard disks. Access speeds are typically measured in thousands of a second.
" Tertiary storage typically involves robotic mechanisms to access the data. It is non-volatile storage, often stored on hard disks or tape. Access speeds are measured in seconds or longer.
" Offline storage5 requires some human intervention for data to become accessible. It is non-volatile storage, typically used for backup and archival.
The data storage tier refers to the use-case-dependent, performance requirements of the data. Unfortunately, there is no definitional standard for tiers. In fact, there is not even an agreement regarding the number of tiers, with some sources defining Tier 1-Tier 3 and other sources broadening to Tier 0 - Tier 5. The terminology discussed in Figure 2 takes a middle ground, with a total of five tiers, to allow for sufficient segmentation across performance and cost.
Figure 2: Tier Terminology6
Tier Use Case Example Technology Key Metric
Tier 0 Storage of extremely time Financial - SSD - lops
/ $
sensitive, high value, transactions volatile information
, Tier 1 Storage of data used for Online retail - HDD * lOPS
business operations * GBs 0
E
Tier 2 Storage of data where Email HDD *
$/
TBspeed is not imperative Tape
Tier 3 Storage of infrequently Historical - MAID - $/TB
/
accessed data financials * Tape Watt
Tier 4 Storage of data that has Long-term Tape *$/GB/
been archived archival - Optical Watt
4 "Computer Data Storage."
s Note, offline is used in two ways but means the same thing in both situations.
Other common terminology includes "hot" and "cold" data, which refers to how often the data is accessed. Again, there are no standardized definitions, but hot data is accessed the most frequently and cold data the least. In between the extremes are "warm" and "cool" data. These four sets of terms are not identical in meaning, however they are related, as shown in Figure 3.
Figure 3: Terminology Relationship
Primary Tier 0 Online
Secondary Tier 1
Tier 2
Nearline Tertiary Tier 3
Tier 4
Offline Offline T 4
Storage Technology
The main storage technologies have each been around for at least three decades. Computer data storage, in the form of magnetic tape, was first patented in 1928. Nearly thirty years later, in 1956, hard disk drives were introduced by IBM,7 who then invented DRAM (dynamic random access memory) in 1966.8 Also in 1966, the first patent for compact discs was filed. Then in 1984, Toshiba introduced flash memory to the market.9 Since introduction, these technologies have seen continuous improvement in performance and capacity, and today are still the main storage technologies.
Magnetic memoryl stores data by writing non-volatile patterns in a magnetized medium. Magnetic tape (an example is cassette tapes), floppy disks, and hard disks are all examples of magnetic memory. The read and write operations are performed by a read-write head that detects and modifies the magnetism of the material. In order to read or write the medium must be spun to provide full access to storage locations. In addition to this sequential accessibility,
"Hard Disk Drive."
8 "Dynamic Random-Access Memory."
9 "Flash Memory."
the characteristics of non-volatility and high density make this medium well suited for secondary and tertiary storage.
Figure 4: Hard Disk Drive (HDD)"
Similar to magnetic memory, optical memory12 stores data by writing non-volatile patterns on a medium that can be read via light. CDs, DVDs and Blu-rays are all examples of optical memory. The read and write operations are performed by a read-write head that uses laser to etch and detect bumps in the material surface. In order to read or write the medium must be spun to provide full access to storage locations, which allows sequential access. Typically, the medium is used for tertiary and offline storage.
Figure 5: Digital Video Disc (DVD)1
Semiconductor memory14 stores data in electronic integrated circuits on semiconductor
materials. All solid-state storage, including flash memory and DRAM, are examples of
11 https://en.wikipedia.org/wiki/Magnetic-storage#/media/FiIe:Laptop-hard-drive-exposed.jpg
12 "Optical Storage."
13 https://en.wikipedia.org/wiki/DVD#/media/File:DVD-Videobottom-side.jpg
semiconductor memory. The read and write operations are performed electronically, meaning there are no moving parts and all semiconductor memory has the feature of random access (i.e., all classify as RAM). Typically, this type of memory is volatile, however, flash memory (NVRAM) is an example of non-volatile memory. This type of memory is ideal for primary storage (in fact RAM is nearly synonymous with primary storage), but non-volatile semiconductor memory is also used as secondary storage.
Figure 6: Solid State Drive (SSD)'5
There are a number of technologies that offer promising storage breakthroughs. In the near term, 3D XPoint (a phase-change memory) is in development by Intel and Micron with claims of much lower latency and much faster throughput all with less energy usage. Another technology that has been in development for decades is holographic memory, which, if realized, promises higher density and throughputs than magnetic or optical. More extreme, research is also being performed to store data at the atomic level, a bit per atom, leading to very dense data
storage.1 6 These technologies, alongside numerous others, aim to provide performance or density increases over current technologies.
Storage Market
Worldwide demand for data storage has been growing exponentially and is expected to continue into the foreseeable future. This is a healthy indicator for an already massive -$3.5
trillion worldwide IT market. Within the overall IT market the worldwide enterprise storage
is https://serversp.com.br/wp-content/uploads/2014/09/SSD.jpg
market is -$90 billion, with nearly a third of that dedicated to storage systems. Within the broader storage market, the archival market itself is ~$5 billion and growing. Recently, the data storage market, alongside the broader IT market, has undergone a massive disruption with the introduction of IT as a Service (ITaaS). This new business model offers customers a different way to manage IT requirements and continues to change the landscape of the market.
Storage Demand
Worldwide demand for data storage has been growing exponentially, at a pace that is more than doubling every two years, as shown in Figure 7. Recently, social networks, mobile computing and video consumption have fueled this growth. With these trends enduring, and the looming data explosion from virtual reality and the internet of things, analysts and experts expect this growth to continue, estimating global demand reaching ~40 zettabytes'7 (ZBs) by 2020. As an example of the magnitude of a zettabyte; if a gigabyte was a 1-inch cube, then a single zettabyte would fill more than 5 Empire State buildings.
Figure 7: Global Memory Demand Sources
Historic Data Source Projection CAGR Imputed
Source Study Pub. (ZB) (ZB) (ZB) Notes
Year 2007 2009 2010 2012 2013 2020 2030 2040 CAGR 2040 IDC A 2010 0.8 1.2 35 45% 63E3 IDC B 2012 2.8 40 46% 80E3 IDC C 2014 4.4 44 47% 95E3 Zhi-Wei Xu D 2014 0.3 140 32% 2E3
CAGR uses 2010 data point
Church et al. E 2016 375 22% from StudyA cited by Church
CAGR uses 2010 data point
Church et al. E 2016 8.75E6 72% from Study A cited by Church
Study A: "The Digital Universe Decade -Are You Ready?", IDC, 2010
Study B: "The Digital Universe in 2020: Big Data, Bigger Digital Shadows, and Biggest Growth in the Far East", IDC, 2012 Study C: "The Digital Universe of Opportunities", IDC, 2014
Study D: "Cloud-Sea Computing Systems: Towards Thousand-Fold Improvement in Performance per Watt for the Coming Zettabyte Era", Zhi-Wei Xu, 2014 Study E: "Nucleic Acid Memory", Church etal., 2016
While 40 ZBs is huge, if the digital universe continues to double roughly every two years then 2040 will see an enormous demand of 27,000 ZBs (27 YBs), as seen in Figure 8. Perhaps unsurprisingly, the worldwide installed storage capacity has not kept pace with this data
1 A bit is a single binary unit. A byte is 8 bits, and is the number of bits needed to represent letters. A kilobyte (kB) is 10A3 bytes. Following a kB and growing by 10A3 with each succession is megabyte (MB, 10A6), gigabyte (GB, 10A), terabyte (TB, 10A12), petabyte (PB, OA15), exabyte (EB, 1OA18), zettabyte (ZB, 10A21), and yottabyte (YB, 10A24).
proliferation, so, much of the generated data cannot be retained. Alarmingly, analysts and experts do not expect this situation will self-correct, and even forecast a widening gap.1 8 This gap identifies a potential hole in the market capabilities.
Figure 8: Global Memory Demand
e -n 100,000,000 10,000,000 A 8,750,0 1,000,000 100,000 095,000 - - c,~%oG *.- 27,000 10,000 2,000 6 0 2,000 1,000-37 ~~A~dI' 8 -t"@375 100' 44140'_---358 10 44-0.3 0.81.2 0 -__ -_ -_ _ 2005 2010 2015 2020 2025 2030 2035 2040 Year
0 Historic Data * Projected ..-.-- Exponential Trendline
0
2045
---- CAGR Bounds
Market Size
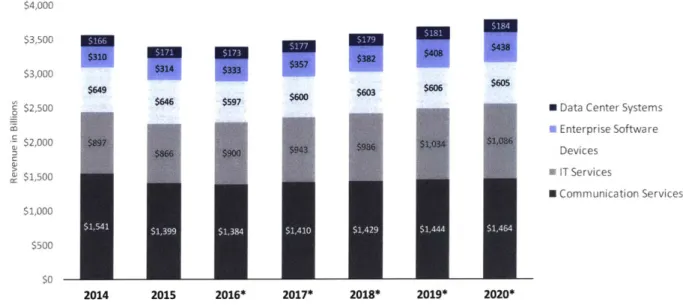
The worldwide IT market is massive, estimated to be -$3.5 trillion in 2016. The market is subdivided into Communication Services, IT Services, Devices, Enterprise Software, and Data Center Systems,1 9 as shown in Figure 9. Data storage technologies fit into both the categories of Devices and Data Center Systems. However, data storage technologies are only a very small piece of the Devices category, and the category is not a good fit for nucleic acid memory. For this reason, this paper will only consider the ~$170B data center system market.
1s "IDC-whereisstorageinfographic_243338.pdf." < http://www.idc.com/downloads/where is -storageinfographic_243338.pdf>; Bornholt et al., "A DNA-Based Archival Storage System."; Zhirnov et al., "Nucleic Acid Memory."
19 Segmentation definitions provided by Gartner as follows:
Communications services - Consumer fixed services, consumer mobile services, enterprise fixed services and enterprise mobile services IT services - Business IT services and IT product support
Enterprise software - Enterprise application software and infrastructure software Devices - PCs and tablets, mobile phones, and printers
Figure 9: Worldwide IT Market"", $4,000 $3,500 $10 - ---$310 $382 $408 $3 $3,000 $314 $333 $35$3 $408 $43 $646 $S97 $600
$2,500 $ Data Center Systems
U Enterprise Software . $2,000 $897 1034 0Devices $866 $9ev$1i3c$10s $> - IT Services c $1,500 $1,000 I ECommunicationServices $500 $0 2014 2015 2016* 2017* 2018* 2019* 2020*
An important macro-trend impacting the worldwide IT market is the shift towards cloud services. Cloud services include laaS (Infrastructure as a Service), PaaS (Platform as a Service), and SaaS (Software as a Service). Services include compute and storage, amongst myriad other services. Though many enterprises still prefer to keep their data on-premises (for security, performance, and regulatory reasons), recent years have seen cloud services beginning to supplant the traditional IT model, as seen in Figure 10. From a hardware provider's perspective, this trend is mostly bad news. Cloud providers attempt to optimize their infrastructure for higher utilization meaning overall the number of units required for the same need decreases, impacting number of units sold. Additionally, the aggregation of hardware buying means that cloud providers can apply more downward price pressure. These two things hit both units and prices, negatively impacting revenues and profits. However, as can be seen in Figure 9, there was healthy growth in the Data Center Systems segment between 2014 and 2015, and growth is expected to continue. This is at least partially due to the continued data (and computing) explosion as seen in Figure 8.
20 "Forecast Alert." <www.gartner.com/document/3471552>
Figure 10: Worldwide Cloud IT Infrastructure Market Forecast by Development Type2 11% 12% 2014 2015* 14% 15% 2016* 2017* 16% 17% 2018* 2019*
Regardless of the eventual landscape of cloud versus traditional, data center system hardware is required. Unfortunately, the Data Center Systems market is not solely dedicated to storage; importantly, it also includes servers. Figure 11 shows a slightly different segmentation of the IT market, presenting a picture of the ~$90B Enterprise Storage market, including all Systems, Services and Software. This provides a more accurate estimate of the total addressable market for storage. Within this market, storage hardware resides in the $37B Systems segment.
Figure 11: Worldwide Enterprise Storage Market2
$14 $30 $14 $32 2011 2012 $15 $34 2013 $16 $36 $16 $38 2014 2015
IDC Worldwide Quarterly Cloud IT Infrastructure Tracker Q2 2015
23 "Data Storage - Statista Dossier." Figure 12 and Figure 13 are also reproduced from the same source.
100% 90% 80% 70% 60% 50% 40% 30% 20% 10% 0% Private Cloud * Public Cloud 0 TraditionaI IT 0: co $100 $90 $80 $70 $60 $50 $40 $30 $20 $10 $0 $13 $29 Software * Services 0 Systems 2010 2
I-I
A few vendors dominate this storage systems market, as shown in Figure 12. EMC, HP, Dell, IBM
and NetApp make up ~60% of the market, with the newly merged Dell-EMC accounting for nearly 30% of the market and HP holding ~15% market share. Of note, is a trend in the market towards original design manufacturers (ODMs), which is mirrored in the server market. ODMs are also called "white-box storage", and carry the implications of low-cost and generic. One driver of this trend is that large cloud service providers are opting for ODM. Regardless, the
market has seen consistent growth, with a 5.4% CAGR over this time-period.
Figure 12: Worldwide Enterprise Storage Systems Revenue, by Vendor
$40,000 $35,000 $9,280 $10,693 $30,000 $7,633 $9,748 Others ! $25,000 $7,491 $4,074 $4557 ODM direct $3,054 U NetApp S$20,000 $,2 $4490 $4,786 $4,927 $4,164 $3,550 $2,727 4 IBM S$15,0009$ Dell $15,000 $ 5 $6 HP $10,000 $5,756 $5,801 $5,090 $5,127 $5,771 U EMC $5,452 $5,000f $00 2010 2011 2012 2013 2014 2015
Archiving Market
The archiving market includes products and solutions for maintaining legacy production data (such as email, documents, website content, and other structured data). Organizations typically archive important documents that need to be maintained but are only infrequently accessed. Cost gains are realized as the tier 4 technologies used for archiving (e.g. tape) trade-off performance characteristics for cheaper capital and operating expenses. Figure 13 shows five year projections for the global market, growing from $4.6B to $6.7B at a 10% CAGR. Assuming the splits seen in Figure 11, systems revenues account for ~40% of the market, yielding a ~$2B
2016 market for archival systems. Historically, archival solutions were implemented by highly
-J
has changed as organizations have noted the efficiency and cost gains of this type of data management.
Figure 13: Worldwide Information Archiving Revenue Projections
$8 $7 $6 c $5 S$3 $2 $ 1 $0 2016* 2017* 2018* 2019* 2020*
Gartner2 4 identifies three use cases for archives: historical archives, compliance archives, and analysis archives. Historical archives are retained as a record of business, housing content that can't be deleted for business reasons but is infrequently accessed. From a hardware
perspective, this type of archive requires very high data integrity. Compliance archives house data that is retained in order to comply with regulations or audit requirements, often
containing communications and business records. This type of archive demands high data integrity and low latency. Analysis archives contain high-volume non-production data that is frequently mined, analyzed and used for reporting. This type of archive requires low latency and high capacity. In addition to these type-dependent requirements, the longevity of the archives creates management challenges. Archive data is typically kept for more than ten years and often planned to be kept for up to one hundred years. This length means that the hardware will need to be refreshed multiple times through the period. Each migration of data represents costs as well as risks, which consumers are eager to avoid. As is seen in the broader data storage market, recent years have witnessed the industry trend to archival as a service.
Industry Dynamics
In recent years, there have been two massive changes in the data storage industry. Firstly, the cloud created a new business model for providers as well as customers. Secondly, performance has improved to a point that customers are beginning to lose interest in ever faster hardware. These changes have led to a commoditization of the data storage industry.
The cloud is gaining ground on traditional IT because it creates more value for the consumer. As shown in Figure 14, while hardware providers do enable storage capability (the primary need), they also levy onto the consumer a number of unintended costs, burdening operations. Cloud service providers, on the other hand, remove those costs from the consumer and replace them with a simple pay per use operating expense. Furthermore, cloud providers are able to increase the benefits to the consumer. Thus, creating more value to the consumer by removing
numerous cons while increasing the pros.
Figure 14: Comparison of Hardware Provider and Cloud Service Provider
Storage Provider Pros for Consumer Cons for Consumer Hardware Storage Capability Capital Expenses
- Hardware Purchases - Hardware Refreshes Operating Expenses - Hardware Mgmt - Energy expenses Administration - Technology Mgmt - Capacity Planning
Service Storage Capability Usage Expenses
On-Demand Capacity Contract Management
Software Functionality
Not only does the cloud service business model increase the value to the consumer but it also accrues value to the vendors. Firstly, due to scale and specialization, cloud providers are able to increase their purchasing power and decrease costs. Secondly, there are more axes on which to differentiate vendors. Vendors are able to offer different services based on pricing structures, performance agreements, and functionalities provided, and can more specifically target customer groups. For example, IBM has a strategy of focusing on building private clouds for
their enterprise customers, while Google has announced that it will focus on catering to
developers. This differentiation allows the vendors to compete on dimensions other than cost, which protects industry profits. Lastly, it helps address an issue with the industry as a whole, in that it increases switching costs and vendor lock-in: once a consumer is set up in one cloud it is costly to migrate to a new cloud. Traditionally, hardware refresh cycles create a natural break point where consumers can fairly easily switch vendors. Lowering costs and increasing
differentiation allow service providers to capture more value while higher switching costs allow the vendors to maintain that captured value.
Figure 15: Value Curve Comparison
Valuable to Consumers Valuable to Vendors Technical Capabilities Administrative Savings Industry Benefits
1140
-- Traditional IT -- Cloud Services
This change in business model is shown in the value curves comparison of Figure 15. Traditional IT reflects the model where hardware is sold to an IT shop which then services its consumers. This model allows maximization of performance and full control over security but sacrifices the
ability to easily scale, forces management over all aspects, and has recurring capital expenditures as well as operating expenses (e.g., power and FTE requirements). The cloud service curve reflects the benefits of manageability and scalability ease, with very low capital expenditures. This new value curve is very suggestive of changing customer needs.
Figure 16: Data Storage Complaints and Challenges2
s
Manageability (admin time and effort)
Performance (latency)
Scale (managing growth)
Capital expenses (reduce spend)
Operating expenses (reduce cost)
Cloud (changing business model) Security (data availability and safety)
Vendor lock-in (no freedom of choice)
Share of respondents ).0% 10.0% 20.0% 30.0% 40.0% 50.0% 60.0% 2!% 49% 46% w 50% 42% 40% 41% 41% 32% 28% 24% 2 1% 28% 16% 14%
Figure 16 shows the top industry challenges in 2015 and 2016. Customers are migrating to the cloud because it provides solutions for: manageability (1) by removing the complications of
managing and updating hardware; scale (3) by allowing for immediate capacity increases and decreases; capital expenses (4) by removing the necessity of purchasing and replacing
hardware; and operating expenses (5) by eliminating the need for personnel to manage the hardware. Similarly, the data shows customers beginning to move past earlier criticisms of the cloud, namely performance (2) degradation (due to data transmission) and security (7)
concerns. Whether this ranking of challenges is the cause or the effect of cloud migration is not clear, but either way it shows that traditional IT no longer best fulfills the customer need. The other major industry trend is also highlighted in Figure 16, customers are less concerned with performance. This is not an indication of the need for performance decreasing but rather that hardware capabilities are beginning to surpass the need: current performance is good enough. This is not to say that there are no use cases for faster performance, as automated stock trading will always be able to benefit from slightly faster performance. However, the typical enterprise consumer is seeing less benefit from incremental improvements in performance, so that the value is often not worth the cost.
25
,Global Challenges with Data Storage 2015-2016 | Statistic."
Move T1 'I, 2015 4 1 3 2 5 7 5 8 t 4 -Delta 10% -4% 2% 4% 3% -6% 2% 2016 1 2 3 4 5 6 7 8 E 2016 0 2015
From an industry standpoint, this is good for cloud service providers (whose business model will always innately suffer some performance degradation due to data transmission), and bad for hardware providers who have historically differentiated based on performance, as well as other attributes. Further compounding this differentiation issue is that cloud providers are mature IT departments, with very sophisticated technical expertise and purchasing units. This means that cloud providers are exceedingly aware of their technical requirements and determined to lower costs, which has led to the ODM direct trend identified in Figure 12.
Figure 17: Data Storage Industry Overview
ODMs / Suppliers New Entrants Customers
- ODMs Higher barriers to entry (domain expertise; economies of scale; capital requirements) Customers are traditionally Numerous startups each year enter the market with new technical solutions often trusting the supply hardware - Numerous startups in tangential markets (e.g., software, analysis, data management) hassle free cloud
providers service, private
- ODMs beginning and public
to sell to cloud Hardware Providers cloud Providers Performance is providers and - Market incumbents in traditional IT - An alternative to ownership becoming other end users Large competitors dominate market - Large competitors dominate market commoditized,
- Raw materials are - More than 100 providers Cloud providers are beginning to cut leading customers
commoditized but - Aggressive price competition with out hardware providers to care more for
must meet high slight product differentiation - Pay as you go and IT as a Service other issues quality standards , Cloud providers are both customers * Increases consumer's vendor lock-in - Little customer
as well as substitutes for end users - Increase vendor differentiation loyalty
Consumers that are opting for cloud services which abstract the hardware and separate the hardware provider from the consumer; cloud providers that are sophisticated hardware buyers; and performance capabilities that are moving beyond consumer needs have begun to
commoditize the storage hardware industry. This has led the storage hardware industry to compete more heavily on price, leading to further commoditization. So, despite the high barriers to entry that the storage hardware market exhibits, the hardware industry is difficult and likely to continue ceding ground to storage service providers.
Nucleic Acid Memory
Nucleic acid memory is the storage of data by encoding the information into the medium of nucleic acids. This is often called DNA storage, as typically, but not necessarily, the information is stored in the nucleobases that comprise DNA (deoxyribonucleic acid): adenine (A), thymine (T), cytosine (c), and guanine (G). For simplicity, the rest of this paper will assume DNA as the medium of choice for NAM, and will refer to DNA based NAM as DNAM. Baum first introduced
this idea in 1995,26 with early backing by Clelland in 199927 and Bancroft in 2001.2 The following decade saw experimental and theoretical advancements,29 but it wasn't until 2012
that Church30 proved the idea on a larger scale, when the book Regenisis was stored and recovered. Today, NAM is at a technology readiness level (TRL) two, the stage where practical applications of the underlying science can be developed, however remains economically
unrealistic for mass storage.
Process
At the highest level the system for DNA information storage is simple, as shown in Figure 18. 31
Figure 18: High Level NAM System
Digital Data
-- --- ----SystemBoundary
Writing
DNA Strands Storing
Reading
Digital Data
Digital information is written to DNA strands, which are stored, and then read back as digital information, when required. However, while accurate and immediately similar to other types of data storage processes, this simplistic representation does not provide enough detail into the writing and reading processes. The writing process should be decomposed into encoding and synthesizing, while the reading process should detail sequencing and decoding, as shown in Figure 19.
26 "Building an Associative Memory Vastly Larger Than the Brain on JSTOR."
27
Clelland, Risca, and Bancroft, "Hiding Messages in DNA Microdots."
28 Bancroft et al., "Long-Term Storage of Information in DNA."
2 Yim et al., "The Essential Component in DNA-Based Information Storage System."
3 Church, Gao, andj Kosuri, "Next-Generation Digital Information Storage in DNA."
3 This figure, and subsequent similar figures, uses Object Process Methodology (OPM) to depict the system. In the OPM ovals represent processes, and rectangles represents objects. Shadows represent physical instances, while a lack of shadow indicates informational instances.
Figure 19: NAM Writing and Reading Process Decomposition3 2
writing Requeing
Digita~l t DNA Strands
Binary Data
-Encoding Sequencing
Digital Digital
ATCG Blocks ATCG Blocks
Synthesizing - Decoding
DNA Strands Binrgit ta
Figure 20 shows this process as a linear progression of events. Firstly, the 0 and Is of any series
of binary digital data is translated to a series of A, T, C and Gs. Once this ATCG series has been
designed, it is written to a synthetic strand of DNA. This strand of DNA, containing the information, is then stored until the information needs to be accessed. The strand of DNA is then sequenced to determine the ATCG series. Finally, the series is decoded to translate the ATCGs into binary digital form. The past two decades have seen significant improvements in these areas, due to both concentrated research as well as market advancements.
Figure 20: High Level NAM Process
Writing Writing . Reading
Encoding Synthesizing Storng Sequencing
Translate binary data Write ATCG series into Store strands until Determine the ATCG to ATCG series physical DNA strands information accessed series of strand
Reading Decoding Translate from ATCG series to binary
Encoding33
Simply, the encoding process takes the digital binary data (a series of Os and Is) and translates that binary series into an ATCG series. For example, the series '11100001' could be translated into 'GCAT', via the quaternary map: 00->A, 01->T, 10->C, 11->G. This type of function results in
an immediate increase in density as the mapping utilizes the full base-4 potential of DNA. However, due to the current state of synthesis and sequencing technologies, this type of
32 In OPM the solid triangle indicates a decomposition, in this case, of a process into sub-processes.
mapping could lead to issues if a series of the same base letter were written, if a segment contained a homopolymer. For this reason, a rotating ternary scheme, similar to that shown in Figure 21, can be used to reduce the error potential.
Figure 21: Rotating Ternary Scheme3 4
a) Example Rotating Ternary Scheme b) Example Rotating Ternary Translation
Previous Nucleotide A T C G o . 0 T C G A t -C& 1 C G A T Lo is_ Information t r o
I
Binary series 01110100 101110010 101101111 Ternary series 11022 11020 110102
I
G A I T C ATCGseriesICATAG ITGAGA ICATGAI
In addition to this translation, the encoding process also includes data preparation, occurring prior to translation, as seen in Figure 22. This sub-process can include various types of
preparations. For example, a compression process might be applied to the data in order to reduce the number of required synthetic bases. Or preparation might include an encryption step to increase security. Another process that is likely to be included is data tagging, to allow for easier data manipulation. These preparation steps are optional and may in fact be
performed by the data owner before providing the data for storage.
Figure 22: Encoding Process Decomposition
Encoding Digital Binary Data -Preparing Prepared Digital Binary Data -- Translating Digital ATCG Series Designing Digital ATCG Blocks
The final step in the encoding process is designing ATCG blocks. Due to the current state of synthesis, there is a limit on the number of bases that can be synthesized into a strand of DNA, typically representing only kilobytes of information. Therefore, if a piece of information, larger than this limit, needs to be stored the ATCG series is broken down into blocks.3s Alongside the
information to be stored, each block must contain an address indicating its location in the ATCG series. Finally, these blocks can be tagged with other pieces of information to aid data retrieval.
In total, each block must be short enough that it can be synthesized into a strand of DNA, and the set of blocks must fully cover the information to be stored, as seen in Figure 23. Another function of this designing process is to increase storage reliability. For example, some schemes use a block cover with overlapping information segments,36 to provide data redundancy.
Another scheme, proposed by Bornholt,3 7 incorporates redundancy by taking the exclusive-or of two information payloads to form a third, so that any two of the three blocks can produce the third. The implicit trade-off in increasing reliability, in this way, is a reduction in data density, and generally, much of the designing process suffers the inevitable downside of decreasing data density. Future increases in both synthesis and sequencing technology will mitigate decreases in data density from designing.
Figure 23: ATCG Block Representation
ATCG Blocks
Information Address Tag(s)
-Y
A few hundred to a few thousand base pairs
Synthesizing
Synthesis is the transcribing of digital data into physical DNA strands. The market for synthetic oligonucleotides is maturing but most use cases are research oriented and so the industry has not yet experienced major growth or the resulting major breakthroughs. Currently, synthesis involves chemically building the strand, nucleotide by nucleotide, akin to printing. One such methodology creates numerous such strands in parallel, organized on a grid. To simplify, at
3S The design step is heavily dependent on the synthesis technology used.
3 Goldman et al., "Towards Practical, High-Capacity, Low-Maintenance Information Storage in Synthesized DNA."
each step a particular base is chosen, for example T. All strands for which T is not the next base required in the series are masked, leaving all T requiring strands unmasked. A solution of Ts is washed over the grid, allowing the T bases to bind where necessary. This is repeated for the next chosen base, in time growing the strands, base by base. Methods like these can grow millions of different oligonucleotides in parallel, however it is a costly and slow process.
Storing
Once the DNA strands have been synthesized they must be stored. Storage can be envisioned as a vast library of DNA pools, where each pool is contained within a vial and arranged
systematically for automated access. While this idea presents a framework for one potential solution, it is far from the only way in which storage could be accomplished. For example, on one extreme, all the data could be stored in the same DNA pool. Or, on the other extreme, each separate block of data could be attached to a specific physical location on a chip. Much work still needs to be done to ensure cost effectiveness, access efficiency, minimal cross-talk,38 and
memory retention. However, it is clear that storing the data in a cool and dry environment enables lasting memory retention, as seen in Figure 29.
Accessing
Accessing refers to the identification and retrieval of specific strands of DNA for reading, upon a data request event, as shown in Figure 24. This step was not represented in high level process maps because it is technically optional. It is possible to not access any one piece of information, but rather to sequence the entirety of the DNA pool in order to retrieve any information. This is, in fact, how many researchers currently perform retrieval. However, in order to
commercialize this technology, for efficiency and cost reasons, accessing specific pieces of information is vital.
Figure 24: Access Process Decomposition
DNA Strands
dentiefying Data Request
Identified
-DNA Strands
Retrieving Retrieved
DNA Strands
One way that has been proposed to access specific strands of DNA is through polymerase chain
reaction (PCR) .39 During the design phase of this method, the DNA strand is tagged with a
primer. When the data needs to be accessed an enzyme is released that targets the specific primer, and once found replicates the strand. This process can be repeated until a desired number of copies are created. Then the DNA pool is randomly sampled until the information is fully recovered. While this methodology does mean that the entire pool need not be
sequenced, it has a number of downsides. Firstly, with each successive data access the pool becomes further diluted with replicated data. Secondly, each access requires the consumption of a significant amount of raw materials. Lastly, as this relies on random sampling, the method is not precisely targeted and so not very efficient. Much work still needs to be done to identify an access method providing random access, low latency, information integrity, and cost effectiveness.
Sequencing
Sequencing is the process of determining the series of bases in a given DNA strand. Over the past 15 years, and since the Human Genome Project, the sequencing industry has witnessed massive growth and seen technological breakthroughs. This has resulted in a cost reduction of
100,000 - 1,000,000-fold in the past 15 years, as can be seen in Figure 25. With these
breakthroughs, the market size has grown to $4 billion and is expected to reach $10 billion over the next five years.4
Figure 25: Cost per Megabase of DNA Sequencing
There are numerous sequencing methods, but one common methodology uses a polymerase enzyme. Utilizing fluorescent nucleotides, the enzyme creates a complement of the DNA strand. This compliment can then be optically read as each nucleotide emits a different color.41 This methodology, alongside the others, can be error prone. In particular, due to the specificity of this technology, a series of the same base letter may not be correctly identified, e.g., two bases might be read as a single base. Typically, errors such as these are "designed" away and
mitigated by reading at depth, meaning sequencing the same strand multiple times, or
sequencing multiple copies of the same strand. These reliability and redundancy measures lead to high information validity.
Process Diagram
While this discussion abstracts away much of the technical detail inherent in the process, it provides a foundation of understanding for the NAM data storage process, as seen in Figure 26.
40 "Next Generation Sequencing (NGS) Market by Platforms & Application - 2021 1 MarketsandMarkets." 41 Bornholt et al., "A DNA-Based Archival Storage System."
Figure 26: Process Diagram Systern Bourca Encoding Bin~gitita > Preparing Prepared Digital Binary Data Translating Digital ATCG Series Designing Digital ATCG Blocks Synthesizing DNA Strands Storing Stored DNA Strands
Data Request >Identifying
Identified DNA Strands Retrieving Retrieved DNA Strands DigitalSequencing
Digital Binary ATCG Blocks Dcdn
Data Request Decdig
Aessing
Features
NAM has a number of features that make it very promising as a data storage medium. The
three that are typically highlighted are capacity density, data retention (i.e., durability), and energy usage. Figure 27 compares standard storage technologies to Cellular DNA, across these traits. While this represents a comparison to cellular activities, it shows the limits for DNAM are orders of magnitude better than standard technologies. In addition to these three traits, NAM has other enticing characteristics, such as non-volatility, manufacturing simplicity, and organic relevance (particularly DNAM).
Figure 27: Comparison of Standard Memory Technologies to Cellular DNA Attributes4'
Metric SDD (Flash) HDD Tape (LTO Gen 7) Cellular DNA
Volumetric density 1016 bit cm-3 1013 bit cm-3 > 1011 bit CM-3 Retention 10 years >10 years 15 -30 years
ON power ~ 0.01-0.04 W per GB -0.04 W per GB -0.005 W per GB
-Density
NAM is tremendously dense, in terms of capacity, for three reasons. Firstly, the medium itself is
extremely small: the diameter of a double-stranded DNA molecule is about 2 nanometers. Secondly, the medium is inherently volumetric, unlike other storage mediums, allowing for better utilization of space. Lastly, NAM is not restricted to binary: DNA has 4 bases so could be base-4, while theoretically other nucleic acids structures could contain 6 bases or more. These factors provide DNAM with a raw density of 109 GB/mm3,44 and NAM with an even greater potential density. If DNAM's density potential were realized, the global storage needs could fit into a truck-bed with room to spare.45 Undoubtedly, the technically achievable density will be less than the theoretical limits, but even achievable limits will be a vast improvement over standard technologies, as can be seen in Figure 27.
The increase in data storage density, seen in recent decades, has been one of the driving forces of the technological revolution. Following Moore's law (~40% / year), density has doubled roughly every two years, with a 1,000-fold increase occurring in roughly 20 years. However, recently that trend has not held because areal density limits are being reached, as shown in Figure 28. If these yearly improvement numbers were to continue (without further slowing) it would take between 23 and 42 years to see a 1,000-fold increase. To combat this, corporations are hoping to begin harnessing volumetric density to increase growth rates.46
42 Augmented from Zhirnov et al., "Nucleic Acid Memory."
43 LTO Gen 7 numbers from "Areal Density (Computer Storage).", "LTO-Drives-DS.pdf.", "Oracle StorageTek LTO Data Sheet - 033631.pdf."
44 Bornholt et al., "A DNA-Based Archival Storage System."
45
Zhirnov et al., "Nucleic Acid Memory."
46 "Tape HDD and NAND Landscape Version FINAL as of 04252011 - Tape-Hdd-and-Nand-Landscape-Version-Final-as-of-042520111.pdf."; "FontanaVolumetric Density Trends for Storage Components -- LOC 09222014.pdf."
Figure 28: Technology Areal Density Increases & Timescales47
Areal Density Increase Projected Years for (2008- 2013) 1000-fold Increase NAND 35% /year 23 years
LTOTape 28% /year 28 years
Optical BD 18% /-year 42 years HDD 18% / year 42 years
Durability
NAM is also very durable in that it can retain information for long periods of time, as is
evidenced by humans collecting and sequencing DNA from ancient fossils. In nature DNA is impacted by mutation, pH, radiation, and mechanical forces amongst other considerations, however many of these issues will be controlled in NAM storage, creating a much more durable medium. This retention capability is especially potent when the NAM is kept in cool dry places, as seen in Figure 29.
Figure 29: Memory-Retention Times for DNA in Air and Water4
1010 In air In water - Deamination -101 10. 105 103-1. 0.1 0.01 -- --- - --- -- - ---10 0 10 20 30 40 50 60 70 80 90 Temperature (0C) Energy
While the Cellular DNA energy consumption is miniscule, as seen in Figure 27, in practice NAM is not likely to achieve these promises. During storage, the NAM energy consumption
47 "FontanaVolumetric Density Trends for Storage Components - LOC 09222014.pdf."
requirements will be exceedingly small, but implementations of NAM will very likely involve mechanical and biochemical sub-processes during writing, accessing, and reading, which will greatly increase energy consumption. These NAM implementations will likely be similar to tape
or MAID libraries, where nearly all energy consumption occurs during write, access and read processes. So, for purposes of this paper, it will be assumed that the energy requirements per GB are similar to competitive technologies. Despite this assumption, there are still energy
savings. A NAM implementation will consume less energy than other technologies due to the density of the medium, which will allow for massive physical space savings, thereby reducing the facility's power consumption to near zero. Since this is a derivative of the density, it will be
assumed as a benefit of the density.
Other
NAM possesses other innate characteristics that make it enticing for memory storage. Firstly, NAM is non-volatile, it will maintain the stored information even without power. This is one of
the factors that reduces NAM energy consumption, once the information has been written the energy supply can be drastically reduced. Additionally, it provides for information security through potential disaster scenarios. Secondly, while the read and write processes are
intensive, the manufacturing of raw memory capacity is simple and inexpensive, in that the bases required for memory can be efficiently produced. This is not the case for standard technologies, where the costs are mainly related to precise capacity manufacturing. Thus,
capacity production can be quickly matched to meet capacity demand. Lastly, NAM, and especially DNAM, will remain relevant from a scientific, technological and societal perspective for centuries given the biological relevance of the material. Thus, it is unlikely that society will
lose the capability to read the information written to NAM, regardless of technological changes. Furthermore, a NAM system can be designed to harness other characteristics. NAM can be made to be a random-access memory. Researchers have used PCR to selectively amplify certain strands, information blocks, within a pool proving a RAM architecture. Undoubtedly, this RAM technique will be further improved and likely even eclipsed by other techniques. Additionally, NAM's reliability can be easily tweaked to the desired level of precision, which can be designed
into the schema in a number of ways (e.g., XOR encoding). A very simple example of this is to use the inherent capability of DNAM to self-replicate in order to create numerous copies of the information. Finally, NAM synthesis, access and sequencing processes can be made massively parallel, increasing throughput and access speeds.
Issues
NAM has been proven on a small scale in research laboratories and is beginning to attract
market interest, most noticeably from Microsoft.49 Currently, the main impediment to
commercialization is the cost associated with each additional write and read. Synthesis, in particular, is exceedingly expensive, costing ~$1,000 - ~$10,000 per MB.50 When comparing to
other technologies, like tape on the low-end (~$10 per TB) and SSD on the high-end (~$100 per TB), NAM synthesis alone (~$1,000,000,000 - ~$10,000,000,000 per TB) is prohibitively
expensive. Fortunately, the sequencing is not nearly as expensive at -$.1 - ~$1 per MB.50 This
drastic price difference is due to the benefits of the Human Genome Project and a healthy market. However, when scaled these costs are also prohibitive (~$100,000 - ~$1,000,000 per TB). While both of these technologies have been progressing at rates exceeding Moore's Law,5 1 there is still a lot of room for improvement. On the surface, this implies that costs will likely
need to drop by more than 10,000,000-fold in order for NAM to compete in the market. In addition to economic considerations, is the issue of write and read throughput, the time required to write and read. Once again, synthesis is the largest impediment. For example, assuming a 24-hour run can synthesize 1,000,000 strands, with 100 base pairs per strand, at 4
bits per nucleotide, means that it would take 20 days to turn around a GB, and 20,000 days which is roughly 55 years to synthesize a TB. Likewise, gains need to be made on sequencing throughput. For instance, the Complete Genomics NGS platform can sequence 3,000 giga-bases over 11 days.52 Assuming, again, the 4 bits per base, this is 12,000 gigabits or 1,500 GBs, which
4 Bornholt et al., "A DNA-Based Archival Storage System."
50
Zhirnov et al., "Nucleic Acid Memory."; Goldman et al., "Towards Practical, High-Capacity, Low-Maintenance Information Storage in Synthesized DNA."; Erlich and Zielinski, "Capacity-Approaching DNA Storage."
s1Zhirnov et al., "Nucleic Acid Memory."
translates to ~5 GB per hour. While neither of these examples account for potential efficiency gains from things like parallelization, they do show that improvements are needed here as well.
Outlook
NAM is a theoretically viable product, however at a TRL two is not close to commercialization.
Currently, NAM is still in the gestation period on the innovation S-curve (Figure 30). There is a lot of work that needs to be done to make NAM a feasible product. Most obviously, costs need to drop drastically. There is a lot of hope for this, in that costs have been dropping quickly in
recent years. More promising is that there is still a lot of maturity to be realized in the science of synthesis and sequencing. Additionally, there is a lot of automation that can and must be achieved in the technologies. And as the tangential markets grow, economies of scale and learning will be realized. Beyond costs, many of the details of the technology still need to be worked out. For example: What encoding will optimize density? How can strand length be extended to allow for more data per strand? How should the strands be stored to optimize for durability and efficiency? How can specific strands be efficiently accessed and retrieved from a large pool of strands? How can sequencing errors be overcome? The progress that must be made is overwhelming, but once achieved the technology holds great value.
Figure 30: Innovation S-Curve5 3
THE LFE TRAJECTORY OF A TECHNOLOGICAL REVOLUTION
NAM Strategy
In developing a strategy to bring nucleic acid memory technology to the market, it is important to discuss two distinct time periods. These time periods are prior to and after the point where
NAM becomes cost competitive with other storage technologies in the market. Prior to this
point NAM is not a viable market offering as a mainstream data storage product. That said, there may be other use cases for the underlying technology, and may even be a few extremely fringe customers for whom the features of NAM provide inherent value. After this point, NAM can enter the market as a data storage technology. This section mainly discusses the market entry strategy for after this point. Further, this section does not consider any strategies where a company could enter as tangential to NAM, for example as a software company that will
optimize NAM storage.
NAM should enter the data storage market through archiving, by targeting large storage service
providers and large data-intensive corporations with on-premise operations. These companies will gain the most value from a NAM product as it reduces their capital and operational cost base by millions of dollars per year. Since these companies depend on the valuable data to be housed by NAM it is unlikely that they will trust any new technology that is not finalized and proven. Therefore, a methodical and controlled entry is preferable to a quick, iterative
execution strategy. As NAM is an entirely new paradigm in data storage it will not be possible to enter the market by collaborating with established players. Instead it will be necessary to take a competitive stance and face the incumbents directly. Hence, an architecture strategy should be employed to enter the market, relying on control over underlying ideas and partnerships to barricade the company from competition.
Framework
MIT Professor of Management of Technology Scott Stern has developed an entrepreneurial framework54 to help startups determine how to create and capture value. His hypothesis is that there are four choices a founder must make. The founder must choose the technology, the
5