PSFC/JA-05-45
DIAGNOSTIC SYSTEMS ON ALCATOR
C-MOD
N.P.BASSE, A.DOMINGUEZ, E.M.EDLUND, C.L.FIORE, R.S.GRANETZ, A.E.HUBBARD, J.W.HUGHES, I.H.HUTCHINSON, J.H.IRBY, B.LABOMBARD, L.LIN, Y.LIN, B.LIPSCHULTZ, J.E.LIPTAC, E.S.MARMAR, D.A.MOSSESSIAN, R.R.PARKER, M.PORKOLAB, J.E.RICE, J.A.SNIPES, V.TANG, J.L.TERRY, S.M.WOLFE, S.J.WUKITCH, K.ZHUROVICH, R.V.BRAVENEC1, P.E.PHILLIPS1, W.L.ROWAN1, G.J.KRAMER2, G.SCHILLING2, S.D.SCOTT2, S.J.ZWEBEN2
December 2005
Plasma Science and Fusion Center Massachusetts Institute of Technology
Cambridge, MA 02139 USA
1
Fusion Research Center, University of Texas, TX 78712, USA
2
Princeton Plasma Physics Laboratory, Princeton, NJ 08543, USA
This work was supported by the U.S. Department of Energy, Grant No.
DE-FC02-99ER54512. Reproduction, translation, publication, use and disposal, in whole or in part, by or for the United States government is permitted.
FUSION SCIENCE AND TECHNOLOGY
DIAGNOSTIC SYSTEMS ON ALCATOR C-MOD
N. P. BASSE ∗† and A. DOMINGUEZ, E. M. EDLUND, C. L. FIORE,
R. S. GRANETZ, A. E. HUBBARD, J. W. HUGHES, I. H. HUTCHINSON, J. H. IRBY, B. LABOMBARD, L. LIN, Y. LIN, B. LIPSCHULTZ, J. E. LIPTAC, E. S. MARMAR,
D. A. MOSSESSIAN, R. R. PARKER, M. PORKOLAB, J. E. RICE, J. A. SNIPES, V. TANG, J. L. TERRY, S. M. WOLFE, S. J. WUKITCH, K. ZHUROVICH
Plasma Science and Fusion Center Massachusetts Institute of Technology
MA-02139 Cambridge USA
R. V. BRAVENEC, P. E. PHILLIPS, W. L. ROWAN Fusion Research Center
University of Texas TX-78712 Austin
USA
G. J. KRAMER, G. SCHILLING, S. D. SCOTT, S. J. ZWEBEN Princeton Plasma Physics Laboratory
NJ-08543 Princeton USA
92 pages, 1 table and 32 figures
(Dated: December 29, 2005)
Abstract
An overview of the diagnostics installed on the Alcator C-Mod tokamak [I. H. HUTCHINSON et al., Phys. Plasmas, 1, 1511 (1994)] is presented. Approximately twenty-five diagnostic systems are being operated on C-Mod. The compact design of the machine and the cryostat enclosing the vacuum vessel and magnetic field coils make access challenging. Diagnostics are used to study four focus areas: Transport, plasma boundary, waves and macrostability. There is significant overlap between these topics and they all contribute towards the burning plasma and advanced tokamak thrusts. Several advanced and novel diagnostics contribute to the investigation of C-Mod plasmas, e.g. electron cyclotron emission, phase-contrast imaging, gas-puff imaging, probe measurements and active magnetohydrodynamic antennas.
KEYWORDS: diagnostics, Alcator C-Mod, tokamak
PACS numbers: 52.25.Xz, 52.55.Fa, 52.70.Ds, 52.70.Gw, 52.70.Kz, 52.70.La, 52.70.Nc
I. INTRODUCTION
Alcator C-Mod [1] is a compact (major radius R0 = 0.67 m, minor radius a = 0.21 m
[2]), diverted tokamak with the ability to run high toroidal magnetic field Bφ (≤ 8 T), high
plasma current Ip (≤ 2 MA) and high electron density ne (≤ 1.5 × 10²¹ m−3) plasmas.
The walls are covered by Mo tiles and boronization is used regularly to reduce the impurity content of the plasmas. Auxiliary heating presently consists of ion cyclotron radio frequency (ICRF) minority heating using two 2-strap antennas at 80 MHz and one 4-strap antenna with a variable frequency between 50 and 80 MHz. Additionally, lower hybrid current drive (LHCD) at 4.6 GHz is being brought online, mainly to drive current, but also to heat.
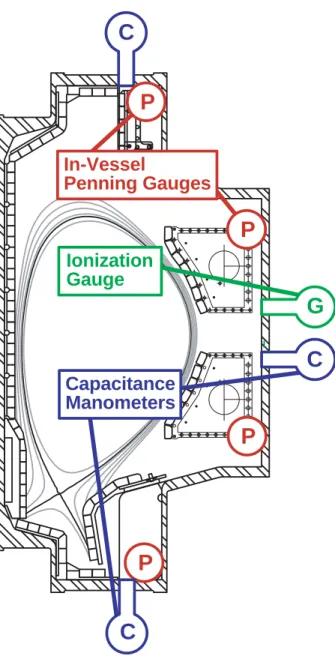
Approximately twenty-five diagnostic systems are being operated on C-Mod, see Table I. Some diagnostics are mentioned in the table but not described in the paper, such as the neutral pressure gauges shown in Fig. 1. The compact design of the machine and the cryostat enclosing the vacuum vessel and magnetic field coils make access challenging. Ten horizontal ports exist on the outboard side, along with top and bottom ports at the same toroidal position. Ports are named A-H and J-K; two outboard limiters are installed, a full limiter in the GH sector and a split limiter in the AB sector.
We group the C-Mod diagnostics into four focus areas: Transport (section II), plasma boundary (section III), waves (section IV) and macrostability (section V). There is signifi-cant overlap between these topics and they all contribute towards the burning plasma and advanced tokamak thrusts. Existing diagnostics are continually upgraded and new diagnos-tics progressively installed to take advantage of new techniques and/or technology and to address new physics questions. We end the paper by discussing recent developments and future diagnostics in section VI.
Measurements are usually digitized using computer automated measurement and control (CAMAC) modules, peripheral component interconnect (PCI) boards and compact PCI (cPCI) boards. Hardware is controlled by model data system plus (MDSplus) [3] on Linux-based personal computers (PCs).
II. TRANSPORT
A. Bolometry
Measurements of the total radiated power using bolometry are performed with two types of detectors. The gold foil bolometers of Ref. [4] provide highly stable and radiation-resistant detectors which can be calibrated electrically in situ, but with limited signal bandwidth. Semiconductor absolute extreme ultra violet (AXUV) detectors [5] are available in more compact multi-detector arrays and have extremely fast response. However, they are known to degrade as a result of radiation damage, and so their calibration is less certain. Cross calibration enables us to take advantage of the strengths of both types of detector.
C-Mod possesses tangentially viewing sixteen-element arrays of both gold foil and AXUV bolometers, located near the midplane. These provide radial profiles of radiation in the main chamber (confined plasma) by Abel inversion. In addition, poloidally viewing bolometer ar-rays specifically designed to reconstruct radiation in the divertor have been used to give insights into such phenomena as divertor detachment [6]. A higher spatial resolution tan-gential edge AXUV array has been used for diagnosis of e.g. the high (H) confinement mode pedestal [7].
In addition to the arrays, a detector of each type has been configured to observe the entire plasma. These so-called 2π bolometers give a signal proportional to the total radiated power. Their interpretation involves geometric approximations, but the approximations prove to be quite robust, and except in situations of dominant divertor radiation, generally give good agreement with the total main chamber radiation reconstructed by the bolometer arrays. For operational guidance the 2π bolometers prove to be extremely useful.
B. Neutron Flux
The total neutron flux is measured using two different systems. The first consists of twelve fission chambers of varying sensitivity combined with four BF3 counters and four He3
detectors. These are distributed between four moderator filled cans at different locations in the C-Mod cell [8]. Two of these are absolutely calibrated with Cf252, and the others are cross calibrated from these using the fusion neutrons from C-Mod. The arrangement provides a good dynamic range, but the time resolution is limited to 1 ms because they are
operated in count rate mode.
The second detector system is made up of fourteen He3 filled proportional counters sur-rounded by a polyethylene moderator. Their outputs are connected in parallel, producing a small current proportional to the impinging neutron flux. Measurements of this current can be done with a time resolution of 0.1 ms, and are limited only by the slowing-down time of the thermonuclear neutrons in the moderator. Sawtooth oscillations can clearly be seen in the output of this system. The magnitude of the output is scaled to that from the absolutely calibrated system to provide a fast measurement of the total neutron production.
Since the C-Mod plasma is heated solely by ICRF and Ohmic heating, the central ion temperature Ti can be inferred from the total neutron production. The neutron production
rate is related to the D ion density ni and velocity as given by
RDD =
n2 D
2 hσviDD, (1)
where hσviDDis the value of the D fusion cross section averaged over the velocity distribution
function [9]. When Ti is below 25 keV, the following approximation can be used:
hσviDD = 2.33 × 10⁻¹⁴Ti−2/3e−18.76T
−1/3
i , (2)
where Ti is in keV [10]. ne is corrected from the measured plasma effective charge, Zeff, to
obtain ni, also accounting for the H minority fraction which is obtained from the ratio of
Hα to Dα line radiation, see section IV A. Ti is then found iteratively, assuming that the Ti
profile is Gaussian with the width of the electron temperature (Te) profile.
C. Electron Cyclotron Emission
C-Mod has a set of several instruments measuring the electron cyclotron emission (ECE). This enables routine measurements of Te profiles and, taken together, provide excellent
frequency coverage and spatio-temporal resolution. All instruments use second harmonic extraordinary (X) mode emission, which at the high densities and fields typical of C-Mod provides good optical depth from the center to near the separatrix and is not cut off under most operating conditions of interest. The frequency of this emission is up to 500 GHz at a central Bφ of 8 T, higher than on most other experiments and affecting our choice of
A large-scan Michelson interferometer has been operational on C-Mod since its first cam-paign. This novel instrument, which was designed at MIT, features a large 3 cm stroke, giving a resolution of 5 GHz [11, 12]. The mechanical design allows operation up to 33 Hz, with low vibration. The entire instrument is operated under vacuum to avoid H2O
absorption features in the higher frequency range. Broadband, He cooled InSb detectors enable measurements of the entire spectrum over about 100-750 GHz, typically covering the first three harmonics and allowing Te(r) measurements at all Bφ as well as a check that the
emission is thermal.
The viewing optics and transmission beamline for this system consists of a large aperture Gaussian telescope. Two 20 cm parabolic mirrors, with 2.7 m focal length, image emis-sion from a chord near the horizontal midplane to a variable aperture at the input to the Michelson interferometer [13]. The beamline is also evacuated, with a window separating the instrument and torus vacua. The final mirror is rotatable, allowing the vertical position of the plasma focus to be adjusted or turned to face an in situ calibration source. This large aperture, vacuum-compatible source features epoxy tiles cooled by liquid N2 (LN2), which
can be switched with a separate source at room temperature [12]. The high throughput of the Michelson interferometer allows it to be absolutely calibrated in situ; calibrations have proven reliable and stable over several years. Other ECE instruments are then cross-calibrated using plasma emission.
Higher time resolution measurements are provided by two grating polychromators (GPCs) which share the same viewing optics as the Michelson interferometer. The first, named GPC1, is a nine channel instrument originally designed by the University of Maryland for use on the Microwave Tokamak Experiment (MTX) tokamak [14–16]. A set of gratings al-lows full radial coverage for any field of interest. The polychromator design gives a frequency resolution ∆f /f ∼ 0.009. With broadening due to geometric and fundamental effects, the net radial resolution is typically 1 cm. Bandwidths of up to 900 kHz are possible. At a more typical resolution of 10 µs, low noise levels of ∼ 10 eV are obtained across the profile. Mea-surements have been used routinely for a wide range of physics studies in C-Mod, including measurements of sawtooth propagation [16], deposition of ICRF and mode conversion heat-ing through break-in-slope analysis [17], detection of core and edge magnetohydrodynamic (MHD) modes [18–20] and measurements of the high (H) confinement mode threshold and pedestal profiles, enhanced using a Bφ sweep technique [21, 22]. A second grating
polychro-mator with nineteen channels (GPC2) was added in 1998 [23]. This instrument, developed for use on the Tokamak Fusion Test Reactor (TFTR) [24], has comparable resolution to GPC1 and has enhanced the flexibility of the diagnostic set by increasing the number of measurement channels and enabling two frequency ranges (and two Bφ) to be easily covered
in a single experimental day.
A heterodyne ECE system, the Fusion Research Center ECE (FRCECE) diagnostic, was commissioned in 1999. It uses separate viewing optics and enables even higher spatio-temporal resolution measurements [25]. This diagnostic uses in-vessel optics, located for space reasons below the horizontal midplane, to give a narrow Gaussian beam waist and a poloidal resolution of about 1 cm [26, 27]. Emission is coupled to a short overmoded waveguide transmission line and detected using a thirty-two channel radiometer. The fre-quency range of 234-306 GHz was optimized for good radial coverage at Bφ = 5.4 T, the
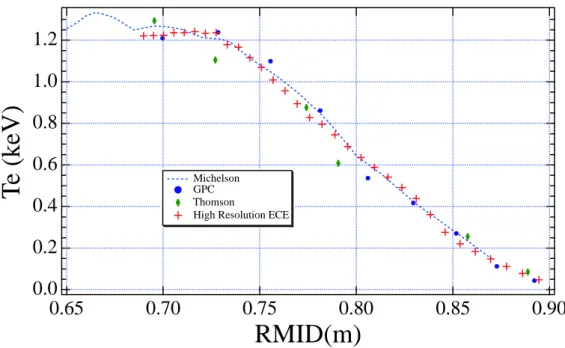
most common field of operation in C-Mod. This system uses two local oscillators (LOs) at 115 GHz and 133 GHz and low noise second harmonic mixers. Intermediate frequency (IF) signals are downshifted to the 4-22 GHz band. For profile measurements, a 1 GHz RF bandwidth gives 4 mm radial resolution, with a video bandwidth of up to 1 MHz and very low noise levels. This gives very high resolution measurements of, for example, heat pulse propagation and radio frequency (RF) deposition as well as small quasi-coherent (QC) mode fluctuations [27, 28] and fast dynamics at the transition from the low (L) confinement mode to H-mode [29]. Typical Te profiles of several ECE diagnostics, and comparison with
Thomson scattering (see section II D), are shown in Fig. 2.
Correlation ECE (CRECE) measurements aimed at detecting turbulent Te fluctuations
have also been made with the heterodyne system, using a technique of correlating radially adjacent but disjoint channels to average out thermal noise. A separate IF section with three filter pairs of 500 MHz channels was used in addition to the receiver described above. In contrast to results on other experiments [30], no broadband turbulent fluctuations were detected above the noise level. An upper bound to the fluctuation level was set at about 1 % [31]. The diagnostic is mainly sensitive to fluctuations with kθ < 5.1 cm−1. It is possible
D. Thomson Scattering
A Thomson scattering (TS) diagnostic is used to measure profiles of Te and ne. The
diagnostic has two major components, a core TS and an edge TS system, measuring Te and
ne in these respective regions of the plasma. The core TS system consists of two parts: The
original diagnostic which collected first data in 1995 [32, 33] and a 2002 upgrade [34]. High resolution edge TS [35] has complemented the core systems since 1999. All TS diagnostics operate simultaneously, sharing laser setup, collection optics and a variety of controlling hardware and software tools.
1. Diagnostic Setup
The diagnostic uses two identical quality (Q) switched Nd:YAG lasers (λ0 = 1064 nm)
controlled remotely by a PC. Each laser has a fixed pulse rate of 30 Hz, with a nominal 1.3 J, 8 ns pulse. The triggers for flash lamp pumping and Q-switch pulses are generated by CAMAC hardware, set up to provide two staggered Nd:YAG pulse trains and subsequent measurement of TS profiles at 60 Hz. Each Nd:YAG beam is coaligned with a continuous wave (CW) HeNe laser to assist in alignment of the beams through the tokamak vessel. The two beam paths are made close to parallel (∆θ ∼ 5 mrad) and directed along a 15 m long beam path to a vertical port positioned over the tokamak vessel. A pair of remotely controlled steering mirrors on the laser optical bench is used to make fine adjustments to one or both of the beam positions on top of the machine. Each mirror stage tilts in response to two actuators driven by DC motors. Laser beam steering, system temperature control and real time system monitoring are accomplished with programmable logic controller (PLC) modules.
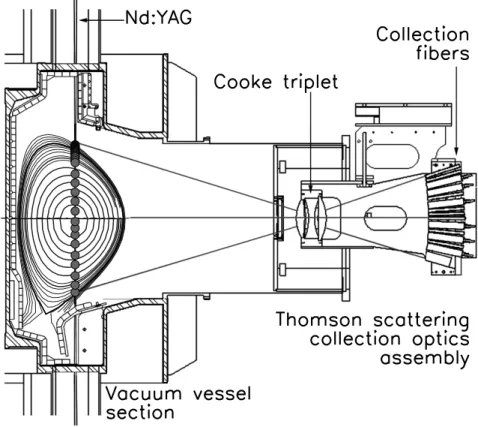
From the top of the tokamak, the beams are directed vertically through a focusing doublet with a focal length of 3 m and into the tokamak, entering and exiting through windows placed at the Brewster angle and allowing almost complete transmission of the linearly polarized Nd:YAG beams. The Nd:YAG beams are focused such that the nominal beam width is less than 2 mm along the vertical chord passing through a typical C-Mod plasma. The tokamak poloidal cross section in Fig. 3 shows the beam path through the vessel. Also shown are contours of constant poloidal flux obtained from equilibrium fit (EFIT) [36]. The
beam paths are nearly collinear throughout the plasma, and scattering from a given vertical location can be assumed to occur at the same radius for either laser.
Shown also in Fig. 3 are the TS collection optics and sample ray traces. Thomson scat-tered light leaves the vessel through a vacuum window at a horizontal port and is collected at an aperture of f /7 by an air-spaced Cooke triplet. This triplet has a focal length of 30.8 cm and a 1:2 demagnification, with minimal aberration. At the focal surface of the triplet are the TS collection fibers, mounted upon a vertical tilt plate [34]. The fiber positions, to-gether with the radial location of the Nd:YAG beams, determine the vertical location of the scattering volumes. The height of each scattering volume is roughly two times the vertical dimension of its corresponding collection fiber, and it is this dimension that determines the spatial resolution of a given TS channel.
Twenty-two polymer clad single strand quartz fibers with a 1 mm active diameter make up the edge TS collection fiber array. These fibers are mounted closely together near the bottom of the focal surface and view the upper edge of C-Mod plasmas, while the remainder of the plasma is viewed by core TS collection fiber bundles. The original core TS system has up to six fiber bundles, which employ glass prisms as light concentrators with an extent of approximately 1 cm along the focal surface. Eight fiber bundles, each 0.4 cm in lateral extent, were added as part of the 2002 TS upgrade. The smaller size allows both improved spatial resolution in a given TS channel and closer spacing between fibers. Fig. 3 indicates the locations of scattering volumes for one possible arrangement of collection fibers. A midplane radial resolution ∆R of 1 cm can be achieved for certain regions of interest (e.g. internal transport barriers (ITBs)) using core TS, while edge TS gives ∆R ∼ 1-2 mm in the vicinity of the last closed flux surface (LCFS).
Collected TS photons are transmitted to an assortment of polychromators designed to de-tect scattered light falling into distinct spectral bands near the Nd:YAG laser line. The poly-chromators are each constructed with a relative aperture of f /3.5, and all use temperature-stabilized Si avalanche photodiodes (APDs) for detection. The response of each APD is digitized with CAMAC hardware. Timing for this pulsed data acquisition is provided by a portion of Nd:YAG light that leaks through steering mirrors as the beam is directed to the tokamak.
The original core TS diagnostic employs Wadsworth mount grating polychromators [32] connected to the set of fiber bundles and light concentrators described above, and the
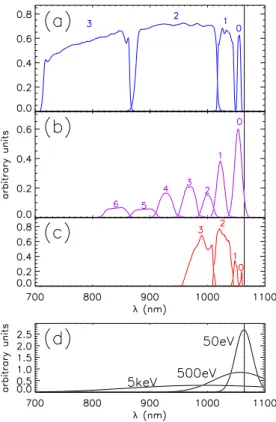
up-grade consists of 4 channel filter polychromators [37] fabricated by General Atomics, modified to accept an input 0.4 cm fiber bundle at f /3.5. A single filter polychromator [38] with mul-tiple spatial channels is employed for the edge TS system, where each channel is reserved for a single 1 mm diameter edge TS fiber. Fig. 4 (a-c) shows typical spectral response functions fi(λ) for these three instruments, where i is the spectral channel number. The configuration
of fi in wavelength space and the width of the TS spectrum as a function of temperature
determine the useful Te range of each instrument. This range is approximately 0.2-5 keV
for the original core TS system and ∼ 0.05-10 keV for the core TS upgrade. The upper bound in Te for the edge TS system is reduced relative to the core systems, due to the
nar-rower range in wavelength shown in Fig. 4 (c). However, the closer distribution of spectral channels near the laser line gives a smaller lower bound and a range of 15 ≤ Te(eV)≤ 800
results, yielding more useful measurements near the LCFS. The dynamic range in density is determined by the signal-to-noise ratio (lower limit) and detector saturation (upper limit). These conditions yield an estimated range of 0.5 ≤ ne(1020 m−3) ≤ 50 for the original core
TS system, 0.5 ≤ ne(1020 m−3) ≤ 30 for the core TS upgrade and 0.3 ≤ ne(1020 m−3) ≤ 5
for the edge TS system.
2. Calibrations and Measurements
The shape of the TS spectrum observed from a given scattering location is a known function of Te and scattering angle θj, where j is the spatial point number. The amplitude
of the spectrum is proportional to both the laser pulse energy E0 and the local ne. Analytical
forms of the fully relativistic TS form factor S(λ, Te, θj) are readily available in the literature
[39, 40]. Fig. 4 (d) shows a sample set of S(λ) at various Te. To obtain expected signals
from a TS detector as a function of Te, we convolve the form factor with the fi(λ) from Fig.
4 (a-c).
Rayleigh and Raman scattering are conventional techniques for the absolute calibrations of TS systems [41–43]. Rayleigh scattering can be used to calibrate the original core TS system only, since the polychromators used in both the upgraded core TS diagnostic and the edge TS system reject the laser line at 1064 nm. All TS systems are spectrally configured to take advantage of Raman scattering in H2 and D2, and useful results are obtained for
uncertainty in calibration coefficients, undermining the results. For these systems we instead take advantage of cutoffs in ECE that occur due to high plasma densities.
For absolute calibration purposes we make special discharges, during which we ramp the plasma density up to the values critical for the C-Mod ECE diagnostics. During such discharges, the plasma density profile increasingly evolves and as it locally reaches the critical density, an abrupt loss of signal in the ECE channels is observed. Since the ECE diagnostics operate at fixed and known frequencies, the critical density values for all channels where cutoffs are observed can be calculated. Radial positions of the ECE channels are known since the frequency of the emission is proportional to Bφ. Thus we are able to calculate
density values at certain positions in the plasma when the ECE channels reach their cutoff. These values are then interpolated in time and space to the measured TS data points and are used to obtain calibration coefficients for the core TS systems. This calibration technique is implemented in situ during regular plasma operation. After several plasma discharges with clear ECE cutoffs for each TS channel, we can determine absolute calibration coefficients for the core TS systems with 10 % uncertainty or less.
The edge TS diagnostic takes measurements within ∼ 2 cm of the LCFS, a region in which low ne results in few cutoffs, and small ECE signals at low Tehinders the observation
of cutoffs. Moreover, the spatial resolution of the ECE system is very coarse compared to that of the edge TS system, which makes the ECE cutoff calibration method unsuitable for a channel-by-channel calibration of the edge TS diagnostic. This system is calibrated using Raman scattering in D2 and H2, and an uncertainty of 15 % in the absolute calibration
coefficients is obtained. Since C-Mod has some restrictions on filling the machine with a gas other than D2, this form of calibration is typically reserved for the earliest part of a run
campaign, or delayed until the end of the campaign.
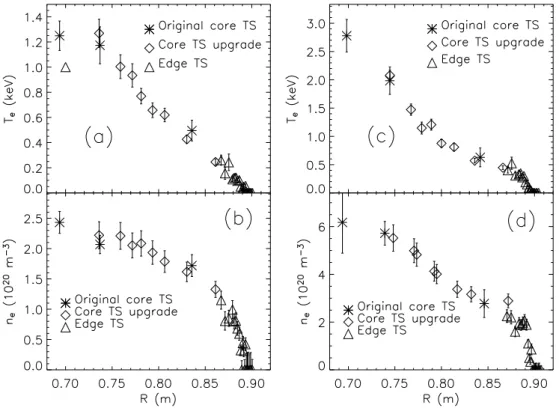
The TS diagnostic set has been useful to the routine operation of the tokamak, reliably providing accurate and simultaneous measurements of both ne and Te. In addition, the
details of the obtained profiles has been essential to studies of plasma phenomena such as edge transport barriers (ETBs) and ITBs. Fig. 5 shows examples of Te and ne profiles
obtained by the TS diagnostics in different plasma regimes. Temperature and density profiles in low (L) confinement mode are depicted in Fig. 5 (a-b), respectively. Upon transition to H-mode, an ETB forms near the LCFS, creating a region of steep gradients, or a pedestal, in both Te and ne. The electron temperature in H-mode is shown in Fig. 5 (c). The Te
pedestal region is seen to be less than 1 cm in extent, demonstrating the importance of a highly resolved edge TS system. Shown in Fig. 5 (d) is the ne profile in a double-barrier
regime, where an ITB forms in the presence of the H-mode pedestal. Both barriers are accurately diagnosed by a combination of all three TS diagnostics, and the details of the profiles are used in studies of the formation and evolution of ITBs in C-Mod.
E. Two-Color Interferometer
The two-color interferometer (TCI) is a vertically viewing ten chord interferometer using a 20 W, 10.6 µm CO2laser, and a 17 mW, 0.632 µm HeNe laser to measure the plasma induced
phase shift and to subtract vibrations [44]. Both laser beams pass through acousto-optic modulators (AOMs), resulting in 0th and 1st order beams with 40 MHz frequency offsets. The CO2 and HeNe beams are then combined to produce coaxial beams that form the
plasma and reference arms of the interferometer. Both beams are expanded using reflective cylindrical optics to produce elliptical beams that map properly to the detector arrays (2×40 mm). The plasma beam is further expanded to match the required view of the plasma. The C-Mod vertical ports view major radii from 0.6 to 0.8 m. TCI uses only the outer half of this view for all ten chords since the information on either side of the major axis is generally redundant. The plasma arm passes very close to, but does not contact a beamsplitter on its way to the vertical port. After passing through the vessel, the beam is reflected back at a small angle relative to the incident beam for a second pass. The mirror is located on the top of the C-Mod igloo, which provides a very stable, relatively low vibration level structure on which to mount this mirror. Vibration levels are typically 100 to 300 HeNe fringes during a C-Mod discharge. On return, the beam strikes the beamsplitter and is combined with the reference beam. Both beams are now properly matched in size to map onto the ten channel CO2 detector array and four HeNe detectors. All detectors are mounted very rigidly to a
common support plate so that once the beams are separated, very little vibration induced error occurs.
The CO2 detector array consists of ten room temperature HgCdTe 2×2 mm2photovoltaic
detectors spaced 4 mm apart. The 40 MHz signal from these detectors drive limiting ampli-fiers that provide a constant level signal for the phase demodulators. The HeNe detectors are 0.25 mm diameter avalanche Si photodiodes that also drive limiting amplifiers. An LO
derived from the AOM drive signal is used as the reference for phase detection. The phase detector consists of an eight bit counter to keep track of fringes even at very high fringing rates during pellet injection, and a fraction fringe exclusive or (XOR) detector with ten bit resolution. Signal conditioning, phase detection, memory, and CAMAC interface electronics are built into a single width CAMAC module. The data acquisition rate is typically 5 or 10 kHz, but the electronics is capable of 1 MHz bursts to measure density fluctuations and fast density changes in response to pellet injections.
F. Visible Continuum Imaging
A tangentially viewing, high spatial resolution (down to 0.7 mm chordal), visible con-tinuum imaging system is employed on C-Mod to monitor profiles of low energy free-free bremsstrahlung emission from the plasmas. The light is passed through an interference bandpass filter centered at 536 nm with a full width at half maximum (FWHM) of 3 nm. This spectral region is chosen as it is free of strong line radiation from the working gas and impurity species normally found in the C-Mod plasmas. The emissivity is proportional to n2
eZeff and is weakly dependent on Te [45]. The detector is a 1D charge-coupled device
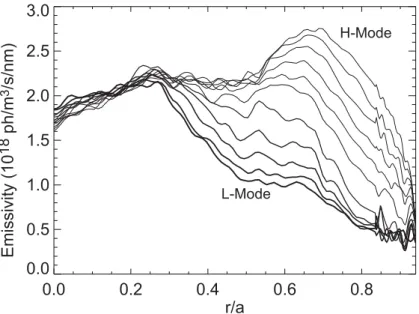
(CCD) array with 2048 pixels. Each pixel is 500 µm high by 13 µm wide, and is capable of lineout rates from 250 Hz to 4.5 kHz. Under most conditions, a 1 kHz rate gives an excellent signal-to-noise ratio. The system utilizes a multi-lens periscope to image the light onto the detector, and the tangential view is accomplished with an optically polished 304 stainless steel flat mirror which is located inside the vacuum chamber in the shadow of a nearby outboard limiter. A pneumatically actuated linear motion feedthrough controls a shutter which protects the mirror and vacuum interface window during discharge cleaning and boronization. Chordal coverage extends from 2 cm inside of the magnetic axis to about 1 cm outside of the LCFS for typical equilibria. With the assumption of toroidal symmetry, the measured brightness profiles are Abel inverted to yield local emissivity profiles. Us-ing the Thomson scatterUs-ing measurements of electron density and temperature profiles, the bremsstrahlung data are used to compute Zeff profiles. Emissivity profiles, at 2 ms intervals,
following the dynamics of an H- to L-mode transition after the ICRF heating was turned off, are shown in Fig. 6. As is typically the case, after the plasma comes out of H-mode and the edge barrier is lost, the density decrease propagates radially in from the edge; this
is reflected in the bremsstrahlung profiles which are most sensitive to the density evolution.
G. X-Ray Spectroscopy
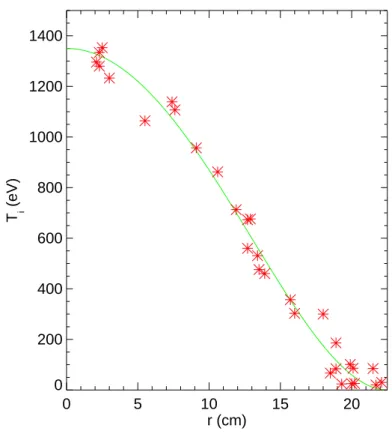
The current high resolution X-ray spectrometer system consists of two component parts: Three radially viewing, vertically scannable, spectrometers and three tangentially viewing spectrometers. The former provides complete radial profiles, out to the LCFS, of parameters such as Ti and impurity densities, while the latter yields a three point toroidal rotation
velocity profile. Each von Hamos type spectrometer consists of a variable entrance slit, a quartz crystal (2d = 6.687 ˚A) and a position sensitive proportional counter detector [46]. Each spectrometer has a resolving power of 4000, 2 cm spatial resolution and a wavelength range of 2.7 to 4.1 ˚A. Spectra are typically collected every 20 ms during a discharge, with 120 m˚A covered at any one wavelength setting. Much of the diagnostic information [47, 48] comes from observations of the strongest lines of He- and H-like Ar, introduced by gas puffing. Ti profiles are determined from the Doppler broadening of the most intense lines,
an example is shown in Fig. 7 [49].
Toroidal rotation velocity profiles are available by measuring the Doppler shifts, some examples [50] are given in Fig. 8.
Certain line ratios are very sensitive to the electron temperature and can be used to de-termine the profile shape. High-n transitions in Ar, which are populated by charge exchange recombination, have been used to measure the neutral H density profile in the plasma. Ab-solute line intensities can be used to determine impurity densities, e.g. for intrinsic elements such as Mo [51, 52] and to extract complete impurity density profiles [49]. Intensities of injected impurities can provide information about impurity penetration and screening [53]. Time histories of impurity emission taken along different chords have been used to deter-mine impurity transport coefficient profiles following injection by laser blowoff. ∆n ≥ 2 ground state transitions in charge states of high-Z atoms around Ne-like and medium-Z atoms around He-like have been observed and used to test atomic structure calculations.
H. Beam Based Diagnostics
1. Beam Description
The neutral beam based diagnostics on C-Mod include charge exchange recombination spectroscopy (CXRS) for Ti, vθ and vφ, beam emission spectroscopy (BES) for density
fluc-tuations and motional Stark effect (MSE) for jφ. Since C-Mod is not heated with neutral
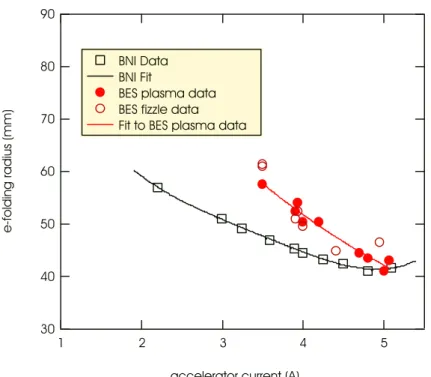
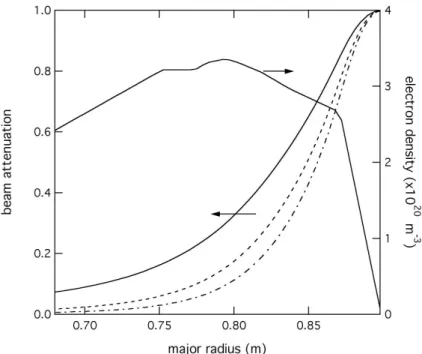
beams, a diagnostic neutral beam (DNB) is used to excite the spectra required for the measurements. The beam used for the 2004 campaign [54] generated a 45 kV H beam. The accelerated current before neutralization was typically 4 A. The neutralized current is computed to approximately 3 A based on measurements of the component mix downstream from the neutralizer and estimates of the neutralizer efficiency for each component. The power supply technology limited the pulse length to 0.1 s. The variation of the beam profile width with accelerating current is shown in Fig. 9. The width of the beam density profile measured at the 1/e points near the beam focus is 8 cm. For later reference, this corresponds to a FWHM between 6.5 and 7.5 cm. Using a cold cathode source [55], the beam produced the usual four energy components of H neutrals at energies equal to the full beam energy, one-half of the beam energy, one-third of the beam energy and one-eighteenth of the beam energy. The densities of these components at the output of the beam (following the neutral-izer) were in the ratios 45:8:29:18 as measured spectroscopically during actual experiments [56]. The penetration of the beam into a C-Mod EDA H-Mode plasma is shown in Fig. 10. From this, it is clear that the beam can probe the plasma in the range 0.75 m < R < 0.90 m or equivalently, 0.3 < ρ < 1.0. For the 2005 campaign, that beam was replaced with one better tailored to C-Mod requirements. With a maximum beam voltage of 55 kV and an expected accelerated ion current of 7 A, better penetration of the beam into high density plasmas is expected. The beam pulse length will be 1.5 s continuous or 3.0 s modulated to better match the C-Mod pulse length.
2. Charge Exchange Recombination Spectroscopy
The CXRS optical systems are simple and have high throughput [57]. There are three optical systems in use at present. These must be designed for in-vessel installation close to the plasma where they are subject to large forces during disruptions and are inaccessible
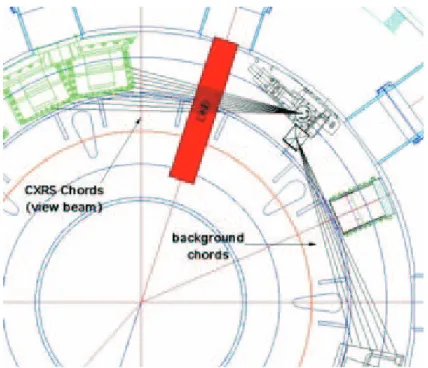
between vacuum vents. Two toroidal optical systems (see Fig. 11), located in-vessel, provide ten channels of Ti and vφdata from 78.4 cm < R < 87.7 cm with a resolution of 0.5 cm and
ten channels of data from 76.5 cm < R < 87.3 cm with a resolution of 0.6 cm viewing away from the beam. The latter allows background subtraction in those plasma discharges with a weak CXRS signal strength. A third poloidal system located in-vessel provides twenty-five channels of Ti and vθ data from 84.7 cm < R < 90.3 cm.
The toroidal optical system is protected by shutters which are typically closed during wall conditioning to prevent accelerated degradation of the optics. The first two elements in the toroidal optics are a pair of stainless steel mirrors which direct light from the beam into a lens train. The first lens element is a pair of plano-convex lenses with relative orientation to reduce spherical aberration and coma. To reduce the overall length of the system, while limiting aberrations, a meniscus lens was added. The total magnification of the system is 0.2. The beam is imaged onto an image dissector consisting of a set of ten fiber bundles which transmit the light to the vacuum feedthrough. This section of the optical fiber is exposed to the plasma, discharge cleaning, and extremes of temperature due to active heating of the vacuum vessel. Each channel is a 1 mm × 2.5 mm bundle of fibers. Each fiber has a 200 µm fused silica core, a 10 µm thick F doped silica cladding and a 12.5 µm thick polyimide jacket. The ten channels are independently shielded in stainless steel monocoil to improve flexibility and only assembled into a single unit at the lens end. The vacuum feedthrough in each case is a 50 mm diameter fiber optic faceplate with a 6 µm fiber size. The light is then transmitted through relay fibers to the spectrometer.
The poloidal optics in use at present emphasize measurements in the pedestal region of the plasma. A single achromatic lens focuses the plasma onto a collection of twenty-five 400 µm fibers. The resolution of the system is approximately 3 mm. Rather than a shutter, this system employs an extended tube to prevent the plasma from contacting the lens.
The use of a high throughput (f /1.8) imaging spectrometer [58] and a large 2D camera as a detector [59] are critical to this experiment. The high density of the plasma and consequent high attenuation of the beam in the outer portion of the plasma reduces the available light in the core so high throughput is important. The spectrometer forms a 2D image in its exit plane, this allows as many as forty-five fibers each representing a spectrum from a different spatial view to be observed simultaneously.
two well resolved B lines. B is used for the measurements since it is the light impurity with highest concentration. The line used to detect CXRS emission is 4944.67 ˚A (n = 7 → 6) B+4. The line is blended with a line from a lower ionization stage, 4940.376 ˚A,
2s3d1D
2 - 2s4f1F3B+1 [60]. Shown in blue in Fig. 12 is the spectrum taken just after the
DNB was turned off. The spectrum in red during the DNB pulse - in comparison with the spectrum taken after the DNB was turned off - shows the CXRS enhancement relative to the background B+4 emission which is excited by electron excitation and thermal charge
exchange. The line blend is superposed on the continuum. A detailed model for the line is used to extract nBII, nBV, Ti, vφ and vθ. The model includes a fine structure of the B+4 line
including a very detailed description of the Zeeman effect, since Bφ is typically 5.4 T.
3. Motional Stark Effect
Both the MSE diagnostic and BES, described later, observe Balmer-α emission from the beam (Hα). In addition, they share the same optical system at the machine, designed and
built primarily by PPPL for MSE with input from the University of Texas Fusion Research Center for compatibility with BES. The lack of convenient tangential access on C-Mod prompted an unusual optical design involving five lenses and three dielectric mirrors tuned to Hα inside the vacuum chamber. The in-vessel optical system shown in Fig. 13 views
the radially-directed DNB across the region 67 cm < R < 90 cm at a 5◦ downward angle.
This is an attempt to view along the magnetic field lines to maximize poloidal resolution for BES. A view vector also has a component parallel with the DNB axis which introduces a Doppler shift that separates the beam Hα emission from the edge Dα emission. However,
the angle degrades radial resolution because of the finite beam width (8 cm FWHM). The lenses and mirrors are housed in a periscope assembly (light green in Fig. 13) that relays collected light out of the vessel through a 10 cm diameter window on the same port but 23 cm above the DNB. The light is carried farther out radially by five relay lenses outside the vacuum to an image dissector populated by both MSE and BES collection fibers. The external optics also contain two photoelastic modulators (PEMs) at 20 and 22 kHz oriented at a relative angle of 45◦ and a linear polarizer, all required for MSE. The collection area at
the beam is the area of the fiber tips magnified by the optical system. The magnification decreases with major radius from 6.0 at R = 67 cm to 3.8 at R = 80 cm (optical axis) to
3.3 at R = 90 cm.
The use of in-vessel optical components posed several challenges for the optical and mechanical design of the system, since the in-vessel environment is demanding with regard to mechanical forces, magnetic field strength, window coating, temperature (C-Mod is baked to 150◦ C) and outgassing limitations. Because disruptions induce transient forces on vacuum
components, the in-vessel glass components are protected by trapped volumes of Teflon cushioning less than 1 mm thick, and support plates for the larger mirrors are fabricated from Inconel to reduce eddy currents. To minimize Faraday rotation, all transmissive optical elements are fabricated from low Verdet SFL6 glass with the exception of the PEMs. A shutter mechanism surrounds the plasma-facing lens that can be positioned in one of three orientations providing either a direct line of sight to the plasma, or a completely obstructed view (to protect against coating by boronization and large disruptions) or a view through a wire-grid polarizer for MSE calibration purposes.
The MSE diagnostic [61–63] measures the profile of magnetic pitch angle at ten spatial locations. The radial resolution is limited to < 1.4 cm at the plasma edge and < 5.0 cm at the plasma center by the finite width of the DNB. Its basic principle of operation is similar to the MSE diagnostic originally implemented on the Princeton Beta Experiment-Modification (PBX-M) [64] with some modifications to accommodate the C-Mod environment. Beam neutrals experience a Lorentz electric field (E = v × B) arising from their motion across the magnetic field, which splits the degenerate Balmer-α emission into a partially degener-ate multiplet whose components are polarized relative to the local electric field. It is the polarization direction of the full-energy +π component that is measured.
The image dissector is populated by an array of 1 mm optical fibers which resolve sixteen radial locations, of which ten are used for MSE. The light is carried 35 m to a set of temperature-controlled dielectric filters each tuned to the full-energy +π Stark component. The photon signals are then converted to current by Hamamatsu R943 photomultipliers, amplified, and digitized at 1 MHz by D-TACQ ACQ216cPCI digitizers. The polarization direction of the π-shifted Stark lines is related to the ratio of the signal amplitude at the second harmonic of the two PEM frequencies. In place of the customary lock-in amplifiers to measure the signal amplitudes at specific frequencies, we employ digital lock-in analysis that determines the amplitude at a given frequency by multiplying the raw digitized signal by a reference sine wave with the desired frequency and with a phase provided by the
PEM drive signal. This procedure allows the FFT amplitudes to be measured at a variety of harmonics and beat frequencies of the PEMs, which provides useful information about circular polarization of the light as well as the maximum retardation imposed by the PEMs. Two standard techniques are employed to provide an absolute calibration of the MSE diagnostic. The first involves firing the DNB into the torus filled with low-pressure D gas (0.5-2 mTorr). A magnetic field with known pitch angle is generated by the toroidal and equilibrium field coils and serves as a reference for the angles measured by MSE. The second technique mounts a linear polarizer onto a precision rotatable stage positioned in-vessel along the trajectory of the DNB to provide reference linearly polarized light through a full 360◦.
4. Beam Emission Spectroscopy
BES [65] observes Hα emission from the DNB without regard to Stark or beam-energy
components. All light passing through a bandpass filter is collected. Fluctuations in the emission can be translated into plasma density fluctuations. Also, since the system is abso-lutely calibrated, it can provide, with some modeling of the detected spectrum, radial and vertical profiles of the beam density.
The image plane of the optical system is sampled by thirty-six 1 mm optical fibers in a close-packed 6 × 6 array outside the farthest-out MSE fiber bundle. This arrangement is to allow maximum flexibility in measuring fine-scaled fluctuations in the edge. The array can be moved radially to sample the region 90 cm > R > 87 cm (86 cm if the edge MSE fiber is removed). The array is restricted to the edge because the angles between the interior views and the beam axis result in averaging over a large radial region. This is a consequence of the purely radial injection of the beam. The angles between the edge views and the beam, in contrast, are close to perpendicular. In addition, there are seven discrete fiber bundles, of two or four 1 mm optical fibers each, which can view a wide range of locations in the plasma above or below the array or the MSE views. These can be used to measure steady-state emission, e.g., beam profile, or large-scaled fluctuations in the core.
The fibers carry the light 32 m to an eight-channel filter spectrometer, fashioned after that used on the DIII-D tokamak [66]. From one to four adjacent fibers of the edge array or a single fiber bundle can be input into any channel of the spectrometer. The cone of
light emerging from the fibers of each channel is collected and collimated by a lens and then passes through a six-cavity filter with passband 6600 ± 10 ˚A (at normal incidence). The passband is adjusted (lowered) by tilting the filter via a precision micrometer/lever system to pass most of the Doppler-shifted Hα emission from the beam while mostly rejecting the
strong ambient Dα emission from the plasma edge. The filtered light is then focused by an
aspheric condensing lens onto the detector. The magnification of the spectrometer optics (0.4) is chosen to image as many as four fiber tips onto the active surface of the detector. The detectors and electronics are identical to those used on DIII-D [66].
With the aid of a spectral model of the beam emission and the bandpass filters, the beam density may be inferred from the raw data. Earlier (Fig. 9) were shown measurements of the beam profile measured by the BES system. Radial profiles may also be measured, and since the system is absolutely calibrated, beam performance can be diagnosed.
An example of a density fluctuation measurement is shown in Fig. 14 which shows the coherences and phases (modulo 2π) of three spatial locations (channels 3-6) relative to a fourth (channel 2), all located at R ∼ 88.5 cm. The feature in the spectrum at 100 - 120 kHz is the quasi-coherent (QC) mode seen near the separatrix of enhanced Dα (EDA) H-mode
plasmas. Channels 3, 4, 5 and 6 are separated vertically from channel 2 by 0.0, -4.5, -1.5 and +3.0 cm, respectively. The phases are consistent with a downward propagation (electron diamagnetic direction) of 3.5 - 4.0 km/s.
I. Magnetic Fluctuation Coils
The fast magnetic fluctuation diagnostics on C-Mod consist of sixty-five poloidal field pick-up coils mounted on two outboard limiters in addition to the twenty-six standard mag-netic pick-up coils located in four equally spaced toroidal locations [67]. Of the standard set of poloidal field pick-up coils, only the four coils nearest the midplane on the inner wall are used for fluctuation measurements, because the others are too far from the plasma to make reliable measurements of small amplitude fluctuations. There are twenty-nine coils mounted to the sides of the full limiter between G- and H-ports and an equivalent set of twenty-four coils mounted to the sides of the split limiter between A- and B-ports. There are also three coils mounted beneath the Mo tiles on both outboard limiters separated toroidally by about 3.8 cm and located 10 cm above and below the midplane. Fig. 15 shows a cross section of
C-Mod with the pick-up coils mounted to one side of the full limiter as well as the standard coils mounted poloidally around the vessel wall.
The standard magnetic pick-up coils are described in section V A. The coils mounted to the limiter are based on the same design but are only 13 mm long and 8 mm in diameter with four layers of 29 American wire gauge (AWG) (0.287 mm diameter) Kapton coated magnet wire with a total surface area of 47 cm2. Kapton was chosen because it is vacuum
compatible up to at least 150◦ C and can insulate well with very thin coatings to allow a
larger number of turns in a small diameter coil. The bobbins are made of 99.8 % pure Al2O3
sintered alumina ceramic. To ensure the exact location of the coils for accurate poloidal and toroidal phase measurements even for short wavelength modes, the coils are mounted with stainless steel blocks aligned with precisely machined holes in the limiter plates at each end of the coil.
The magnetic fluctuation coils were originally digitized with thirty CAMAC channels having twelve bit resolution sampling at 1 MHz for just over 0.5 s and with eighteen channels sampling at 2 MHz for just over 0.25 s. More recent data has been taken with thirty-two channels at a 2.5 MHz sampling rate for over 2 s with fourteen bit resolution. This new data acquisition system can also take data at a sampling rate of up to 10 MHz.
The sensitivity of the combined coil and data acquisition system allows magnetic fluctua-tions to be measured down to ˜Bθ ∼ 10−7 T up to the Nyquist frequency of half the sampling
rate. The spacing of the coils allows toroidal mode numbers n up to 75 and poloidal mode numbers m up to 14 to be measured.
The measured frequency response of the coils has a 3 dB point around 1 MHz. This is limited by the 0.017” thick stainless steel shield on the coils. This thickness is approximately one skin depth at 1 MHz.
In addition to the main magnetic fluctuation diagnostics, two probe heads were made that mount to the A-port scanning probe (ASP, see section III F 3) drive that contain magnetic pick-up coils to measure short wavelength (kθ ∼ 1-5 cm−1) modes in the plasma edge. The
first head contained two poloidally separated Langmuir probes and one poloidally oriented magnetic pick-up coil [68]. The coil was 5.8 mm in diameter and 4 mm long, had a surface area of 17.6 cm2and was made from a BN bobbin wound with 36 AWG (0.127 mm diameter)
high temperature ( > 450 ◦ C) Kulgrid ceramic-coated Ni-clad Cu wire [69]. The second
of 5.92 mm apart. The coils each had a surface area of 11.3 cm2 and were 3.3 mm long and
5.8 mm in diameter. The coil spacing allows estimates of m to be made up to 150.
J. Phase-Contrast Imaging
The phase-contrast imaging (PCI) diagnostic measures electron density fluctuations line integrated along vertical chords. We use a 25 W CW CO2 laser, having a wavelength λ0 =
10.6 µm and electric field amplitude E0. The laser light is scattered off fluctuations having a
wavenumber kR, resulting in a separation of the scattered light from the unscattered beam.
This separation is illustrated in Fig. 16, where the object plane is between the lenses. The electric field in this plane is given by
Eimage = E0+ E0
i∆
2 exp(ikRR) + E0 i∆
2 exp(−ikRR), (3)
where ∆ = −λ0rel˜ne is the acquired phase change, re is the classical electron radius, l is
the length of the chord and ˜ne the density fluctuations. By inserting a phase plate at the
object plane, one shifts the phase of the unscattered beam by π/2, resulting in an additional multiplier on the first term in Eq. (3):
EimagePCI = i × E0+ E0
i∆
2 exp(ikRR) + E0 i∆
2 exp(−ikRR). (4)
This phase contrast means that the observed intensity on the photoconductive HgCdTe detectors is IPCI = c 8π|E PCI image| 2 ≈ c 8π|E0| 2(1 + 2∆ cos(k RR)) (5)
when |∆| ¿ 1. The PCI method transforms phase to intensity variations [70].
The number of PCI channels has recently been upgraded from twelve to thirty-two. At the same time the twelve bit, 1 MHz data acquisition system was replaced by a sixteen bit, 10 MHz cPCI setup. Further, new preamps were built having 3 dB points at 5 kHz and 15 MHz; these preamps also have a capability to increase the detector bias current up to the 35 mA detector spec (currently operating at 10 mA). Hardware such as the laser, phase plate and preamps are PLC controlled.
The chord spacing and size is roughly 4 mm, so our coverage of R is 13 cm. The observable wavenumbers can be resolved from 0.5 to 8 cm−1 and we can distinguish between waves
traveling parallel and anti-parallel to R. A setup using AOMs allows the observation of density fluctuations due to mode converted ICRF waves in the 50-80 MHz range; broadband turbulence is observed simultaneously.
The PCI diagnostic can be used to study a large variety of physical processes: For example the nature of broadband turbulence [71–76], Alfv´en cascades associated with low magnetic shear [77, 78], and mode converted ICRF waves [79–83]. As an example of broadband turbulence measurements we show a spectrogram of one of the PCI channels (passing through the core) in Fig. 17. High frequency fluctuations above 2 MHz are observed at the transition from L- to edge localized mode (ELMy) H-mode. Single ELMs are visible as vertical bursts, particularly in the 1.5 MHz range.
The CO2 laser has just been replaced, bringing our laser power up to 60 W. Optics is being
purchased to allow measurements at large wavenumbers (up to 30 cm−1) and a technique to
enable vertical localization of the signal will be implemented [84, 85].
K. Reflectometry
Reflectometry has been widely used to measure density profiles and fluctuations in fusion machines [86]. In reflectometry, millimeter waves are launched toward the plasma and reflected at the cutoff layers. By comparing the signal amplitude and phase of the reflected waves with the launched waves, density profiles, fluctuation levels, and turbulence correlation lengths can be determined. In C-Mod, we have two reflectometry systems: The lower frequency system has a frequency range from 50 GHz to 110 GHz, and the higher frequency system has frequencies of 132 GHz and 140 GHz. Both systems are operated in the ordinary (O) mode where the electric field of the wave is parallel to the magnetic field.
1. Low Frequency System
The lower frequency system consists five channels at frequencies of 50, 60, 75, 88 and 110 GHz. The cutoff densities are in the range of 0.31-1.5 ×10²⁰ m−3, which can be calculated
nc(f0) = (f0/89.8)2, (6)
where f0 is in GHz and ncis in units of 1020 m−3. This system is configured as an amplitude
modulated (AM) reflectometer, see Fig. 18 [87, 88]. The group delay of the wave is calculated from the phase difference between the AM generated upper sideband (f0+ ∆f ) and lower
sideband (f0 − ∆f ), dφ/df ' ∆φ/2∆f , where ∆f is the modulation frequency. We can
calculate the cutoff layer using the following equation:
Rc(f0) = Redge− Z f0 0 c 2π dφ df df pf2 0 − f2 . (7)
By combining Eqs. (6) and (7), a density profile can be obtained. The fluctuations of the group delay can also be used to monitor density fluctuations near the cutoff layer. The 88 GHz channel is specially configured so that it can measure both group delay and baseband fluctuations. The baseband fluctuations are used to monitor fluctuations more sensitively than the group delay fluctuations [89, 90].
The reflectometer provided edge profile measurements in both L- and H-mode plasmas. After the installation of the edge TS system, which has a better spatial resolution, the reflectometer is mainly used as a fluctuation diagnostic.
The reflectometer in C-Mod was the first diagnostic that observed the signature fluc-tuations, which was later dubbed the QC-mode, in the pedestal of EDA H-modes. The reflectometry observation clearly demonstrated that the QC-mode is associated with the EDA H-mode [88, 90]. To help better interpret the reflectometry observations, a numerical 2D code solving the Maxwell equations with the finite difference time domain scheme and a perfectly matched boundary layer was developed [91]. The code uses a unidirectional transparent method so that the reflected wave is separated from the total wave field. The simulation was able to invert the reflectometry observations to density fluctuation levels under some circumstances. The simulations also revealed the reflectometry sensitivity to the QC-mode, which has a rather small wavelength (kθ ∼ 2-6 cm−1) compared to the
reflec-tometry beam size (a few cm), was due to an enhancement factor by the plasma curvature [92].
2. High Frequency System
The two high frequency reflectometer channels, operating at 132 and 140 GHz respec-tively, are mainly used to probe density fluctuations in the core of the plasma when an ITB is present and at the edge when the H-mode barrier is sufficiently high [93]. The 132 GHz microwaves are reflected at a critical density of 21.6 × 10¹⁹m−3and the 140 GHz microwaves
are reflected at 24.3 × 10¹⁹ m−3. A heterodyne technique is used in these channels and each
channel consists of two Gunn diodes, one generating the waves transmitted to the plasma, and the other one which has a slightly different frequency (300 MHz and 800 MHz for the 132 and 140 GHz channel, respectively) is used as an LO, see Fig. 19. Some power from the main Gunn is used to generate the IF reference frequency. The 132 and 140 GHz waves are combined with a 3 dB coupler into one waveguide which is then tapered to an oversized waveguide that transports the waves via a quartz window to the transmitting antenna inside the tokamak. A separate receiving antenna, which is mounted just below the transmission antenna, is connected to a second oversized waveguide to transport the reflected waves back to the microwave receiver. We have chosen separate transmission and receiving waveguides and antennas in order to avoid interference between spurious reflections of the incoming and the reflected waves. At the microwave receiver the wave guide is tapered down again to the fundamental mode, split in two and fed to the 132 and 140 GHz receiver mixers. The IF signal and reference frequency are connected to an in phase quadrature (IQ) detector which yields the amplitude and phase of the reflected waves.
As an illustration of the high frequency system we show a spectrogram of the 132 GHz reflectometer in Fig. 20. The discharge and time window is the same as shown for PCI in Fig. 17. The highest density of the plasma is below cutoff up to 1.27 s, where reflection off the plasma commences. This is about 70 ms after the transition from L- to ELMy H-mode. For roughly 100 ms after cutoff is reached, ELMs are clearly observed as vertical bursts. The observed ELMs transition to featureless broadband turbulence between 1.4 and 1.45 s. Electron density profile measurements made using TS do not show a clear change in density, so the cause of this modification is not obvious. ELMs continue to exist until 1.5 s as seen by e.g. PCI and Dα light diodes. The TS data localizes the reflectometer cutoff layer to be
III. PLASMA BOUNDARY
A. Video Cameras
C-Mod uses video cameras routinely for both scientific and operational purposes [94, 95]. There are typically about six video cameras with views of the plasma. These cameras are generally of quite small size so that they can fit into re-entrant tubes with views behind vacuum windows. They operate inside the toroidal field coils and as such are subjected to high Bφ. Most of the cameras’ images are distributed on a closed-circuit TV system,
as well as being digitized and archived. The scientific uses for the cameras have included tomographic reconstructions of 2D poloidal emissivities [96], gas-puff plume experiments [97, 98], diagnosis of the inboard scrape-off layer (SOL) [99] and divertor private flux zone [100], multifaceted asymmetric radiation from the edge (MARFE) examinations [101], providing constraints on divertor and edge simulations [102, 103] and evaluations of the ion sink due to volume recombination in the divertor plasma. In addition to these scientific studies, the cameras serve as an aid for machine operation. With wide view coverage of the plasma facing components and in-vessel structures (e.g. the ICRF antennas and in-vessel hardware), the cameras are used as general plasma monitors, to identify impurity injection locations and to identify failures of in-vessel components. The view of one of the monitor cameras is shown in Fig. 21, in which plasma light illuminates the central column, two of the ICRF antennas and a local in-vessel mirror used by another camera.
B. Vacuum UV Spectrometry
C-Mod relies on quantitative analysis of emission spectra in the soft X-ray and vacuum ultraviolet (VUV) spectral regions for diagnostic information, since much of the power radi-ated from the plasmas is emitted here. A time-resolving grazing-incidence spectrograph is used to monitor emission in these regions. It utilizes a microchannel plate and 1024 element diode array as its spectrally resolving detector. It has been used with 300, 600 and 1200 line/mm gratings, providing spectral coverage from 8 to 170 nm, 4 to 114 nm and 2 to 57 nm, respectively. With the 600 line/mm grating the best spectral resolution is 0.1 nm. The detector is moved shot-to-shot to view from 4 to 9 nm of the spectral range at one time. The time resolution of the detector is programmable with a minimum of 2 ms. Since the
informational content of the measured spectra is greater if the spectrograph sensitivity is absolutely calibrated, the instrument was calibrated between 2 and 12 nm using a low power X-ray source with a proportional counter serving as an absolute detector [104]. In addition, in situ calibration using branching ratios is accomplished at several wavelengths from 25 nm to 102.6 nm using emission lines from H and He [105].
The spectrograph has been utilized in a number of ways on C-Mod. It is a monitor of intrinsic impurities, typically B, C, O, Fl and Mo, as well as for impurities introduced into the plasma for diagnostic purposes (e.g. Ne, Ar, or metals injected via laser blowoff). The spectrograph has been used for studies of impurity transport, impurity penetration and screening [106, 107], divertor power dissipation [6, 108], divertor volume recombination and opacity and radiation transport of H Lyman series lines [109]. An example of a spectrum of the high-n Lyman series is shown in Fig. 22, where the typical spectral resolution is shown and where a low electron temperature of 0.75 eV is obtained from the slope of the radiative recombination continuum emission coming from a detached divertor plasma [110]. Because of the strong interest in Mo (the plasma facing components in C-Mod are Mo tiles), another instrument employing high-throughput multi-layer mirrors has been used for dedicated monitoring of Mo emission at three different wavelengths [111].
C. Gas-Puff Imaging
As part of our studies of the plasma edge and SOL, a set of optical diagnostics has been developed. In order to overcome the disadvantage that passive optical diagnostics have, of integrating emission along their lines-of-sight, we developed an experimental technique designated gas-puff imaging (GPI) [112, 113]. Localized imaging is accomplished by viewing emission from a gas puff. Emission from the gas-puff is typically much greater (≥ 5 times) than any intrinsic emission along the line-of-sight. As shown in the schematic of the GPI system, Fig. 23, the sight lines are configured to cross the gas-puff, thus providing the spatial localization. Gas-puff barrels are located on both the inboard and outboard side, near the plasma midplane and typically only 1-3 cm from the separatrix. The outboard gas-puff is viewed by two arrays, one made using discrete fibers whose focal spots are arranged radially in front of the barrel and typically 3-4 mm in diameter. The fibers transmit light to filtered photodiodes with high sensitivity and flat frequency response for frequencies ≤ 250 kHz. A
coherent fiber bundle is also employed to image the emission in front of the barrel in 2D. The view is parallel to the local magnetic field and thus images the structure of the emission perpendicular to the field. The 2D image is transmitted either to movie cameras capable of very fast (up to 1 MHz) frame rates [114] or to gated snapshot cameras with high spatial resolution (1-2 mm) [115]. Both of these GPI systems have been used to study edge and SOL turbulence as it is manifested in the emission [115, 116]. An inboard gas-puff is also viewed using a radially-resolving array of fibers. The array-views span the inboard separatrix and are used to compare the turbulence at the inboard side to that on the outboard side [116].
D. Visible Spectrometers
Owing to the suitability of their use with optical fibers both inside and outside the vacuum vessel, visible spectroscopic diagnostics are used extensively on C-Mod. By coupling multiple fibers to spectrometers with 2D detectors, visible spectra from multiple views are routinely measured. An extensive system of views, including views of the divertor plates, inner wall, ICRF antennas and the limiters exist. The spectra measured using these views and spectrometers of medium (∆λ ∼ 0.15 nm) and high (∆λ ∼ 0.006 nm) resolution have been used in a number of diagnostic applications. Typically the views and spectrometers are absolutely calibrated, so that absolute brightnesses are available. Some of the applications include:
• Determination of impurity source rates at various in-vessel locations [117, 118]; these are valuable in studies of plasma-wall interactions, which include studies of impurity generation and screening.
• Diagnosis of three-body and radiative recombination in the divertor [109, 119–122] and in MARFEs [101].
• Measurements of ne in regions where high-n H Balmer series emission is strong [119,
123–125].
• Measurements of Te (using the observed Saha-Boltzmann population of upper state
levels) in regions where H Balmer series emission is strong [101]. An example of a high-n Balmer series spectrum (from D ihigh-n the divertor) is showhigh-n ihigh-n Fig. 24, where dehigh-nsity- density-broadened lines, recombination continuum and an intensity distribution indicative of
a Saha-Boltzmann population of the levels and of a recombining plasma are evident. Note that the Lyman series analog to this spectrum is shown in Fig. 22.
• Localization of Dα emission using the Zeeman patterns [126].
• Measurement of bulk flows of neutral H and ions, both in the divertor and SOL [127– 129].
E. Soft X-Rays
The soft X-ray imaging system on C-Mod has four arrays, all at the same toroidal location. Each of these consists of a thirty-eight element photodiode detector array from EG&G which fits in a standard forty pin dual in-line package (DIP) socket. The detectors were all relatively calibrated to 0.5 % using the 5.9 keV Cu Kα line from a commercial X-ray tube. In
order to have sufficient coverage of the plasma cross section, the X-ray arrays were designed to be small enough to mount inside the vacuum vessel, and therefore constructed out of materials suitable for ultra-high vacuum and compatible with the 150◦ C bakeout [130]. The detectors are run with zero bias voltage (photovoltaic mode) in order to reduce the dark current while still affording a 3 µs time response. X-ray photons hitting the detector elements yield a signal current (hundreds of nA to hundreds of µA) directly proportional to the absorbed photon energy flux. A Be foil over the collimating aperture of each array box filters out visible, UV, and ultra-soft X-rays. The array components have been designed with very tight-tolerance press-fit pins between critical components so that the aperture, cover plate, and detector chip can all be removed and reassembled without changing the viewing geometry alignment. Since the arrays are contained in ultra-high vacuum, the Be foils do not function as vacuum windows. This allows for optimization of the foil shape. The Be foil in each array is formed into a semi-circular shape centered on the aperture so that each viewing chord passes through the same foil thickness. Originally, all four arrays were set up to each view the entire plasma cross section and the Be foils were chosen to be 50 µm thick (2 keV 50% cutoff). More recently one or two arrays have been modified to give a high-resolution view of the plasma edge for H-mode pedestal studies [131], and these utilize 10 µm Be foils (500 eV 50% cutoff), since the edge plasma is cooler than the core. The signal current from each element is carried by a semi-rigid coaxial cable, with the coaxial shield
at circuit ground. The thirty-eight coaxial cables from each array are bundled together, surrounded with an electrically-insulating sleeve, and inserted into a protective, flexible stainless steel conduit which is at machine ground. The conduits bring the coaxial bundles down through a vertical port to the underside of the machine, where each coaxial cable is attached to a coaxial vacuum feedthrough. The feedthrough flanges are electrically isolated from the machine. External coaxial cables feed the signals to transimpedance amplifiers, programmable gain amplifiers and digitizers.
The multiple poloidal views of the core-viewing arrays allow for tomographic reconstruc-tion of the local 2D X-ray emissivity using a Fourier-Bessel expansion algorithm [132]. The radial spatial resolution is 2.5 cm. Tomographic reconstructions are done automatically between shots and archived along with the rest of the C-Mod data. More detailed recon-structions can also be done manually and saved as well.
In order to study the H-mode edge pedestal, one of the core X-ray arrays was modified to look at the plasma edge region with high spatial resolution by narrowing the view fan and using a much thinner Be window (10 µm). This was accomplished by retrofitting a snout-like structure onto the array box to move the collimating aperture much further from the detector chip and decreasing the slit width in the poloidal direction.
F. Probe Measurements
Fig. 25 shows the locations of a number of probe diagnostics on C-Mod. These include fixed Langmuir probes (divertor probes, limiter flux probes), fast-scanning Langmuir probes (outer, vertical, inner probes), a scanning gas-puffing probe (vertical probe), a scanning magnetic probe (outer probe), divertor heat flux probes and a movable ion mass spectrometer probe (omegatron).
1. Divertor Langmuir Probes (FMP)
Langmuir probes are embedded into the surface of the inner and outer divertor plates. These consist of 4 mm diameter ceramic-coated Mo or W pins. Prior to the installation of new vertical-plate geometry (August 2001), six triplets of three toroidally spaced probes were located at six poloidal locations in the inner divertor. Single probes at sixteen poloidal
locations are presently used, see Fig. 25. The outer divertor has triplets at sixteen poloidal locations. The original intent of the triplet configuration was to infer plasma conditions using a triple-probe bias method [133] with each probe surface flush to the divertor surface (i.e. a flush-mount probe (FMP) array). However, owing to problems associated with the interpretation of probe characteristics at small oblique field line angles [134], one probe in each triplet was converted to a proud geometry and operated in a conventional swept-voltage manner. Before July 1995, Mo probes were used, extending 0.5 mm beyond the surface of the divertor and presenting a domed surface to the plasma flux. W replacements were installed by October 1995, also extending 0.5 mm beyond the surface but having a ramped surface, presenting a 10◦ angle with respect to incident field lines. Plasma density and temperature
profiles across the divertor surface are typically deduced at 10 ms intervals by fitting current-voltage characteristics using standard magnetized probe theory [135]. The probes have operated continuously since the first C-Mod plasma in 1993 with periodic replacement of damaged (melted) electrodes. The probe arrays have provided vital information on divertor phenomena, including the physics of different parallel heat transport regimes and plasma detachment [136], in/out divertor asymmetries and their connection to plasma drifts [137, 138] and thermoelectric currents [138].
2. Limiter Particle Flux Probes
In order to more fully investigate the phenomenon of main chamber recycling in C-Mod [139], a set of eight probes was installed (May 2001) on either side of the two toroidally discrete outboard limiters in the device (one such limiter is shown in Fig. 25). They consist of 2 mm diameter W wires spanning a 14 mm zone from the leading edge into the limiter shadow. These particle flux probes are biased at a fixed negative voltage and measure the integral of the ion saturation flux density over the local SOL in contact with the limiter. Measurements from the probes have detected a high level of plasma flux to limiter surfaces, correlated with the change in cross-field plasma transport as the collisionality of the edge plasma increases [140, 141].