Publisher’s version / Version de l'éditeur:
Medicinal Chemistry Research, 19, 9, pp. 1153-1161, 2010-12-01
READ THESE TERMS AND CONDITIONS CAREFULLY BEFORE USING THIS WEBSITE.
https://nrc-publications.canada.ca/eng/copyright
Vous avez des questions? Nous pouvons vous aider. Pour communiquer directement avec un auteur, consultez la
première page de la revue dans laquelle son article a été publié afin de trouver ses coordonnées. Si vous n’arrivez pas à les repérer, communiquez avec nous à PublicationsArchive-ArchivesPublications@nrc-cnrc.gc.ca.
Questions? Contact the NRC Publications Archive team at
PublicationsArchive-ArchivesPublications@nrc-cnrc.gc.ca. If you wish to email the authors directly, please see the first page of the publication for their contact information.
NRC Publications Archive
Archives des publications du CNRC
This publication could be one of several versions: author’s original, accepted manuscript or the publisher’s version. / La version de cette publication peut être l’une des suivantes : la version prépublication de l’auteur, la version acceptée du manuscrit ou la version de l’éditeur.
For the publisher’s version, please access the DOI link below./ Pour consulter la version de l’éditeur, utilisez le lien DOI ci-dessous.
https://doi.org/10.1007/s00044-009-9259-8
Access and use of this website and the material on it are subject to the Terms and Conditions set forth at
Monitoring of 3D breast carcinoma cell culture using proton magnetic resonance imaging
Bartusik, Dorota; Tomanek, Boguslaw; Fallone, Gino
https://publications-cnrc.canada.ca/fra/droits
L’accès à ce site Web et l’utilisation de son contenu sont assujettis aux conditions présentées dans le site LISEZ CES CONDITIONS ATTENTIVEMENT AVANT D’UTILISER CE SITE WEB.
NRC Publications Record / Notice d'Archives des publications de CNRC: https://nrc-publications.canada.ca/eng/view/object/?id=c99e42a5-9720-4881-8477-3fed3823e800 https://publications-cnrc.canada.ca/fra/voir/objet/?id=c99e42a5-9720-4881-8477-3fed3823e800
Monitoring of 3D breast carcinoma cell culture using proton magnetic
resonance imaging
Bartusik, Dorota; Tomanek, Boguslaw; Fallone, Gino
Abstract
We studied two human mammary carcinoma cell lines, MCF-7(NEO-4) HER-2 negative and MCF-7(HER-2) HER-2 positive, in three-dimensional culture. The aim of the study was to determine the glycosaminoglycan (GAG) concentration in breast cancer cell growth ex vivo. We found that GAG concentration produced by both breast cancer cell lines can be measured with high-field magnetic resonance imaging.
Keywords Breast cancer cells - Glycosaminoglycan - Magnetic resonance imaging
Introduction
Extracellular matrix (ECM) plays a critical role in cell fate and function (Flaim et al., 2005). The
reason for failure of cancer chemotherapeutic treatment is inadequate drug delivery through the cellular microenvironment, which creates a barrier to therapeutic agents (Jain, 1994; Jang et al., 2003). Therefore, study of the ECM could provide valuable information on tumor development
and for drug discovery (McNeish, 2004).
The ECM is a heterogeneous collection of covalent and noncovalent molecular interactions between primary protein and glycosaminoglycan (GAG). GAG forms a long carbohydrate in breast cancer tissue (Everts and Buttle, 2008) and due to its negative charge attracts ions
(Mareel, 1979). It was shown that cancer cells developed negative charge in response to
biochemical changes in the cellular microenvironment (Muir, 1983). In breast pathogenesis
quantitative changes in GAG may have important consequences on cells’ proliferation and drug delivery (Eschenko et al., 2007). Considering the importance of GAG monitoring in small tissue
samples (Ling et al., 2008) several techniques have been used to measure GAG content in vitro.
These methods are based on high-performance liquid chromatography (HPLC) (Studelska et al.,
2006), mass spectrometry (MS) (Harvey, 2006), electrophoresis (Jaffe, 1977), and
immunofluorescence (Altman et al., 1993). Yet, to provide another method, we studied the ECM
using contrast-enhanced Gd(DTPA)2− magnetic resonance imaging (MRI). In our study we investigated GAG content in three-dimensional (3D) ex vivo breast cancer cell cultures using measurements of proton (1H) T1 relaxation time. Penetration of Gd(DTPA)2− into cancer cells was monitored through T1 calculated images obtained after injection into 3D culture.
Two-dimensional (2D) breast cancer cell cultures have been used for many years for in vitro applications. However, 2D culture does not reveal function of cells observed in a 3D culture (Abbot, 2003) or a concentration which is high enough to be able to detect them by MRI (Sawyer et al., 2008).
Breast cancer cells are very sensitive to changes in their microenvironment and behave more like their in vivo counterparts when they are in 3D culture (Abbot, 2003). It is also recognized that
cellular behavior of 3D cultures is closer to the natural physiology of tumors (Abbot, 2003). In
addition, 3D ex vivo systems consisting of breast tumor cell lines such as MDA-MB-231 have also been shown to recapitulate the drug sensitivities of tumor cells grown in vivo (Debnath et al., 2003).
It has been established that 3D culture in a hollow-fiber bioreactor simulates in vivo an environment which is favorable for tissue growth and simulates particularly well the spatial organization of solid tumors (Malone et al., 2001). The bioreactor utilizes hollow fibers to
deliver nutrients and to remove waste from an agitated cell suspension. Furthermore, hollow-fiber bioreactors, unlike other cell culture techniques, provide a porous support for cell attachment and resemble in vivo conditions.
To this day there is no generally applicable direct GAG mapping technique available (Ling et al.,
2008), despite the high GAG content in breast cancer tissue (Delehedde et al., 2001). Thus, for
MRI study, we used 3D high-density cell cultures.
Materials and methods
3D breast cancer cell cultures
We used two breast cancer cell lines, MCF-7(HER-2) and MCF-7(NEO-4), obtained from the American Type Culture Collection (ATCC; Manassas, VA, USA). All compounds for cell
culture were supplied by Fisher Scientific (Ottawa, ON, Canada). Both cell lines were cultured in RPMI-1640 medium, 5% fetal bovine serum, 2 mM L-glutamine, 50 U/ml penicillin, and
50 μg/ml streptomycin. All cell culture procedures were conducted in a sterile level II safety cabinet. Cells were maintained in tissue culture flasks and were cultured as a monolayer prior to seeding in the hollow-fiber bioreactor (FiberCell Systems Inc., Frederick, MD, USA). When the number of cells in the culture flask reached 0.5 × 10⁷ cells/ml, the culture was harvested and then inoculated into the hollow-fiber bioreactor. The hollow-fiber bioreactor consists of porous
hydrophilic hollow fiber of 0.1-μm pores placed in polysulfone tubing. We used a collagen solution to create an ECM between cells and fiber. The polysulfone fiber was coated with protein by flushing with 10 ml of coating solution containing 1 mg collagen per 1 ml phosphate-buffered saline (PBS). After the inoculation, the hollow-fiber bioreactor was perfused using a peristaltic pump. The flow of medium started at the rate of 5 ml/min and was gradually increased to
14 ml/min. The pH in the extracapillary space was maintained at between 6.8 and 7.0 throughout the experiments. The perfusion medium was changed weekly when the glucose level reached 2 g/l measured by glucometer. Breast cancer cells were allowed to grow in the hollow-fiber bioreactor until their density reached 109 cells/ml. The number of cells was determined using the Trypan blue (Sigma-Aldrich, Oakville, ON, Canada) exclusion method (Takahashi and Loo,
2004). Additionally, we used glucose monitoring to count the cells, assuming that the
consumption of 1 g of glucose per day corresponds to 109 cells inside the hollow-fiber bioreactor (Kirstein et al., 2006). Eighteen hollow-fiber bioreactors were used for the study: six for
Magnetic resonance imaging
Throughout the MRI experiments, hollow-fiber bioreactors were maintained under incubator-like conditions (37°C, 5% CO2, and 95% air). All MRI experiments were performed using a 9.4-T, 21-cm-bore magnet (Magnex, UK) and TMX console (NRC-IBD, Canada). Water proton longitudinal (T1) relaxation times of both cell lines were measured using an inversion recovery (IR) pulse sequence with an cho time (TE) of 16.5 ms, a repetition time (TR) of 8000 ms, and eight inversion times (TIs)—10, 100, 200, 400, 800, 1000, 2000, and 4000 ms. T2 relaxation times were measured using a multi-echo spin-echo (SE) pulse sequence with a TR of 8000 ms and 11 echoes 10 ms apart, with the first TE 16.5 ms. The imaging plane was perpendicular to the long axis of the bioreactor. The field of view was 3 × 3 cm, the slice thickness 2 mm, and the matrix size 256 × 256.
Glycosaminoglycan
The GAG concentration was calculated based on the fixed charge density (FCD) value (Donahue et al., 1997), which was measured by flushing the culture with Gd(DTPA)2– (Berlex, USA). The
FCD can be expressed as (1) where (1a) and (1b) where bath is the medium around breast cancer cells; R, the relaxivity (mmol/l/s); tissue, breast cancer cell tissue; the concentration of Na+ ions in the bath (154 mM);
the T 1 relaxation time of breast cancer cells after administration of Gd(DTPA)2− solution (s); the T 1 relaxation time of breast cancer cells before
administration Gd(DTPA)2– solution (s); the T 1 relaxation time of the bath after administration of Gd(DTPA)2− solution (s); and the T 1 relaxation time of the bath before administration of Gd(DTPA)2− solution (s).
The calculated FCD was converted to GAG concentration according to Lesperance et al., (1992):
where GAG is the glycosoaminoglycan concentration (mg/l), the FCD is millimolar concentration; and 502.5 is the molecular weight of GAG (mg/mmol).
To measure GAG concentration, Gd(DTPA)2− solution was injected into the bioreactor perfusion tubing flow of the medium. The injected volume was calculated to give the final concentration 2 mM Gd(DTPA)2− (Donahue et al., 1994). Medium with Gd(DTPA)2– was circulated constantly
through the bioreactor using the peristaltic pump. Constant T1 was achieved 24 h after the injection of Gd(DTPA)2− solution. For calculations of T1 relaxation times, MAREVISI (NRC-IBD, Canada) software was used.
Water content
After MRI analysis, 2 mg cells was extracted from the bioreactor and weighted to determine the wet weight. Dry weight was determined by drying the tissue samples at 110°C until constant weight was achieved. The percentage water content was determined from the wet and dry weights.
Data analysis
All data reported here are from sets of six separate experiments. Results are expressed as mean ± standard deviation. Data were analyzed using the Sigma Stat Soft (Chicago, IL, USA) software. The reproducibility of the assay was demonstrated by analyzing with MRI 10 identical samples of the GAG (Sigma) water solution with a concentration of 5 mg/ml. The MRI
procedure used exactly the same parameters as for real samples of cells. The GAG solution was introduced to tubes of 50-ml volume and measured at 37°C. Moreover, the reproducibility was determined using two samples of MCF-7 (HER-2) and MCF-7(NEO-4) cells after 7 weeks in culture, and 10 identical MRI measurements were repeated.
Results and discussion
In our experiment, we cultured 3D ex vivo human breast carcinoma cells using a hollow-fiber bioreactor over 7 weeks. The cell concentration provided by the bioreactor was sufficient for MRI study. The total cell content in the hollow-fiber bioreactor increased from 0.5 × 10⁷ to 1 × 10⁹ during culture. The hollow-fiber bioreactor was placed inside the magnet and removed without disturbing the regions of cells. Furthermore, multiple MRI measurements of the same cells were performed.
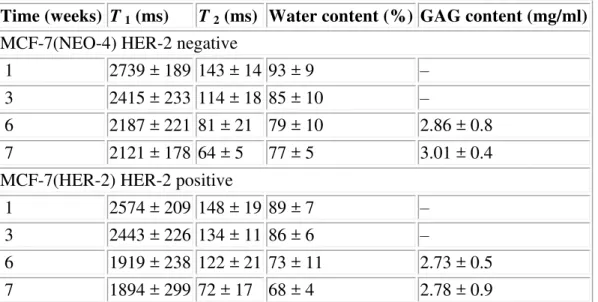
Over time in culture the water content decreased significantly for 7(NEO-4) and MCF-7(HER-2) cells, from 93 ± 9% to 77 ± 5% and from 89 ± 7% to 68 ± 4%, respectively. The T 1 relaxation time of MCF-7(NEO-4) decreased during the 7 weeks from 2739 ± 189 to
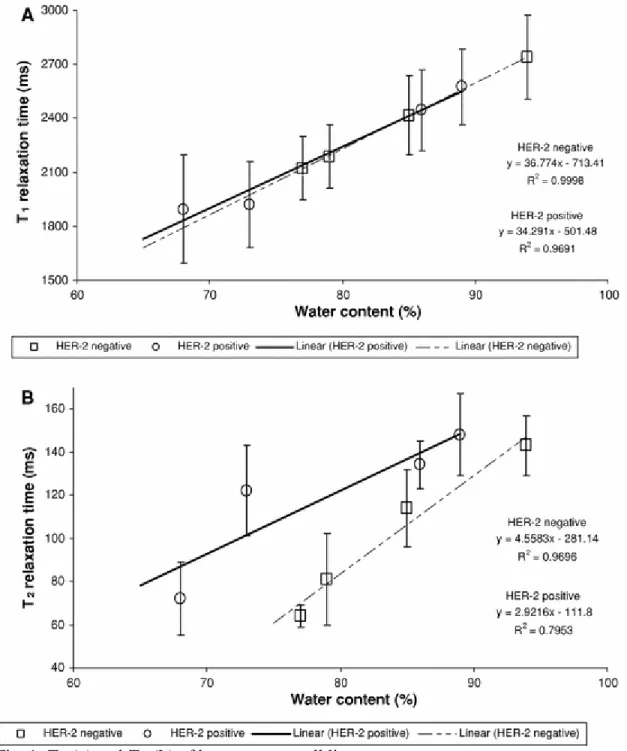
2121 ± 178 ms, and T 2 from 143 ± 14 to 64 ± 5 ms. T 1 measurements of MCF-7(HER-2) showed a decrease from 2574 ± 209 to 1894 ± 299 ms; and T 2 measurements, from 148 ± 19 to 72 ± 17 ms. Values of T 1, T 2, and water content after inoculation are presented in Table 1 for MCF-7(NEO-4) HER-2 negative and MCF-7(HER-2) HER-2 positive, respectively. Correlations between tissue water content and relaxation times T 1 and T 2 were linear (Fig. 1). Changes in
GAG concentration were measured for both cell lines when the number of cells in the culture reached a high density, at weeks 6 and 7. GAG concentrations were 2.86 ± 0.8 and
2.73 ± 0.5 mg/ml, and 1 week later 3.01 ± 0.4 and 2.78 ± 0.9 mg/ml, for MCF-7(NEO-4) and MCF-7(HER-2), respectively (Table 1).
Table 1 MRI tissue parameters and GAG content: mean ± SD
Time (weeks) T 1 (ms) T 2 (ms) Water content (%) GAG content (mg/ml)
MCF-7(NEO-4) HER-2 negative
1 2739 ± 189 143 ± 14 93 ± 9 – 3 2415 ± 233 114 ± 18 85 ± 10 –
6 2187 ± 221 81 ± 21 79 ± 10 2.86 ± 0.8 7 2121 ± 178 64 ± 5 77 ± 5 3.01 ± 0.4 MCF-7(HER-2) HER-2 positive
1 2574 ± 209 148 ± 19 89 ± 7 – 3 2443 ± 226 134 ± 11 86 ± 6 –
6 1919 ± 238 122 ± 21 73 ± 11 2.73 ± 0.5 7 1894 ± 299 72 ± 17 68 ± 4 2.78 ± 0.9
Fig. 1 T 1 (a) and T 2 (b) of breast cancer cell lines
MCF-7 (NEO-4) cells measured for reproducibility after 7 weeks in culture showed GAG concentrations with a mean value of 2.74 mg/ml and a standard deviation of 0.26 mg/ml. For a sample of MCF-7 (HER-2) cells the mean GAG concentration was 2.53 mg/ml, with a standard deviation of 0.25 mg/ml. Samples with a known GAG concentration of 5 mg/ml, considered in the reproducibility test, were found to have GAG concentrations ranging from 4.52 to
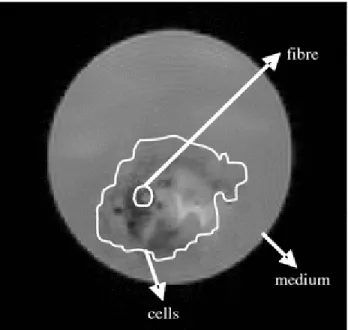
Figure 2 shows an example of a proton MR image of the bioreactor with a fiber. The results of the study demonstrated that the GAG concentration in human breast carcinoma cells can be measured and quantified using ex vivo MRI. In addition, GAG concentrations determined in our study correspond to the concentration measured in human breast cancer tissue, which is
≥5 mg/ml (Marotta et al., 1985). It was found previously that proton T 1 relaxation time depends
on tissue composition (Chatell et al., 1986) and that the decrease in T 1 in carcinoma cell cultures
is caused by the decrease in water content and increase in macromolecular matrix components (Stack et al., 1990). We contribute the changes in T 1 and T 2 during cell growth observed for
both cell lines to the changes in tissue hydratation and protein content. In addition, our study showed that proton T 1 and T 2 relaxation times are not significantly different between the two cell lines.
Fig. 2 Proton MR image. MCF-7 breast cancer cells surround the fiber (6 weeks after inoculation). A spin-echo pulse sequence was used, with the following parameters: TR/TE, 8000/16.5 ms; FOV, 3 × 3 cm; matrix, 256 × 256; and slice thickness, 2 mm. The solid line delineates tumor cells
Application of MRI to study of cancer cells has several significant advantages over
chromatographic, mass spectrometric, and electrophoretic methods because it enables direct study of cells before and after treatment, avoiding the problems stemming from chemical derivatization and from pH sensitivity. Moreover, all these methods require special preparation of the sample to make the compound detectable and to increase the efficacy of measurements. However, MRI can be used in diagnostic applications to continuously monitor amounts of GAG in cell culture without preisolation and special preparation. MRI assay is performed in one step and on live cells during measurements and can provide more information on the physiology and metabolism of cancerous cell cultures. The T 1 and T 2 relaxation times of cells are sensitive to molecular structure and architecture, and have been shown to demonstrate changes in
anatomically intact tissue ex vivo. Moreover, MRI measurements of cells with using the anionic paramagnetic contrast agent Gd(DTPA)2− reflect directly the GAG concentration in tissue and are sensitive to physiologic and pathologic conditions, resulting in an approximately linear
relation between GAG content and T 1 relaxation time. The implemented experimental system provided controlled conditions and allowed for reproducible experimental setup, as well as quantification. Moreover, multiple MR measurements of the same cells can be performed, as the entire bioreactor can be placed inside the magnet and removed without disturbing the cells. In this manner, the progress of accumulation of ECM can be observed over the course of time and the consistent changes in water content resulting in changes in T 1 and T 2 values. Moreover, the MRI technique involves cellular administration of the negatively charged contrast agent
Gd(DTPA)2−, which requires sufficient time to penetrate the high-density cell culture. For correct evaluation of GAG using MRI of cells, T 1 measurements need to be done at the exact time of cell growth. One important restriction with these techniques is that they measure strong
interactions of Gd(DTPA)2− with cancer cells and require high cell densities. Since GAGs have negatively charged side chains, Gd(DTPA)2− is distributed at higher concentrations in areas with lower GAG concentrations. Therefore, a low T 1 value after administration of contrast agent indicates a low GAG concentration.
The development of breast cancer cells is very intricate and a better understanding of the roles of many more proteins involved in cancer is still needed. The research presented here provides information on various GAG concentrations but also it might also reveal the barrier of drug delivery to cancer tissue in tumors. Our results show the possibility of using MRI for direct GAG quantification in breast cell cultures. According to our knowledge, these are the first studies of 3D breast cell cultures using high-field MRI to determine GAG concentration.
References
Abbot A (2003) Cell culture: biology’s new dimension. Nature 424:870–872
Altman SA, Randers L, Rao G (1993) Comparison of trypan blue dye exclusion and fluorometric assays for mammalian cell viability determinations. Biotechnol Prog 9:671–674
Chatell M, Darcel F, Certaines F, Benoist L, Bernard AM (1986) T1 and T2 proton nuclear magnetic resonance relaxation times in vitro and human intracranial tumours. J Neuro Oncol 3:315–321
Debnath J, Muthuswamy SK, Brugge JS (2003) Morphogenesis and oncogenesis of MCF-10A mammary epithelial acini grown in three-dimensional basement membrane cultures. Methods 30(3):256–268
Delehedde M, Lyon M, Sergeant N, Rahmoune H, Fernig DG (2001) Proteoglycans:pericellular and cell surface multireceptors that integrate external stimuli in the mammary gland. J Mammary Gland Biol Neoplasia 6:253–273
Donahue KM, Burstein D, Manning WJ, Gray ML (1994) Studies of Gd-DTPA relaxivity and proton exchange rates in tissue. Magn Reson Med 32:66–76
Donahue KM, Weisskoff RM, Burstein D (1997) Water diffusion and exchange as they influence contrast enhancement. J Magn Reson Imaging 7:102–110
Eschenko TY, Rykova I, Chernakow AE, Sidorov SV, Grigoriewa EV (2007) Expression of different proteoglycans in human breast tumors. Biochemistry (Mosc) 72(9):1016–1020
Everts V, Buttle DJ (2008) Methods in studying ECM degradation. Methods 45(1):86–92
Flaim CJ, Chien S, Bhatia SN (2005) An extracellular matrix microarray for probing cellular differentiation. Nat Methods 2:119–125
Harvey DJ (2006) Analysis of carbohydrates and glycoconjugates by matrix-assisted laser desrption/ionization mass spectrometry: an update covering the period 1999–2000. Mass Spectrom Rev 25(4):595–662
Jaffe L (1977) Electrophoresis along cell membrane. Nature 265:600–602
Jain RK (1994) Barriers to drug delivery in solid tumors. Sci Am 271:58–65
Jang SH, Wientjes MG, Lu D, Au JL (2003) Drug delivery and transport to solid tumors. Pharm Res 20(9):1337–1350
Kirstein MN, Brundage RC, Elmquist WF, Remmel RP, Marker PH, Guire DE, Yee D (2006) Characterization of an in vitro cell culture bioreactor system to evaluate anti-neoplastic drug regimens. Breast Cancer Res Treat 96:203–301
Lesperance LM, Gray ML, Burstein D (1992) Determination of fixed charge density in cartilage using nuclear magnetic resonance. J Orthop Res 10(1):1–13
Ling W, Regatte RR, Navon G, Jerschow A (2008) Assessment of glycosaminoglycan
concentration in vivo by chemical exchange-dependent saturation transfer (gagCEST). Proc Natl Acad Sci USA 105(7):2266–2270
Malone CC, Schiltz PM, Mackintosh A, Beutel LD, Heinenman SF, Dillman RO (2001) Characterization of human tumor-infiltrating lymphocytes expanded in hollow fiber bioreactor. Cancer Biother Radiopharm 16(5):381–390
3(8):627–640
Marotta M, D’Armiento FP, Martino G, Donato G, Nazzaro A, Vecchione R, Rosati P (1985) Glycosaminoglycans in human breast cancer: morphological and biochemical study. Appl Pathol 3(3):164–169
McNeish J (2004) Embryonic stem cells in drug discovery. Nat Rev Drug Discov 3:70–80
Muir H (1983) Proteoglycans as organizers of the intercellular matrix. Biochem Soc Trans 11:613–622
Sawyer NB, Worrall LK, Crowe JA, Waters SL, Shakesheff KM, Rose FR, Morgan SP (2008) In situ monitoring of 3D in vitro cell aggregation using an optical imaging system. Biotechnol Bioeng 100(1):159–167
Stack JP, Redmond OM, Codd MB, Dervan PA, Ennis JT (1990) Breast disease: tissue characterization with Gd-DTPA enhancement profiles. Radiology 174(2):491–494
Studelska DR, Giljum K, McDowell LM, Zhang L (2006) Quantification of glycosaminoglycans by reversed-phase HPLC separation of fluorescent isoindole derivatives. Glycobiology 16(1):65– 72
Takahashi K, Loo G (2004) Disruption of mitochondria during tocotrienol-induced apoptosis in MDA-MB-231 human breast cancer cells. Biochem Pharmacol 67:315–324