Publisher’s version / Version de l'éditeur:
Vous avez des questions? Nous pouvons vous aider. Pour communiquer directement avec un auteur, consultez la première page de la revue dans laquelle son article a été publié afin de trouver ses coordonnées. Si vous n’arrivez pas à les repérer, communiquez avec nous à [email protected].
Questions? Contact the NRC Publications Archive team at
[email protected]. If you wish to email the authors directly, please see the first page of the publication for their contact information.
https://publications-cnrc.canada.ca/fra/droits
L’accès à ce site Web et l’utilisation de son contenu sont assujettis aux conditions présentées dans le site LISEZ CES CONDITIONS ATTENTIVEMENT AVANT D’UTILISER CE SITE WEB.
13th International Symposium on Aerodynamics and Ventilation of Vehicle
Tunnels [Proceedings], pp. 389-402, 2009-05-13
READ THESE TERMS AND CONDITIONS CAREFULLY BEFORE USING THIS WEBSITE. https://nrc-publications.canada.ca/eng/copyright
NRC Publications Archive Record / Notice des Archives des publications du CNRC :
https://nrc-publications.canada.ca/eng/view/object/?id=0d39c5d2-3e8e-4195-b390-4987d1c16371
https://publications-cnrc.canada.ca/fra/voir/objet/?id=0d39c5d2-3e8e-4195-b390-4987d1c16371
NRC Publications Archive
Archives des publications du CNRC
This publication could be one of several versions: author’s original, accepted manuscript or the publisher’s version. / La version de cette publication peut être l’une des suivantes : la version prépublication de l’auteur, la version acceptée du manuscrit ou la version de l’éditeur.
Access and use of this website and the material on it are subject to the Terms and Conditions set forth at
Parameters affecting the performance of detection systems in road
tunnels
Liu, Z. G.; Kashef, A.; Lougheed, G. D.; Crampton, G. P.; Ko, Y.;
Hadjisophocleous, G. V.
http://www.nrc-cnrc.gc.ca/irc
Pa ra m e t e rs a ffe c t ing t he
pe rfor m a nc e of de t e c t ion
syst e m s in roa d t unne ls
N R C C - 5 1 3 7 3
L i u , Z . G . ; K a s h e f , A . ; L o u g h e e d , G . D . ;
C r a m p t o n , G . P . ; K o , Y . ; H a d j i s o p h o c l e o u s , G . V .
2 0 0 9 - 0 5 - 1 3
A version of this document is published in / Une version de ce document se trouve dans:
13th International Symposium on Aerodynamics and Ventilation of Vehicle Tunnels, New
Brunswick, New Jersey, 2009-05-13, 389-402
The material in this document is covered by the provisions of the Copyright Act, by Canadian laws, policies, regulations and international agreements. Such provisions serve to identify the information source and, in specific instances, to prohibit reproduction of materials without written permission. For more information visit http://laws.justice.gc.ca/en/showtdm/cs/C-42
Les renseignements dans ce document sont protégés par la Loi sur le droit d'auteur, par les lois, les politiques et les règlements du Canada et des accords internationaux. Ces dispositions permettent d'identifier la source de l'information et, dans certains cas, d'interdire la copie de documents sans permission écrite. Pour obtenir de plus amples renseignements : http://lois.justice.gc.ca/fr/showtdm/cs/C-42
Parameters affecting the performance of detection
systems in road tunnels
Z. G. Liu CAFS Unit Inc
A. Kashef, G.D. Lougheed, and G. Crampton
Fire Research Program, National Research Council of Canada Y. Ko and G. Hadjisophocleous
Department of Civil and Environmental Engineering, Carleton University
ABSTRACT
In 2006, Phase 2 of the International Road Tunnel Fire Detection Research Project was initiated. As part of this project, a series of fire tests were conducted in a laboratory tunnel facility to evaluate the performance of detection systems under limited airflow conditions and longitudinal airflow conditions. In addition, fire tests were also conducted in the Viger tunnel in Montreal. In conjunction with the full-scale experiments, CFD simulations were conducted. The numerical predictions were initially validated against data from a demonstration test and subsequently using the results of selected laboratory and field experiments. Simulations were conducted to investigate the impact of various parameters including fire scenarios, ventilation mode, and tunnel length on fire behaviour and detection system performance. The results of the full-scale experiments conducted in the Viger tunnel roadway tunnel and the results of the numerical simulations are discussed in this paper.
1 INTRODUCTION
A review of detection technologies for use in tunnel applications was completed in Phase I of the International Road Tunnel Fire Detection Research Project [1]. This review indicated that relatively few test programs investigated the performance of fire detection technologies for use in tunnels and that the research mainly focused on the performance of linear heat detection systems and optical flame detectors. Many existing and newly developed fire detection technologies, such as spot heat detectors, smoke detection systems and video imaging detection (VID) systems had not been studied systematically [2].
In 2006, Phase 2 of the International Road Tunnel Fire Detection Research Project was initiated. As part of this project, a series of fire tests were conducted in a laboratory tunnel facility to evaluate the performance of detection systems under limited airflow conditions and with longitudinal airflow in the test facility [3, 4]. In addition, fire tests were also conducted in the Viger tunnel in Montreal [5].
Phase 2 of the International Road Tunnel Fire Detection Research Project also included environmental and demonstration tests in the Lincoln Tunnel. Further information on this aspect of the project is provided in Reference [6].
In conjunction with the full-scale experiments, CFD simulations were conducted [7]. The CFD simulations were initially validated against data produced in a demonstration test conducted in the laboratory tunnel facility. Simulations were then conducted to assist in the preparation of the full-scale experiments. Subsequently, the numerical predictions were further validated against selected experimental data from the laboratory and field experiments. Simulations were used to investigate the impact of different parameters on fire behaviour and detection system performance. The parameters included: fire scenarios, ventilation mode, and tunnel length. Information from the model can be used in developing appropriate test protocols and for understanding and optimising the performance of fire detection systems used for road tunnel protection.
In this paper, the experiments conducted in the Viger tunnel in Montreal are discussed. The results of these experiments are used to illustrate the effect of various parameters on detector response. CFD model simulations of the experiments are also discussed. The results of simulations conducted to investigate the effect of various parameters on conditions in a tunnel are also presented.
2 DETECTION SYSTEMS
Nine fire detection systems that were representative of currently available fire detection technologies for use in tunnels were evaluated in the project. These systems were:
D-1L1: a fiber optic linear heat detection system; D-2L2: a co-axial cable linear heat detection system; D-3F1: a IR3 optical flame detector;
D-4C1: a flame/smoke video image detection (VID) system; D-5C2: a flame/smoke video image detection (VID) system; D-6C3: a flame video image detection (VID) system; D-7H1: a pneumatic and spot-type heat detection system; D-8H2: a rate-anticipation spot heat detector; and D-9S1: a smoke detection system with air sampling.
The detection systems and their sensitivities are summarized in Reference [8]. The system suppliers installed the fire detection systems in the tunnels. Detection systems D-7H1, D-8H2 and D-9S1 were not included in the tests conducted in the Viger Tunnel. The sensitivity levels or alarm thresholds of five fire detection systems (D-1L1, D-6C3, D-7H1, D-8H2, and D-9S1) were not changed during the entire test series. However, the sensitivity levels of the linear heat detection system 2L2, the optical flame detector D-3F1, the VID system D-4C1, and the function of the VID system D-5C2 were modified by the system suppliers prior to the second laboratory tunnel test series with longitudinal airflow and the tests in the roadway tunnel [8]. The changes in the detection systems were based on their performance in the environmental tests in the Lincoln Tunnel [6] and the results of the initial test series in the laboratory tunnel facility [3].
3 FIRE SCENARIOS IN VIGER TUNNEL
The performance of the fire detectors/detection systems was investigated in a series of fire tests conducted in the Viger Tunnel in Montreal, Canada. The tests investigated the response of fire detectors/detection systems to fire scenarios in an operating tunnel environment at their maximum detection range. Six detection systems were used in the tests in Montreal. This included the two linear heat detection systems, the optical flame detection system and the three VID systems.
The scenarios included open gasoline pool fires, gasoline pool fires located underneath a simulated vehicle, and gasoline pool fires located behind a simulated large vehicle. The fire sizes in the tests varied from approximately 125 kW to 650 kW. The fire size was limited to minimize possible damage to equipment and the tunnel. The scenarios were similar to ones used in the laboratory tunnel tests [3, 4].
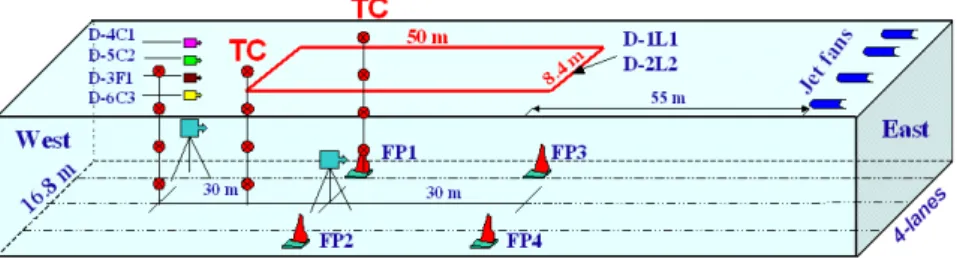
Figure 1. Instrumentation and fire locations in tunnel.
The fires were placed at different locations in the tunnel to evaluate the detection capability of the fire detectors/detection systems at the maximum detecting distance and coverage areas. Figure 1 shows the locations of the fires in the tunnel. Detailed information on the fire locations is as follows:
• Fire Position 1 (FP 1) was located in Lane 1 of the tunnel and approximately 30 m from the detectors mounted at the North wall of the tunnel, 4.8 m from the North wall of the tunnel and 0.6 m from the nearest section of the linear heat detector cables.
• Fire Position 2 (FP 2) was located in Lane 4 approximately 30 m from the detectors mounted at the North wall of the tunnel, 12.8 m from the North wall of the tunnel and 0.2 m from the nearest section of the linear heat detector cables.
• Fire Position 3 (FP 3) was located in Lane 1 approximately 60 m from the detectors mounted at the North wall of the tunnel, 4.8 m from the North wall of the tunnel and 0.6 m from the nearest section of the linear heat detector cables. • Fire Position 4 (FP 4) was located in lane 4 approximately at 60 m from the
detectors mounted at the North wall of the tunnel, 12.8 m from the North wall of the tunnel and 0.2 m from the nearest section of the linear heat detector cables.
The distance of the fire at positions FP 1 and FP 3 to the North wall of the tunnel (4.8 m) was greater than used in the laboratory tunnel tests (2.5 m). This gave a wider view for the detectors mounted on the wall to monitor the fire.
The average air velocities used in the tests were 0 m/s, 1.3 m/s, 2 m/s and 2.4 m/s. The air velocity at the fire source was measured prior to and during each fire test.
4 INSTRUMENTATION IN VIGER TUNNEL
Instrumentation used in the Viger Tunnel included thermocouples, smoke meters, velocity meters and video cameras. Figure 1 shows the location of the instrumentation in the tunnel.
Three thermocouple trees were distributed in the tunnel to monitor temperatures produced by the fires. Thermocouple tree #1 was located near the fire source in each test to measure the flame/plume temperature of the fire and to monitor the fire development. There were four thermocouples on the tree spaced at 1.0 m intervals starting 2 m above the tunnel floor. The locations of the other thermocouple trees (#2 and #3) were fixed in the tunnel. They were placed at the middle of the tunnel 15 m and 30 m downstream of the fire, respectively, when the fire was located at 30 m from the detectors mounted on the wall of the tunnel. The thermocouple trees were 45 m and 60 m downstream of the fire, when the fire was located at 60 m from the detectors. There were five thermocouples on each tree spaced at 1.0 m intervals starting 1 m above the tunnel floor.
Two smoke meters were attached to thermocouple trees #2 and #3 to measure smoke optical density and monitor the smoke spread in the tunnel. There was a 0.6 m vertical light path between the transmitter and the receiver for each smoke meter. The first smoke meter on the thermocouple tree was located near the ceiling with its mid-point approximately 0.3 below the ceiling. The second smoke meter had its mid-point 2.3 m below the ceiling.
A hand held velocity meter mounted on a 4 m long aluminium pole was used to measure the air velocity in the tunnel. The air velocity was manually recorded during the tests. Two video cameras were used to record and monitor fire conditions in the tests. One video camera was located near the wall-mounted detectors. It was used to monitor conditions in the tunnel between the fire and the detectors. The second video camera was placed near the fire source. It was used to monitor the fire conditions from behind the fire towards the detectors.
Four data acquisition systems were used. There was one system for each thermocouple tree used to collect temperature and smoke data. One system was located near the fire detectors/detection systems and was used to monitor the response of the detectors/detection systems to the fires. The test data was collected at 1 s time interval. 5 RESULTS FIRE TESTS IN VIGER TUNNEL
Nine full-scale fire tests were conducted in the Viger Tunnel using three fire scenarios. The fire scenarios used in the tests were selected from those used in the laboratory tests and included a small gasoline pool fire, a gasoline pool fire located underneath a simulated vehicle, and a gasoline pool fires located behind a large vehicle.
General observations on the performance of fire detectors/detection systems in test series are as follows:
• The performances of the fire detection systems were generally consistent with those observed in the laboratory tunnel tests under the same test conditions.
• The pool fires located underneath a vehicle were more difficult to detect than the fires located behind a vehicle. The response times of fire detection systems for the fire located underneath a vehicle were generally longer than those for the fire located behind a vehicle.
• Generally, the challenge for the detectors increased under the longitudinal airflow conditions. However, the response times of the detectors that rely on viewing the fire flame could be delayed or shortened under airflow conditions, as the flames behind the obstacle were unsteady.
5.1 Open Pool Fires
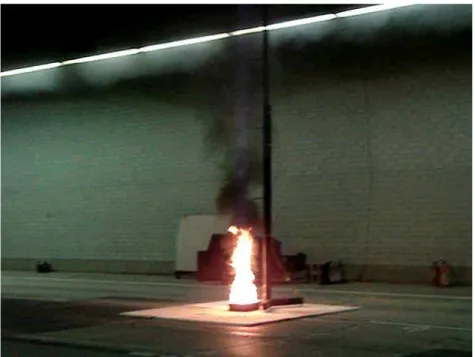
Four tests were conducted with a 0.3 m by 0.3 m gasoline pool fire. The fire (Figure 1) was placed at four locations in the tunnel. There was no obstacle around the fire source. Ambient temperature in the tunnel was 18oC with no prevailing wind. All tests were conducted with minimal airflow velocity in the tunnel (approximately 0 m/s). As a result, a vertical flame was produced (Figure 2).
Figure 2. Small gasoline pool fire.
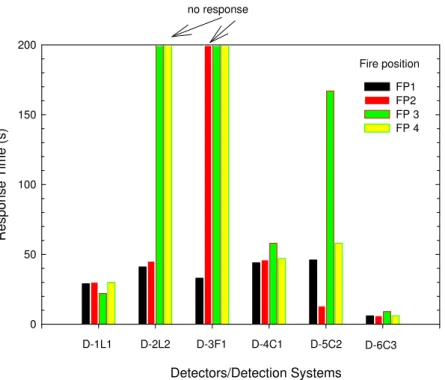
The fire was allowed to burn freely for approximately 9 minutes until the gasoline in the pan was consumed. The fire developed very quickly and substantial smoke was produced and accumulated below the ceiling [5]. The smoke did not obstruct the view of the detectors during the tests. The maximum heat release rate produced by the fire was approximately 125 kW. The responses of the detection systems are summarized in Figure 3.
The linear heat detection systems were able to respond to small fires based on the rate of rise of temperature, even though the increase in ceiling temperature was limited. The response times of the linear heat detection systems were less likely to be affected by fire
location in the tunnel, as the fires were always near a section of the cable. Detection system D-1L1 detected all four of the small fires whereas detection system D-2L2 did not detect the fires located at positions FP3 and FP4. Both of these fires were located at the East end of the cable loops.
Response Time (s ) 0 50 100 150 200 FP1 FP2 FP 3 FP 4 D-1L1 D-2L2 D-3F1 D-4C1 D-6C3 Detectors/Detection Systems D-5C2 no response Fire position
Figure 3. Detector response times for open pool fires.
The optical flame detector, D-3F1, had a maximum detection range of 30 m. It only detected the small fires within this range (location FP1).
The three VID systems were able to detect the small open fires at their maximum detection range (~60 m). The change in location of the small open fire in the tunnel had a limited impact on the performance of Detectors D-4C1 and D-6C3, but had an impact on the performance of D-5C2 with the longest response time for the fire located at position FP 3, which was in the lane closest to the tunnel wall on which the detectors were located.
5.2 Pool Fires Located underneath a Vehicle
Three tests with a 0.36 m2 gasoline pool fire located underneath a simulated vehicle were conducted in the Viger Tunnel. The setup of the fire scenario was the same as used in the laboratory tunnel tests of the project [3, 4]. A 1.5 m wide by 1.2 m high plate, simulating a crashed car, was located between the fire source and the wall-mounted detectors. It was placed 1.5 m in front of the fire source and 0.3 m above the ground. The heat release rate of the fire was approximately 650 kW when measured using a calorimeter.
The fire source was at FP #1 (Figure 1) in the three tests: 30 m from the detectors mounted on the wall and 4.8 m from the North wall of the tunnel. The tests were used to
study the impact of airflow on the response of the detectors/detection systems to a small fire located underneath a vehicle. The jet fans were used to produce average airflow velocities of 1.3 m/s, 2.0 m/s and 2.4 m/s at the fire location.
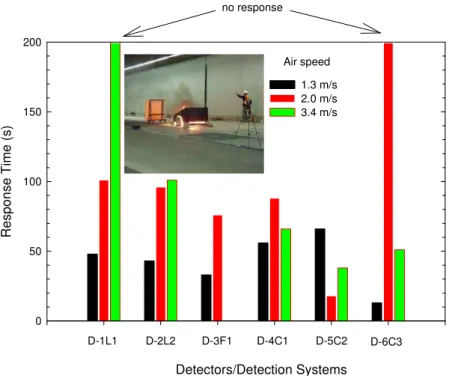
Re sp on se T ime (s ) 0 50 100 150 200 1.3 m/s 2.0 m/s 3.4 m/s D-1L1 D-2L2 D-3F1 D-4C1 D-6C3 Detectors/Detection Systems D-5C2 no response Air speed
Figure 4. Response times for pool fires located underneath a simulated vehicle. The detector response times are shown in Figure 4. Generally, the challenge for the detectors increased under the longitudinal airflow conditions.
The linear heat detection systems detected the fires in all the tests. However, the response time of the linear heat detection systems increased with an increase in airflow speed, as the ceiling temperature decreased.
The response time of the optical flame detector D-3F1 was delayed with an increase in airflow speed. It did not respond to the fire in the test with an airflow velocity of 3.4 m/s. The response times of the three VID systems to the fire could be delayed or shortened under airflow conditions, as the flames behind the obstacle were unsteady.
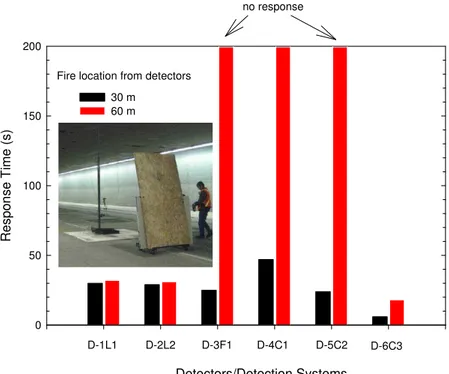
5.3 Open Pool Fires behind a Large Vehicle
Two full-scale tests with a gasoline pool fire located behind a simulated were conducted in the Viger Tunnel. The fire scenario was setup with a 0.36 m2 gasoline pan fire located behind a large plate. The plate, simulating the front portion of a large van, was 1.2 m wide by 2.4 m high. It was placed 0.3 m above the tunnel floor and 3.5 m in front of the pool fire and between the pool fire and the detectors mounted at the wall of the tunnel. The heat release rate of the fire was approximately 650 kW.
Res pon se T ime (s ) 0 50 100 150 200 30 m 60 m D-1L1 D-2L2 D-3F1 D-4C1 D-6C3 Detectors/Detection Systems D-5C2 no response
Fire location from detectors
Figure 5. Response times for pool fires located behind a simulated vehicle.
The fire was placed at positions FP 1 and FP 3 (Figure 1). The air velocity in the tunnel was 1.3 m/s. The tests were designed to study the response of the detectors/detection systems to a fire located behind a vehicle under airflow conditions. The detector response times are shown in Figure 5.
The response times of the two linear heat detection systems were not affected by the change in fire locations. At both locations FP 1 and FP 3, the fire was close to the detection cables.
The optical flame detector D-3F1 detected the fire at 25 s when the fire was located 30 m from the detector. It did not respond to the fire when it was located 60 m from the detector, since the distance was greater than its maximum detection distance.
Both the flame/smoke VID systems (D-4C1 and D-5C2) detected the fire when it was located 30 m from the fire (location FP 1). However, they were unable to detect the fire at position FP 3 which was 60 m from the fire. The flame VID system D-6C3 detected the fires at both locations.
6 COMPUTER MODELLING
The use of Computational Fluid Dynamics (CFD) models to simulate the dynamics of fire behaviour in tunnel applications has been increasing quickly with the rapid development of computer technology. The details of fluid flow and heat transfer provided by CFD models can prove vital in analyzing problems involving far-field smoke flow, complex geometries, and impact of fixed ventilation flows. CFD simulations were conducted to help understand and optimize the technical specifications and installation requirements for application of fire detection technologies in road tunnels.
The current study employed the Fire Dynamic Simulator (FDS) CFD model [9] to study the fire growth and smoke movement in road tunnels. FDS is based on the Large Eddy Simulation (LES) approach and solves a form of high-speed filtered Navier-Stokes equations valid for low-speed buoyancy driven flow. These equations are discretized in space using second order central differences and in time using an explicit, second order, predictor-corrector scheme.
The CFD modelling activities were used to support pre and post full-scale test phases. CFD simulations were initially used to assist in the preparation of the full-scale experiments with regards to instrumentation type and locations as well as to determine important parameters involved in the experiments. After conducting the full-scale tests, numerical predictions were compared against selected experimental data. Further simulations were used to investigate the impact of different parameters on fire behaviour and detection system performance.
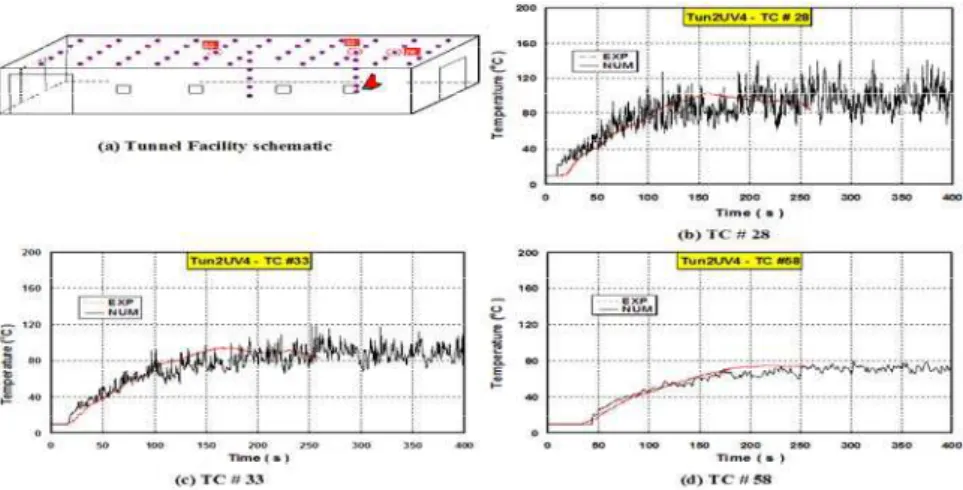
Twenty CFD simulations were conducted to compare numerical predictions against selected full-scale fire tests. The simulations covered different fire sizes, location, ventilation scenarios, and fuel type. Comparisons of temperature and smoke optical density (OD) were made at different locations corresponding to laboratory and field measurement points. Figure 6 shows the results for a test conducted in the laboratory tunnel facility.
Figure 6. Comparisons calculated temperatures with experimental results.
The comparisons of ceiling temperatures were, in general, favourable [7]. The numerical predications were featured by fluctuations with rather large amplitudes especially at locations close to the fire. The experimental results did not exhibit the same fluctuations.
This can be attributed to two reasons: the frequency of data collection was courser (1 Hz) than that for the numerical predictions (< 0.01 Hz), and the plume shape was not perfectly replicated by the numerical procedure.
After establishing the validity of the numerical model, CFD simulations were conducted to determine the effect of the fire scenario, ventilation mode, and tunnel length on fire behaviour and detection system performance. Four ventilation conditions were studied: no ventilation, longitudinal, fully-, and semi-transverse ventilation. Two tunnels lengths were simulated: 37.5 m (similar to the length of the laboratory tunnel) and 500 m. The two tunnels were three lanes with 10 m and 12 m widths, respectively, and had a height of 5.5 m.
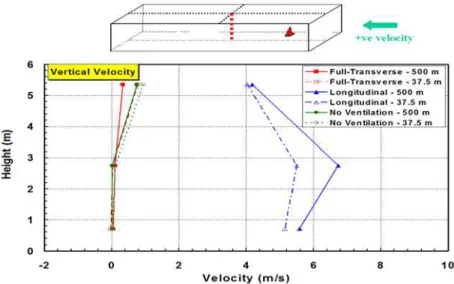
Figures 7 - 10 compare the velocity, ceiling and vertical temperature, and soot volume fraction profiles, respectively, for two similar tunnels with different lengths (37.5 m and 500 m).
Figure 7 shows the average longitudinal velocity component profile at the mid-tunnel section for the two tunnel lengths and for three ventilation cases: full-transverse, longitudinal, and no ventilation. Both the full-transverse and no ventilation cases produced very similar velocity profiles for the two lengths. For the longitudinal ventilation system, similar velocity profiles were produced. However, higher velocities were produced in the case of the 500 m tunnel length.
Figure 8 and Figure 9 show the comparisons of the ceiling temperatures and soot volume fractions for the two tunnel lengths. Both temperature and soot profiles were very similar for the two lengths. As such, the length of the tunnel had no significant effect on the ceiling temperature and smoke density.
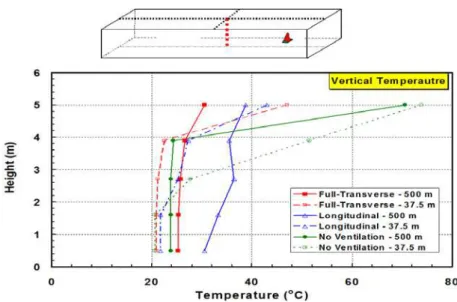
Figure 10 shows the average vertical temperature profile at the mid-tunnel section for the two length tunnels and the three ventilation cases. Both the full-transverse and no ventilation cases produced similar profiles for the two lengths. For the longitudinal ventilation system, similar profiles were produced. However, higher velocities were produced in the case of the 500 m tunnel length.
The ceiling temperature and soot volume fraction profiles for the two tunnel lengths were very similar implying that the length of the tunnel has limited effect on the ceiling temperature and smoke density. As such, tunnel length should have a minimal effect on the performance of detection systems based on temperature increases or smoke build-up in a tunnel.
Four types of ventilation systems were also investigated. The ventilation systems included: longitudinal, full-transverse, semi-transverse (supply), and semi-transverse (exhaust).
Among the ventilation schemes, the semi-transverse supply ventilation system resulted in the highest ceiling temperature and soot volume fraction. Both the full- and semi-transverse exhaust ventilation systems produced similar average ceiling temperature and soot profiles [7]. The longitudinal ventilation system resulted in the lowest average ceiling temperature. The semi-transverse supply ventilation system resulted in the fastest rate of rise of ceiling temperature and the semi-transverse exhaust ventilation system resulted in the slowest rate of rise of ceiling temperature.
In certain cases, the ventilation system or the prevailing wind could result in a strong longitudinal airflow in the tunnel causing a significant tilting of the fire plume. This
could, in turn, result in the shift of the hot spot and sometimes, depending on the strength of the airflow, could slow or even prevent the formation of a hot layer. In these cases, the performance of detection systems that rely on absolute temperature or rate of temperature rise to detect fire incident may be compromised. Moreover, the strong longitudinal airflow may disrupt the structure of the fire plume altering its regular shape. Consequently, it becomes quite challenging for detection systems that depend on visualizing the flame to detect the fire incident.
Figure 7. Average airflow speed at mid-tunnel.
Figure 9. Average airflow temperature at mid-tunnel.
Figure 10. Average ceiling soot volume fraction along the tunnel.
7 CONCLUSIONS
Roadway tunnels are challenging environments for fire detection systems, both in terms of the detection challenge and the environmental conditions under which these systems must operate. Nine fire detection systems, representing five currently available detection technologies for tunnel applications, were investigated in the project. A test protocol for evaluating various fire detection technologies for road tunnel protection was developed. The performance of selected fire detection systems for various tunnel fire scenarios was investigated in a laboratory tunnel and in an operating road tunnel under different longitudinal airflow conditions. Computer modelling was used to investigate the impact
of various fire scenarios, ventilation modes, tunnel operating conditions and tunnel geometries on fire behaviour and detection system performance.
In general, the performance of fire detection systems was dependent on fuel type, fire size, location and growth rate as well as detection method. Based on overall performance, the air sampling detection system performed well; it was able to detect the fire for most scenarios including those with longitudinal airflow [8]. The linear heat detection systems were also able to detect the fires for most scenarios. The systems that rely on field-of-view had problems detecting fires that were concealed by obstructions. Multiple detectors could be used to address this issue. The VID systems that included detection based on both flame and smoke characteristics had better performance in terms of detecting a fire but had problems in the environmental tests [6]. The spot heat detection systems were not able to detect small fires (< 1,500 kW) [3, 4].
It was difficult for most detection systems to respond to small fires located underneath a vehicle. In this case, the flame and heat produced by the fire were confined by the vehicle body making it difficult for the detectors to detect the fire. With an increase in fire size, more detectors responded to the fire and the detection times decreased.
Test results showed that longitudinal airflow in the tunnel had a significant effect on fire behaviour and the performance of the fire detectors/detection systems. The response times of detectors/detection systems were delayed or shortened under airflow conditions, depending on fuel type, fire size, location and growth rate of the fire, airflow speed as well as the detection method [4, 8]. For scenarios with a pool fire located under a simulated vehicle, the fire size could be increased by airflow resulting in shorter detector response times. For other scenarios, the longitudinal airflow decreased the temperatures and diluted the smoke produced by the fire resulting in longer detection times.
.
The performance of detection systems in an operating tunnel environment was generally consistent with those evaluated in the tunnel test facility under corresponding conditions. Good agreement in temperatures was observed between numerical predictions and experimental data. Some discrepancies were noted in the comparisons of numerical prediction against experimental data for tests with longitudinal airflow especially at the test facility entrance. These discrepancies may be attributed to turbulence conditions and plume shape that were not fully reproduced by the model.
Among the numerically investigated ventilation schemes, the semi-transverse supply ventilation system resulted in the highest ceiling temperature and soot volume fraction. Both the full- and semi-transverse exhaust ventilation systems produced similar average ceiling temperature and soot profiles. The longitudinal ventilation system resulted in the lowest average ceiling temperature. The semi-transverse supply ventilation system resulted in the fastest rate of rise of ceiling temperature and the semi-transverse exhaust ventilation system resulted in the slowest rate of rise of ceiling temperature. These changes in conditions in the smoke layer would affect the ability of ceiling mounted detectors to detect a fire.
The ceiling temperature and soot volume fraction profiles for the two tunnel lengths were very similar implying that the length of the tunnel has limited effect on the ceiling temperature and smoke density. As such, tunnel length should have a minimal effect on the performance of detection systems based on temperature increases or smoke build-up in a tunnel.
In general, the data predicted from the CFD simulations can be related to the performance of spot heat detectors, linear heat detection systems, and smoke aspiration detection systems. However, more effort is required to relate CFD results to the VID and flame detection systems. CFD can provide temporal and spatial information on the expected shape of the plume, heat flux and wall temperatures, which could possibly be related to the performance of the optical-based detectors.
8 ACKNOWLEDGEMENTS
The project was conducted under the auspices of the Fire Protection Research Foundation (FPRF). The authors would like to acknowledge the support of the Technical Panel, project sponsors as well as many NRC staff to this project. The authors would also like to acknowledge Professor G. Hadjisophocleous and Ms. Y. Ko of Carleton University for their contributions to the computer modeling study in the project. A special acknowledgement is noted to Kathleen Almand of the FPRF for her contribution in managing the project. In addition, theMinistry of Transportation of Quebec and the Port Authority of New York and New Jersey are recognized for their contribution of resources and time, particularly Alexandre Debs, Joe Agosta, Tom Connors and Alex Ang.
9 REFERENCES
1. Zalosh, R. and Chantranuwat, P., International Road Tunnel Fire Detection Research Project, Phase 1: Review of Prior Test Programs and Tunnel Fires, The Fire Pr.otection Research Foundation, 2003.
2. Liu, Z.G., Crampton G.P., Kashef A.H., Lougheed, G.D., Gibbs E., Su, J.Z. and Benichou, N., International Road Tunnel Fire Detection Research Project – Phase II: Task 1, Fire Detectors, Fire Scenarios and Test Protocols, Report B4179.1, National Research Council, Fire Protection Research Foundation, 2006.
3. Liu, Z.G., Crampton, G.P., Kashef, A.H., Lougheed, G.D., Gibbs, E., and Muradori, S., Task 2, Full-scale Fire Tests in a Laboratory Tunnel for Study of Tunnel Fire Detection Technologies, International Road Tunnel Fire Detection Research Project – Phase II, Report B4179.2, National Research Council, Fire Protection Research Foundation, 2007.
4. Liu, Z.G., Crampton, G.P., Kashef, A., Lougheed, G.D., Gibbs, E., and Muradori, S., Task 7, Effect of Naturally Longitudinal Ventilation on Performance of Fire Detectors/Detection Systems for Road Tunnel Protection, International Road Tunnel Fire Detection Research Project – Phase II, Report B4197.5, National Research Council, Fire Protection Research Foundation, 2008.
5. Liu, Z.G., Crampton, G.P., Kashef, A., Lougheed, G.D., Gibbs, E., and Muradori, S., Task 4: Full-scale Fire Tests in an Operating Road Tunnel at Montreal City. International Road Tunnel Fire Detection Research Project - Phase II, Report B4197.4, National Research Council, Fire Protection Research Foundation, 2008. 6. Gottuk, D.T. and Mawhinney, J., “International Road Tunnel Fire Detection
Research Project – Tasks 5 and 6: Monitoring and Fire Demonstrations in the Lincoln Tunnel,” Hughes Associates, Inc., Fire Protection Research Foundation, 2008.
7. Kashef, A.H., Liu, Z.G., Lougheed, G.D., and Crampton, G.P., Task 3: Study of Computer Simulation Modeling for Tunnel Fire Detection. International Road Tunnel Fire Detection Research Project - Phase II, Report B4197.3, National Research Council, Fire Protection Research Foundation, 2008.
8. Liu, Z.G., Kashef. A.H. Lougheed, G.D., Crampton G.P. and Gottuk, D., “Summary of International Road Tunnel Fire Detection Research Project – Phase II”, International Road Tunnel Fire Detection Research Project - Phase II, Report
B4197.6, National Research Council, Fire Protection Research Foundation, 2008. 9. McGrattan, K.B., “Fire Dynamics Simulator (Version 4) – Technical Reference
Guide”, NIST Special Publication 1018, National Institute of Standards and Technology, Gaithersburg, MD, 2005.