ASPIRATION NOISE DURING PHONATION: SYNTHESIS,
ANALYSIS, AND PITCH-SCALE MODIFICATION
by
i MASSACHUSETTS INSTTUTEOF TECHN0LOGY
DARYUSH MEHTA
MAR 0
5 2009
B.S., Electrical Engineering (2003)
University of Florida
UJBRARIES
SUBMITTED TO THE DEPARTMENT OF ELECTRICAL ENGINEERING AND
COMPUTER SCIENCE
IN PARTIAL FULFILLMENT OF THE REQUIREMENTS FOR THE DEGREE
OF
MASTER OF SCIENCE IN ELECTRICAL ENGINEERING AND COMPUTER SCIENCE at the
MASSACHUSETTS INSTITUTE OF TECHNOLOGY
February 2006
0 Massachusetts Institute of Technology 2006. All rights reserved.
Author ... ...
ad Computer Science January 31, 2006
e ...
Thomas F.
Quatieri
Senior Member of Technical Staff, MIT Lincoln Laboratory Faculty of MIT Speech and Hearing Bioscience and Technology Program
Thesis Supervisor
Accepted by ...
...
Professor A. C. Smith Chair, Department Committee on Graduate Students
This work was sponsored by the Department of Defense under Air Force Contract FA8721-05-C-0002. Opinions, interpretations, conclusions, and recommendations are those of the author and are not necessarily endorsed by the United States Government.
Aspiration Noise during Phonation: Synthesis, Analysis, and Pitch-Scale
Modification
by
Daryush Mehta
Submitted to the Department of Electrical Engineering and Computer Science on January 31, 2006, in partial fulfillment of the requirements for the degree of
Master of Science in Electrical Engineering and Computer Science
Abstract
The current study investigates the synthesis and analysis of aspiration noise in synthesized and spoken vowels. Based on the linear source-filter model of speech production, we implement a vowel synthesizer in which the aspiration noise source is temporally modulated by the periodic source waveform. Modulations in the noise source waveform and their synchrony with the periodic source are shown to be salient for natural-sounding vowel synthesis. After developing the synthesis framework, we research past approaches to separate the two additive components of the model. A challenge for analysis based on this model is the accurate estimation of the aspiration noise component that contains energy across the frequency spectrum and temporal characteristics due to modulations in the noise source. Spectral harmonic/noise component analysis of spoken vowels shows evidence of noise modulations with peaks in the estimated noise source component synchronous with both the open phase of the periodic source and with time instants of glottal closure.
Inspired by this observation of natural modulations in the aspiration noise source, we develop an alternate approach to the speech signal processing aim of accurate pitch-scale modification. The proposed strategy takes a dual processing approach, in which the periodic and noise components of the speech signal are separately analyzed, modified, and re-synthesized. The periodic component is modified using our implementation of time-domain pitch-synchronous overlap-add, and the noise component is handled by modifying characteristics of its source waveform. Since we have modeled an inherent coupling between the original periodic and aspiration noise sources, the modification algorithm is designed to preserve the synchrony between temporal modulations of the two sources. The reconstructed modified signal is perceived to be natural-sounding and generally reduces artifacts that are typically heard in current modification techniques.
Thesis Supervisor: Thomas F. Quatieri
Title: Senior Member of Technical Staff, MIT Lincoln Laboratory
Acknowledgements
My primary thanks is owed to my adviser, Tom, without whom this document and research
ideas would not have come together. Thank you, Tom, for pushing me through my periods of pessimism and for helping me think like a scientist and innovate like an engineer.
To Nick, whose footsteps I have quietly followed because they have been laid out so well. Nick, thanks for those endless discussions that contributed to many insights in this thesis. And for those times that often started with an academic seed like Kalman filtering and somehow ended up with the physics of snowboarding.
To the Speech group at Lincoln Lab, my home away from home-thank you for creating an environment in which creative and organized thinking can occur and for constructively critiquing my research at each stage. Special thanks to Mike Brandstein for his always congenial attitude toward my incessant and sometimes inane software queries.
To the Voice Quality Study Group for starting the seeds of a great discussion forum for the exchange of ideas and insightful critiquing of papers.
To Andrea-thank you for the motivation and drive for me to do my best each day.
And thank you to Mom, Dad, Nazneen, and Parendi-without your love and unwavering support, I would not be here.
Contents
1
Introduction ... 211.1 M otivation ... 22
1.2 O utline ... 22
2 Synthesis of a Vowel with Aspiration Noise ... 25
2.1 Physiology and A coustics... 25
2.1.1 Frequency-dom ain O bservations ... 26
2.1.2 Tim e-dom ain O bservations ... 27
2.2 V ow el Production M odel... 29
2.3 Im plem entation of V ow el Synthesizer ... 31
2.3.1 Periodic Source ... 32
2.3.2 A spiration N oise Source... 33
2.3.3 V ocal T ract and Radiation Filters... 36
2.3.4 Param eters...37
2.4 A lternative Speech Production M odels... 38
2.5 Perception of A spiration N oise Characteristics ... 39
2.5.1 U nm odulated versus M odulated N oise... 39
2.5.2 M odulation Functions... 40
2.5.3 Synchrony w ith Periodic Source... 41
2.6 Sum m ary and Conclusions... 42
3 H arm onic/N oise C om ponent A nalysis ... 45
3.1 Signal Processing Background... 45
3.1.1 A lgorithm s ... 46
3.1.2 Lim itations ... 47
3.3 Perform ance Evaluation on Synthesized V ow el... 51
3.4 Exam ples of A nalysis...60
3.4.1 Synthesized V ow el w ith Tim e-varying Pitch ... 60
3.4.2 Real V ow els ... 62
3.5 Sum m ary and Conclusions... 69
4 Pitch-Scale M odification ... 71
4.1 Signal Processing Background... 71
4.1.1 A lgorithm s ... 72
4.1.2 Lim itations ... 76
4.2 Physiology of Pitch Control... 77
4.3 Pitch M odification M odel ... 78
4.4 Proposed A pproach ... 79
4.5 Im plem entation of Proposed Pitch-Scale M odification ... 82
4.5.1 H arm onic/N oise Com ponent A nalysis ... 82
4.5.2 H arm onic Branch ... 83
4.5.3 N oise Branch... 84
4.5.4 Param eters...90
4.6 E xam ples of M odification... 90
4.6.1 Synthesized V ow els ... 90
4.6.2 Real V ow els ... 98
4.7 O bservations on Signal Q uality... 101
4.8 Sum m ary and Conclusions... 102
5 Future W ork and Conclusions ... 103
5.1 Future W ork... 104
5.1.1 E ffects of Jitter and Shim m er ... 104
5.1.2 Periodic Com ponent Estim ation with SEEV O C ... 106
5.1.3 E stim ating the Envelope of a N oise Signal... 107
5.1.4 Coupling betw een Pitch and Form ants ... 109
5.1.5 Processing Continuous Speech... 111
5.1.6 Form al Listening Evaluation... 114
5.2 Conclusions ... 114
B MATLAB Graphical User Interface ... 119
C Pitch-Scaled Harmonic Filter... 123
D Defining Glottal Cycle Properties... 125
E Linear Prediction of Stochastic Signals...127
List of Figures
Figure 2.1 Vocal fold abduction and adduction during phonation. Axial view from above the vocal folds. The leftmost figure shows closure of the vocal folds along its length up to the two arytenoid cartilages. From [63]... 27
Figure 2.2 Effect of the DC offset parameter on the glottal flow velocity waveform, DC
= 0
(dashed line) and DC = 0.2 (solid line). (a) Increase in DC offset is accompanied
by a decrease in the AC amplitude, and (b) increase in DC offset strictly vertically
offsets the entire waveform. Pitch period is 0.01 s...28 Figure 2.3 V ow el production m odel ... 29
Figure 2.4 Glottal airflow velocity waveform. Rosenberg model (top) and its corresponding derivative waveform (bottom) representing the effective periodic input as a pressure source. To = 0.01 s, OQ = 0.6, f, = 8000 Hz. The waveforms are vertically offset for clarity ... 33
Figure 2.5 The AC component of the aspiration noise source. Glottal waveform (top), white Gaussian noise signal (middle), and noise signal modulated by the glottal waveform (bottom). To = 0.01 s, OQ = 0.6, f, = 8000 Hz. The waveforms are vertically offset for clarity ... 34 Figure 2.6 The DC component of the aspiration noise source. The glottal flow velocity
waveform with no DC flow (dashed line) and DC flow of 0.2 (solid line). To =
0.01 s, OQ = 0.6, f, = 8000 H z. ... 35
Figure 2.7 Generating the modulated aspiration noise source. (a) Unmodulated white Gaussian noise, (b) noise signal modulated by glottal waveform with no DC flow, and (c) noise signal modulated by glottal waveform with a DC flow of 0.2. To
=
0.01 s, O Q = 0.6, fs = 8000 H z. ... 35Figure 2.8 The aspiration noise source. (a) Unmodulated white Gaussian noise and (b) noise signal modulated by glottal waveform. Synthesis parameters: fo= 100 (pitch period
= 0.01 s), f, = 8000, D C = 0.2, O Q = 0.6... 40
Figure 2.9 The four modulation functions imposed on the aspiration noise source. Rectangle
(no modulation), sinusoidal amplitude modulation, the glottal waveform with no
DC component, and the glottal waveform with a DC component...41
Figure 2.10 Perception of source synchrony. (a) In-phase and (b) out-of-phase source waveforms. Synthesized glottal waveform (dotted line), derivative of glottal waveform (top solid line), and aspiration noise source (bottom solid line). Synthesis parameters: Noise type = modulated, Vowel = a, fo= 100, Gender = m,
f, = 8000, Duration = 1, DC = 0.1, OQ = 0.4, HNR = 10. The waveforms are
vertically offset for clarity ... 42
Figure 3.1 Output HNR vs. input HNR. Synthesized noise source is either unmodulated
(circles) or modulated (triangles). Dashed line indicates ideal performance with H N R equal at input and output ... 53
Figure 3.2 Averaged periodograms of (a) synthesized vowel, (b) harmonic estimate, and (c)
noise estimate. In (b) and (c), superimposed are DFT magnitudes of the synthesized harmonic and noise inputs, respectively. Synthesis parameters: Noise
type modulated, Vowel = a, fo = 100, Gender = m, f, = 8000, Duration = 1,
D C = 0.1, O Q = 0.6, H N R = 10. ... 55
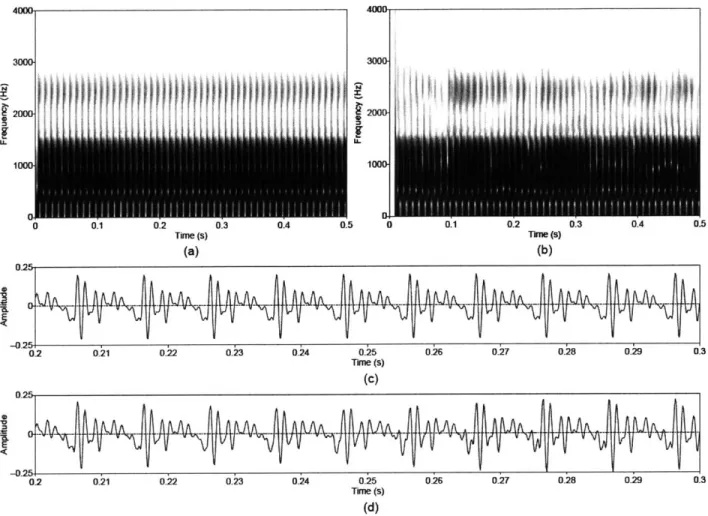
Figure 3.3 Approximate reconstruction of the harmonic component from the synthesized
steady-pitch vowel. Wideband spectrograms of (a) synthesized and (b) separated harmonic components, and waveforms of (c) synthesized and (d) separated harmonic components. Waveforms are shown on an expanded time scale. Synthesis parameters: Noise type = modulated, Vowel = a, fo = 100, Gender = m,
f, = 8000, Duration = 1, DC = 0.1, OQ = 0.6, HNR = 10...56
Figure 3.4 Approximate reconstruction of the modulated noise component from the synthesized steady-pitch vowel. Wideband spectrograms of (a) synthesized and (b) separated noise components, and waveforms of (c) synthesized and (d) separated noise components. Waveforms are shown on an expanded time scale. Synthesis
parameters: Noise type
=
modulated, Vowel=
a, fo=
100, Gender=
m, f,=
Figure 3.5. Approximate reconstruction of the unmodulated noise component from the synthesized steady-pitch vowel. Wideband spectrograms of (a) synthesized and (b) separated noise components, and waveforms of (c) synthesized and (d) separated noise components. Waveforms are shown on an expanded time scale. Synthesis
parameters: Noise type unmodulated, Vowel = a, fo = 100, Gender = m, f,
8000, Duration = 1, DC 0.1, OQ = 0.6, HNR = 10...58
Figure 3.6 Temporal modulation structure approximately preserved by PSHF algorithm.
Whitened noise component estimate (solid line) and synthesized glottal waveform (dashed line). Synthesis parameters: Noise type = modulated, Vowel = a, fo = 100,
Gender = m, f, = 8000, Duration = 1, DC = 0.1, OQ = 0.6, HNR = 10...60
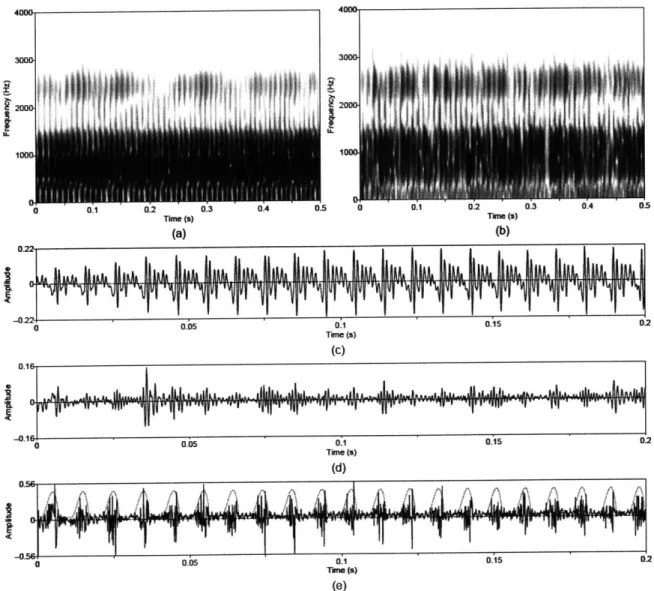
Figure 3.7 Synthesized vowel /a/ with time-varying pitch. (a) Wideband spectrogram, (b)
pressure waveform, and (c) pitch contour. Synthesis parameters: Noise type
=
modulated, Vowel = a, fo = 100-140, Gender = m, fs = 8000, Duration = 1, DC
= 0.1, O Q = 0.6, H N R = 10... 61
Figure 3.8 Temporal characteristics of harmonic/noise analysis on synthesized vowel with time-varying pitch. Wideband spectrograms of separated (a) harmonic and (b)
noise components with pressure waveforms of (c) separated harmonic
component, (d) separated noise component, and (e) whitened noise component with synthesized glottal waveform superimposed (dotted line)...62
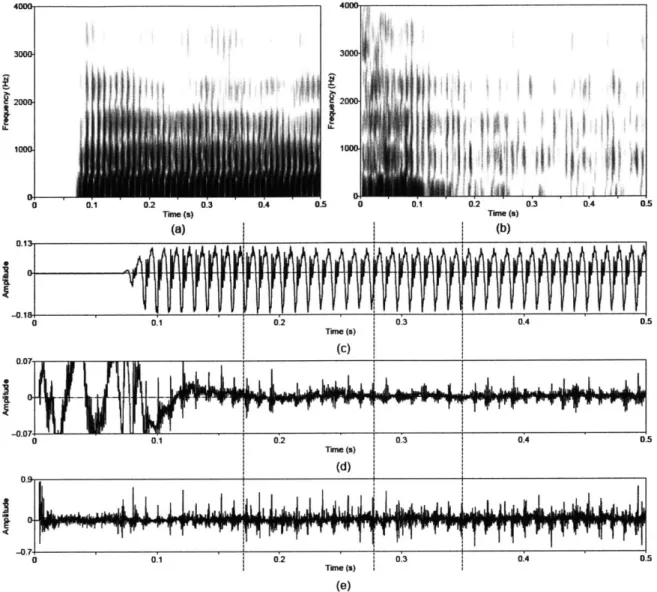
Figure 3.9 Utterance by normal speaker, /px/. (a) Wideband spectrogram and (b) pressure
w av efo rm ... 64
Figure 3.10 Temporal characteristics of harmonic/noise analysis on /pe/, uttered by normal speaker. Wideband spectrograms of separated (a) harmonic and (b) noise components with pressure waveforms of (c) separated harmonic component, (d) separated noise component, and (e) whitened noise component. Dashed lines indicate sample instants of assumed glottal closure. The plosive burst is vertically clipped in (d) to zoom in on the noise modulations in the vocalic region...65 Figure 3.11 Harmonic/noise analysis speaker with vocal pathology. Periodograms of (a)
synthesized vowel, (b) harmonic estimate, and (c) noise estimate...67
Figure 3.12 Sustained vowel /a/ uttered by speaker with vocal pathology. (a) Wideband
Figure 3.13 Temporal characteristics of harmonic/noise analysis on /a/ uttered by pathological speaker. Wideband spectrograms of separated (a) harmonic and (b)
noise components with pressure waveforms of (c) separated harmonic
component, (d) separated noise component, and (e) whitened noise component. Left dotted line indicates sample instant of assumed glottal closure. Right dashed
line indicates sample instant of assumed peak in open phase of glottal cycle. ... 69
Figure 4.1 Pitch m odification m odel... 79
Figure 4.2 Block diagram of approach to pitch-scale modification...80
Figure 4.3 Block diagram of TD-PSOLA algorithm. ... 83
Figure 4.4 Example schematic of TD-PSOLA algorithm, pitch scale = 2. (a) Original and new pitch contours and (b) replication of analysis frames centered at glottal clo su re in stan ts. ... 84
Figure 4.5 Inverse filtering the noise component estimate of a synthesized vowel. Whitened noise estimate plotted where the synthesized aspiration noise source was either (a) modulated or (b) unmodulated. Synthesis parameters: Noise type = modulated, Vowel = a, f= 100, Gender = m, f, = 8000, Duration = 1, DC = 0.1, OQ = 0.6, H N R = 10 ... 86
Figure 4.6 Hilbert transform method of envelope detection, in continuous time. RQ ( f) is the frequency response of the quadrature filter that outputs the Hilbert transform of the input real signal. The complex analytic signal is then formed, with its real part equal to a(t) and its imaginary part equal to its Hilbert transform. Next, the magnitude of the analytic signal is taken. Finally, a low-pass filter acts on the sig n al...8 7 Figure 4.7 Block diagram for pitch modification example. Letters denote the speech waveform at a specific instance during processing. (a) Synthesized vowel, (b) modified vowel output, (c) extracted harmonic component, (d) modified harmonic component, (e) extracted noise component, (f) modified noise component, (g) aspiration noise source estimate, (h) modified aspiration noise source, (i) envelope of aspiration noise source, (j) modified envelope, and (k) dem odulated aspiration noise source ... 91
Figure 4.8 Pitch modification example, synthesized vowel. Original and modified waveforms are placed side-by-side for ease of comparison. (a) Synthesized vowel, (b) modified vowel output, (c) extracted harmonic component, (d) modified harmonic component, (e) extracted noise component, and (f) modified noise. See Figure 4.7 for the waveform's location in the algorithm (letters correspond to waveforms in this figure). Synthesis parameters: Noise type = modulated, Vowel
= a, fo = 100, Gender = m, f, = 8000, Duration = 1, DC = 0.1, OQ = 0.6, HNR
= 10. Modification parameters: Pitch scale = 0.8, LPC order = 10, LPF cutoff =
3 5 0 ... 9 2
Figure 4.9 The vowel production model with labels at each stage. Letters denote the speech waveform at a specific instance during processing. At each step, the first letter indicates vowel synthesis at one pitch; the second letter indicates vowel synthesis at another pitch. (a, b) Synthesized vowel, (c, d) harmonic component, (e, f) noise
component, (g, h) aspiration noise source, (i,
j)
envelope of aspiration noisesource, (k, 1) aspiration noise source before modulation...94 Figure 4.10 Vowel synthesis of two vowels, simulating a pitch change from 100 Hz to 80 Hz.
(a, b) Synthesized vowel, (c, d) harmonic component, and (e, f) noise component. See Figure 4.9 for the waveform's location in the algorithm (letters correspond to
waveforms in this figure). Synthesis parameters: Noise type
=
modulated, Vowel= a, fo = 100, Gender = m, f, = 8000, Duration = 1, DC = 0.1, OQ = 0.6, HNR = 1 0 ... 9 5
Figure 4.11 Synthesized vowel with time-varying pitch, 100-140 Hz, over one-second duration, shown in Figure 3.7. (a) Wideband spectrogram and (b) original (dotted
line) and modified (solid line) pitch contours. Synthesis parameters: Noise type
=
modulated, Vowel = a, fo 100-140, Gender = m, f, = 8000, Duration = 1, DC
= 0.1, OQ = 0.6, HNR 10. Modification parameters: Pitch scale = 1.2, LPC
order = 10, LPF cutoff = 350 ... 97
Figure 4.12 Modified components of synthesized vowel. (a) Modified aspiration noise source with modified envelope (dotted line), (b) modified noise component, and (c) modified periodic component with modified noise source envelope (dotted line). ... 98
Figure 4.13 Utterance by normal speaker, /px/, as in Figure 3.9. Pitch scale = 0.8. (a) Wideband spectrogram and (b) original (dotted line) and modified (solid line) p itch co n to u rs...99 Figure 4.14 Modified components of normal speech. (a) Modified aspiration noise source
with modified envelope (dotted line), (b) modified noise component, and (c) modified periodic component with modified noise source envelope (dotted line). ... 99 Figure 4.15 Vowel by speaker with voice disorder, as in Figure 3.12. Pitch scale = 0.9. (a)
Wideband spectrogram and (b) original (dotted line) and modified (solid line) p itch co n to urs... 100
Figure 4.16 Modified components of disordered speech. (a) Modified aspiration noise source with modified envelope (dotted line), (b) modified noise component, and (c) modified periodic component with modified noise source envelope (dotted line). ... 101 Figure 5.1 Noise waveform estimated from purely periodic vowel with jitter. Synthesis
parameters: Noise type = modulated, Vowel = a, fo = 100, Gender = m, f, = 48000, Duration = 1, DC = 0.1, OQ = 0.6, HNR = 500, jitter = 1, shimmer = 0... 105 Figure 5.2 Noise waveform estimated from purely periodic vowel with shimmer. Synthesis
parameters: Noise type = modulated, Vowel = a, fo = 100, Gender = m, f, = 48000, Duration = 1, DC = 0.1, OQ = 0.6, HNR = 500, jitter = 0, shimmer =
1 0 ... 10 6
Figure 5.3 Difficulty estimating an envelope from a noise signal. (a) Short-time spectra, (b) waveforms, and (c) envelope waveforms with normalized amplitudes. Line types indicate the glottal airflow velocity (thick line), noise source modulated by glottal waveform (thin line), and noise source envelope estimated by Hilbert transform method (dotted line). Synthesis parameters: Noise type = modulated, fo= 100, f, =
8000, D C = 0.1, O Q = 0.6, H N R = 10... 109
Figure 5.4 Comparing pitch-scale modification algorithms. Utterance by a normal speaker saying: "As time goes by." (a) Original signal, (b) modified by STS, and (c) modified by our proposed algorithm. Narrowband spectrograms (upper plot) and time-domain waveforms (lower plot) plotted for each signal. Modification parameters: Pitch scale = 0.8, LPC order = 10, LPF cutoff = 350... 113
Figure 5.5 Original (thick line) and modified (thin line) pitch contours of continuous speech example in Figure 5.4. Pitch contours similar for outputs of proposed algorithm
an d S T S ... 1 14 Figure B .1 M A T LA B G U I... 119
Figure C.1 Example of the pitch-scaled harmonic filter on a windowed segment. (a) DFT of
short-time signal from vowel signal in (b), windowed by a Hanning window (dotted line). Circles in (a) indicate DFT magnitude at every fourth DFT index.
Synthesis parameters: Vowel = a, fo= 100, Gender = m, f, = 8000, DC = 0.1, OQ
= 0 .6 ... 12 4
Figure D.1 Defining glottal waveform properties. Synthesized waveforms are of the periodic source (upper) and corresponding vocal tract/ radiation- filtered waveform (lower).
Vertical lines indicate instants of glottal closure. Synthesis parameters: Vowel
=
a,fo = 100, Gender = m, f, = 8000, Duration = 1, DC = 0.1, OQ = 0.6... 126
Figure E .1 A ll-pole m odel of aspiration noise. ... 127
Figure E.2 The inverse approach to solving for the all-pole model in the stochastic case. ... 127
Figure F.1 Classic method of asynchronous detection of AM message. HWR = half-wave
rectification, LPF
=
low-pass filter, -DC indicates that the mean value issu b tracted ... 12 9
Figure F.2 Amplitude modulation example. (a) Message, (b) carrier, (c) AM signal, and (d) envelope detected using asynchronous detection (solid line), with desired envelope (dash ed line)... 130
Figure F.3 Amplitude modulation example with lower carrier frequency. (a) Message, (b) carrier, (c) AM signal, and (d) envelope detected using asynchronous detection
(solid line), w ith desired envelope (dashed line)... 131
Figure F.4 Schematic of frequency response of the Hilbert quadrature filter. Magnitude (solid line) and phase (dashed line) response... 132
Figure F.5 DSB-SC modulation example. (a) Message, (b) carrier, (c) AM signal (solid line)
with message (dashed line), and (d) envelope detected using Hilbert transform method (solid line) with desired envelope (dashed line). Note the lines in (d) are offset vertically by 0.2 for clarity... 134
Figure F.6 DSB-SC modulation example with noise carrier. (a) Message, (b) carrier, (c) AM signal (solid line) with message (dashed line), and (d) envelope detected using Hilbert transform method (solid line) with desired envelope (dashed line)... 135 Figure F.7 Hilbert transform/low-pass filter method of envelope detection in a DSB signal.
RQ (
f) is the frequency response of the quadrature filter that outputs the Hilberttransform of the input real signal. The complex analytic signal is then formed with its real part equal to DSB(t) and imaginary part equal to the Hilbert transform. Next, the magnitude of the analytic signal is taken. Finally, a low-pass filter acts o n th e sig n al...13 6
Figure F.8 DSB-SC modulation example with modified Hilbert transform method. Message and carrier as in Figure F.6. (a) Envelope detected using Hilbert transform method (solid line) with desired envelope superimposed (dashed line) and (b) envelope detected (solid line) with desired envelope (dashed line)... 136
Figure F.9 Estimating the glottal waveform modulation using the Hilbert transform method. (a) Synthesized periodic source, (b) envelope estimated using the Hilbert method of the analytic signal magnitude, and (c) envelope estimated with a low-pass filter appended to the Hilbert transform method. Upper plot is of narrowband spectrogram and lower plot is of waveform over an expanded time scale. Synthesis parameters: Noise type = modulated, fo = 100, f, = 8000, Duration = 1,
List of Tables
Table 2.1 Vowel formant frequencies, in Hz. Data from [62] and [73]...36 Table 3.1 Comparison of harmonic/noise decomposition algorithms. TD
=
time domain,FD
=
frequency domain, CD=
cepstral domain...47 Table 3.2 HNR measures for harmonic/noise analysis of synthesized vowel withunmodulated aspiration noise source. Noise type
=
unmodulated, vowel=
a, fo=
100, Gender = m, f, = 8000, Duration = 1, DC = 0.1, OQ = 0.6. Parameter is
H N R ... 5 2
Table 3.3 HNR measures for harmonic/noise analysis of synthesized vowel with modulated aspiration noise source. Noise type = modulated, vowel = a, fo = 100, Gender =
m, f, = 8000, Duration = 1, DC = 0.1, OQ = 0.6. Parameter is HNR. ... 52
Table 4.1 Comparison of pitch-scale modification algorithms. TD = time-domain, FD = frequ en cy-d om ain . ... 74
Table A .1 Param eters of vow el synthesizer... 117
Chapter
1
Introduction
A common theme of research is to link observations from different domains and explain or
even predict the data observed in one domain using results from a second domain. One such domain is the physiological world, consisting of complex chemical, biological, and electrical interactions within anatomical structures. Another, the acoustic domain, can provide indirect measurement of properties that have their root in physiological processes. Thus, for example, we can analyze a system such as the human speech production mechanism by making quantitative and qualitative observations of the speech acoustics. To link acoustic data to processes in the physiological domain, we turn to modeling. Modeling forms this link and thus affords the experimenter a tool with which predictions can be made across domains. In this study, inspiration from observations in the physiology and anatomy of voice production is used as a basis for developing a signal processing model for speech synthesis, analysis, and modification applications.
The current study investigates the synthesis and analysis of aspiration noise in synthesized and spoken vowels. The approach builds on the linear source-filter modeling of speech (see [73] for a review) and research that aims at decomposing the speech signal into periodic and noise components for speech modification purposes [7, 31, 43, 53, 75, 80]. In speech synthesis, the
voicing source is often synthesized using an additive noise model that represents noise as modulated at the pitch rate and synchronized with the voiced component before vocal tract filtering [36]. A challenge for analysis based on this model is accurate separation to estimate both temporal and spectral characteristics of the noise component. Previous researchers have documented the
perceptual importance of noise modulations (e.g., [20]) and have further applied this understanding to the development of speech modification techniques [75].
1.1 Motivation
It is important in many applications to understand the inherent characteristics of the aperiodic component during voiced and unvoiced speech. For example, text-to-speech synthesis applications desire the highest quality and most natural-sounding speech. This is one case in which synthesizing an accurate representation of the aperiodic part of speech can help. If there are temporal characteristics that occur at certain phase relationships within a glottal period, then these relationships should be kept intact during synthesis. Along the same line of thinking, current speech modification algorithms (see [43, 45, 54, 59, 65, 75]) would also benefit from estimating and modifying the aspiration noise components, according to a physiologically-based model.
The goal for a speaker identification application is to recognize distinct traits for different speakers. The noise characteristics of speech may be unique to different speakers, and if true, the pattern recognition approach to speaker identification may benefit from a supplementary source of feature vectors derived from the noise component. The analysis of the acoustic speech signal can also aid in vocal assessment in the clinical setting, where it is desired to effectively and efficiently assess, diagnose, and alleviate pathologies associated with the voice production mechanism. Though it has been shown that acoustic measures may not correlate well with disordered structures in the vocal fold region [19, 23, 25, 26, 42], an analysis of solely the aperiodic component of speech may
offer critical insights not gained by simply analyzing the cumulative pressure signal.
1.2 Outline
The organization of the material is as follows. Chapter 2 begins with a background of the speech production system, specifically focusing on the physiological mechanisms that control the production of the aspiration noise source. A physiologically-based vowel synthesizer is implemented, and its parameters are described. Chapter 3 deals with the problem of estimating the aspiration noise from an aggregate speech signal. A brief description of previous noise estimation techniques is presented, and one technique is selected for subsequent analysis on synthesized and real vowels. This technique is then used as the first step in our proposed pitch-scale modification algorithm that
is introduced in Chapter 4. Current pitch modification algorithms are presented with their limitations to motivate the development of our proposed modification algorithm. Each stage of the proposed algorithm is described, followed by example processing on synthesized and real vowels. Chapter 5 draws conclusions and provides a summary of current challenges that prove interesting for future work on the subject and summarize the major conclusions from this study.
Chapter 2
Synthesis of a Vowel with Aspiration Noise
This chapter addresses the synthesis of a vowel motivated by physiological mechanisms of the voicing source with aspiration noise. First, Section 2.1 presents the relevant physiological mechanisms of speech production, and Section 2.2 describes a vowel production model inspired by the observed physiology. Next, Section 2.3 explains our implementation of a vowel synthesizer and its parameters. As an aside, Section 2.4 mentions alternative models of the speech production mechanism that form a more complete picture but are not of focus in this study. Finally, Section 2.5 discusses the perceptual consequences of various aspiration noise characteristics in the context of synthesized vowels.
2.1 Physiology and Acoustics
The system is often simplified to two independent mechanisms-the source and the filter. The source mechanism arises from the vocal folds of the larynx that are set into periodic vibration
by a combination of muscle tensions and aerodynamic forces that form the myo-elastic aerodynamic
theory [73]. Vibration of the vocal folds provide for an excitation source of periodic puffs of air that subsequently are input into the supraglottal system, including the vocal tract and external environment. Due to the relatively high acoustic impedance at the glottis [73], these post-source stages effectively act as linear filters that shape the spectral characteristics of the periodic source mechanism. This study focuses on the dual nature of the voicing source that consists of both periodic and noise factors due to turbulent noise at the glottis.
Typically, speech researchers refer to the term "breathiness" to refer to a voice quality that has been correlated with the presence of a noise percept due to airflow turbulences at the source of the voicing mechanism [11-13, 22, 23, 38, 40, 41]. The breathy voice quality implicates many
acoustic correlates in the speech spectrum that will not be addressed here, including harmonic relationships, first formant bandwidth, speed quotient, and spectral tilt [16-19, 22, 41]. This thesis will focus on characterizing the aspiration noise component of speech that can occur during the production of breathy vowels, modal phonation, or dysphonic speech [19].
More generally, turbulence can be created at a number of locations in the speech production system downstream from the glottis. These turbulent sources occur during voiced and unvoiced fricative production, and although the output speech is not perceptually breathy, a noise component is introduced at the vocal tract output. The aspiration noise source is generated at the level of the glottis and acts as a stochastic excitation source simultaneously with the periodic excitation. High-velocity air passes through the glottal constriction and results in the generation of a jet stream that forms eddies of air that introduce noise sources into the speech production system [34]. Turbulent air flow generates several sources that are distributed over various structures near the glottis [72, 73], such as the false vocal folds, the pharyngeal walls, and, in pathological speakers, anomalous masses on the true vocal folds themselves. The following sections describe empirical observations made of the properties of this turbulent air flow.
2.1.1
Frequency-domain Observations
Stevens [72] relates the generation of aspiration noise in speech to the generation of turbulence at a spoiler impeding the airflow in a cylindrical tube. Alluding to empirical observations performed by Gordon [14, 15], who measured the spectral characteristics of the source and radiated pressure signal in context of the tube-spoiler setup, Stevens concludes that the spectral characteristics of the turbulent noise at the location of the spoiler are within 6 dB up to a certain cutoff frequency dictated by the length of the cylindrical tube.
Empirical observations have also been made regarding noise source spectra generated in another tube model and in real whispered vowels. The spectral characteristics of the turbulent noise source during whispered speech are assumed to closely mirror that of the modulated noise source occurring during phonation. Hillman et al. have simulated the effect of turbulent noise at the glottis
of the source of human-produced whispered vowels [24]. Results point to a broadband spectral quality of the aspiration noise source, varying within ±10 dB from 100 Hz to 10 kHz.
2.1.2
Time-domain Observations
The aspiration noise source can occur during modal phonation, breathy vowels, voiced fricatives, and utterances of speakers with certain types of dysphonia [23, 25, 26, 28, 40]. When the vocal folds vibrate during phonation, the concomitant generation of turbulence noise is thought to be maximum during the open phase of the glottal volume velocity waveform, with larger pressure sources resulting from higher-velocity turbulences [36-38, 73]. Contrarily, other analyses of vowels have observed that locations of maximum noise amplitude occur around the instant of glottal closure and not during the open phase [28, 66].
In addition, it has been observed that the vocal folds do not close completely along their length. While the membranous portion of the vocal folds vibrate during phonation, a posterior glottal opening is often present at the cartilaginous portion of the vocal folds where the arytenoid cartilages appear, allowing for a constant DC flow of air during phonation [16-19] (see Figure 2.1).
Figure 2.1 Vocal fold abduction and adduction during phonation. Axial view from above the vocal folds. The leftmost figure shows closure of the vocal folds along its length up to the two arytenoid cartilages. From [63].
Two effects of the DC flow offset are observed. First, the degree of the DC offset could be correlated with other aspects of the glottal waveform such as AC amplitude and opening and closing characteristics. The influence of the DC offset in this case is schematized in Figure 2.2a. Secondly, the DC term could simply act as a strict vertical offset so that the opening and closing characteristics of the waveform are not changed. Figure 2.2b schematizes this process.
-1.2-
[\1.2-
f\ F0.
1
/
0.4\
II L1' 0.2,1 1 0.2 '/
01 0 - 0 0.01 0.0 0.03 0.04 0.05 0.06 0 .01 002 0.03 0.04 0.05 0.06 Tirn (s) Time (s)(a)
(b)
Figure 2.2 Effect of the DC offset parameter on the glottal flow velocity waveform, DC = 0 (dashed line) and
DC = 0.2 (solid line). (a) Increase in DC offset is accompanied by a decrease in the AC amplitude, and (b) increase in DC offset strictly vertically offsets the entire waveform. Pitch period is 0.01 s.
Empirical observations support both processes of Figure 2.2 in different cases. In one research study, Holmberg, Hilman, and Perkell derive inverse-filtered waveforms for the vowel /a/ from the oral airflow of male and female speakers at different loudness levels [27]. A DC offset was observed in the inverse-filtered waveform, especially when the vowel was phonated at a soft level. The effect of the DC offset mirrored what is schematized in Figure 2.2a. An increase in the DC flow was accompanied by a decrease in the AC amplitude of the airflow. In addition, the data point to a simultaneous increase in open quotient and rounding of the corners at the opening and closing portions of the waveform.
At a constant production level, however, the varying sizes of the glottal chink can be observed in the acoustics [27]. Empirical observations closely mirror the simulated glottal waveforms in Figure 2.2b. This process would lend itself to the notion that closure of the vocal folds maintains its abrupt nature even when a DC flow is observed. The two mechanisms-the AC waveform and the DC offset-are distinct and almost decoupled since each is due to a different portion of the vocal folds. Care must be taken to ascribe the AC waveform to the vibration of the membranous portion of the vocal folds, while the DC offset is due to the non-vibrating cartilaginous portion of the vocal folds. In the model and implementation that follow, the schematic in Figure 2.2b is selected as the effect of DC flow on the glottal volume velocity source.
Within a given speaker, the loudness level can significantly modify the glottal waveform, potentially affecting the AC amplitude of the noise source as well as open quotient and the abruptness of vocal fold opening and closure [27]. These secondary phenomena are not taken into
2.2
Vowel Production Model
Inspired by the above-mentioned physiological observations, we develop a model for the production of a vowel. The temporal characteristics of the noise source-modulations at the rate of the fundamental frequency and DC flow-and the observed broadband spectral characteristic will be taken into account. A block diagram summarizes the model in Figure 2.3. The output waveform consists of a linear sum of both a periodic and noise component. The periodic component is the output of the linear vocal tract filter with a periodic glottal flow velocity source, while the noise component is the output of the vocal tract filter with a modulated white noise input.
2 source model Harmonic Component r
---i o Radha
Noise Component
Figure 2.3 Vowel production model.
To put this flow diagram into formal equations, it helps to view the signals of interest in the time domain (from [63]). The periodic source, ug[n], arises from the periodic vibrations of the vocal folds and can be represented by one period of the glottal flow velocity waveform,
g[n],
convolved with a train of impulses, p[n], with its period equal to the inverse of the fundamental frequency:Ug[n]
=
g[n]
*
p[n].
(2.1)
-This volume velocity source is input into a linear time-invariant filter representing the vocal tract, with impulse response h[n], which effectively filters and shapes the spectrum of the glottal
source. The output signal at the lips due to the periodic source, x,[n], is thus
xP[n] =(g[n] * p[ n])* h[n]. (2.2)
In the model of the noise component, air flows through the constrictions at the glottis and encounters obstructions that generate turbulence, which aggregates into a noise source denoted by
q[n]. This noise source is effectively gated and modulated by the opening and closing of the vocal
folds, where the modulation function is represented by ug[n] and is assumed multiplicative. The
model assumes that the modulated noise source,
q[n]ug[n], is then input into the same vocal tract
filter that operates on the periodic glottal source. The output signal at the lips due to the noise source is x[n]:
xn[n] =
(q[n]ug[n])*
h[n]. (2.3)Both x,[n] and xn [n] are volume velocity signals. The periodic portion is due to the periodic puffs
of air generated at the glottis, and the noise portion is due to the acoustic realization of airflow
The overall signal that a standard condenser microphone measures manifests as acoustic pressure waves that propagate through the ambient air. Since the pressure signal is measured by the microphone at a certain distance from the lips, a transformation occurs from the volume velocity signals
xP[n]
andx[n]
to the pressure signals due to the radiation impedance in the atmosphere. Assumed to be a spherical acoustic source, the volume velocity signals at the lips are passed through a filter representing this radiation characteristic, which, in continuous time, is given by (a far-field approximation valid for frequencies up to 4000 Hz) [73]:p (2,Tfrj
R( f) = j--
e
C,
(2.4)2r
where
p
is the density of air,r
is the distance from the velocity source to a far-field microphone, and c is the speed of sound. We are usually concerned with the magnitude of the radiationcharacteristic,
IR(
f)l, approximated by [73]
1R( f) = " f. (2.5)
2r
The magnitude of the radiation characteristic filter is effectively linearly proportional to frequency and thus emphasizes energy at higher frequencies. The discrete-time filter associated with R( f) is denoted by
41n].
The output pressure signal in the production model reflects the presence of the radiation characteristic. The total speech pressure signal at the microphone,
s[n],
is modeled as the linear addition of the periodic and noise components:s[n] = (xP[n]
*1n])+ (x,[n]
*
4in])
= (ug[n]* h[n]* rtn])+ (q[n]u,[n]* h[n]* 1n])
(2.6)
= (g[n]* p[n]*h[n]*4in])+(q[n]ug[n]*
h[n]*4rn])
2.3 Implementation of Vowel Synthesizer
In this section, we describe a MATLAB implementation of the production model in Figure
synthesizer and includes a periodic voicing source (Klatt's AV parameter) and a stochastic aspiration noise source (Klatt's AH parameter) [36, 37].
2.3.1
Periodic Source
The form chosen for the periodic source is a pulse shape by Rosenberg used in the Klatt synthesizer as the KLGLOTT88 source [36, 37]. Rosenberg has documented the effect of various glottal pulse shapes on listeners' perception of natural voice quality [67], and the main result is that listeners are not significantly receptive to differences in fine time structure of the source shape. A parametric polynomial fit to the shape of the periodic source, the classic Rosenberg pulse, was shown in that study to produce a natural quality when synthesizing vocalic speech sounds. The simplicity of this function and the lack of need to have detailed control over other glottal source parameters were factors in choosing the Rosenberg model (see [9, 17, 18] for more complex forms).
The equation for the Rosenberg model, g(t), of the glottal pulse in continuous time is
t3
t 2 _ t3 ,0<_t<
(OQ -TO)
g(t)
OQ
T (2.7)0,
(OQ
-
0):! t <
Towhere OQ is the open quotient (fraction between 0 to 1) and
To
is the fundamental period in Hz.The waveform is sampled at sampling rate
f,
to yield the discretized waveform, g[n], in Equation(2.1).
As mentioned above, the periodic source is implemented as the derivative of the glottal flow velocity, effectively taking into account the high-pass radiation characteristic. After this radiation characteristic is folded in, the derivative of Equation (2.7) yields the effective excitation to the acoustic filter of the vocal tract. The resulting glottal flow derivative,
g'(t),
is simply3t
22t- ,2 0 <t<
(OQ-
TO)g'() W0 -Q To ,(2.8)
After sampling this waveform at f, the resulting signal is ug'[n]~ ug[n] * rn], an approximation to the derivative of the glottal airflow waveform.
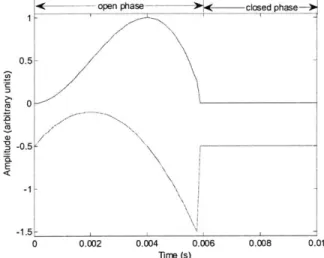
The rationale behind keeping the volume velocity waveform in the block diagram is due to an important assumption in the model that, before vocal tract filtering, the noise source is modulated by the glottal airflow waveform. This implementation differs from the approach of the Klatt synthesizer, in which the aspiration noise is simply modulated by a square wave with duty cycle equal to the open phase duration [36]. To emphasize our assumed coupling between the periodic and aspiration noise source, the periodic excitation is left undifferentiated in the production model of Figure 2.3. A sample glottal airflow waveform and corresponding derivative are shown in Figure 2.4. Arrows indicate open and closed phase portions of the waveform.
< open phase-)-- closed
phase1 -0.5 / 0 -0.5 E < -1 -1.5 0 0.002 0.004 0.006 0.008 0.01 Tirme (s)
Figure 2.4 Glottal airflow velocity waveform. Rosenberg model (top) and its corresponding derivative waveform (bottom) representing the effective periodic input as a pressure source. To = 0.01 s, OQ = 0.6, f,
=
8000 Hz. The waveforms are vertically offset for clarity.
2.3.2
Aspiration Noise Source
The aspiration noise source consists of AC and DC characteristics. The following sections clarify the implementation of these two components.
AC Component
Synthesis assumes that the aspiration noise amplitude is modulated by the area of the glottal opening, which is assumed to be related to the glottal airflow velocity function, ug[n] (Figure 2.4,
top). Thus, concomitant with the volume velocity source due to the periodic vocal fold vibrations is the volume velocity source due to turbulent airflow at the glottis. Using the notation of Equation
(2.3), the aspiration noise source is ug[n], where q[n] represents the aggregate contribution from
all glottal noise sources. We assume that q[n] is from a zero-mean white Gaussian distribution and represents noise sources that occur at several locations around the glottis. Delays between sources are not currently modeled. Figure 2.5 displays a synthesized example of the AC component of the aspiration noise source. The glottal waveform, ug[n], modulates the white Gaussian noise source,
q[n]. The result is the AC component of the aspiration noise source, q[n]ug[n].
2.5 1.5
Li
.. 2. CL 0 E <-0.5 -2 0.2 0.22 0.24 0.26O 0.26 0.3 Tirm (s)Figure 2.5 The AC component of the aspiration noise source. Glottal waveform (top), white Gaussian noise signal (middle), and noise signal modulated by the glottal waveform (bottom). To = 0.01 s, OQ = 0.6, f, = 8000 Hz. The waveforms are vertically offset for clarity.
DC Flow
In the discussion on vocal fold mechanics in Section 2.1, it was concluded that, for constant sound level production, the DC flow simply acts as a vertical offset to the AC waveform with zero offset (recall the bottom signal in Figure 2.5). This is the source signal model implemented in the MATLAB code and illustrated in Figure 2.6. Depending on the choice for the DC synthesis parameter, the glottal waveform is generated and acts as the noise modulation function. Figure 2.7 contrasts an unmodulated noise source with modulated sources with two different DC offsets.
1.2 E 0.8 0.6 0.4 0.2 0 -0.2 0 0.01 0.02 0.03 0.04 0.0s 0.06 Time (s)
Figure 2.6 The DC component of the aspiration noise source. The glottal flow velocity waveform with no DC
flow (dashed line) and DC flow of 0.2 (solid line). To = 0.01 s, OQ = 0.6, fs = 8000 Hz.
0.8 0.6 0.4 0.2 .0 <-0.2 -0.4 -0.6 -0.8 0.8 -0.6 0.2 0 -0.2 -0.6---0.8 0.2 0.22 0.24 Tie()0.2 0.25 O.3 T- (a) (a) 0.2 0.22 0.24 0.24 Thu (8)
(b)
0.28 -0 -0 -0 -0 0.3 .4 - .2-A. -.6 02 7 .2 2 0.2 0.22 02 0.Tim 0.25 (s) (C)Figure 2.7 Generating the modulated aspiration noise source. (a) Unmodulated white Gaussian noise, (b)
noise signal modulated by glottal waveform with no DC flow, and (c) noise signal modulated by glottal waveform with a DC flow of 0.2. To = 0.01 s,
OQ
= 0.6,fs
= 8000 Hz.A
-i
--RA OF 1 0 0 0 0 E4
0.2B 0.32.3.3
Vocal Tract and Radiation Filters
The vocal tract is modeled as a cascade of three second-order filters or, as Klatt refers to them as, "digital formant resonators" [36, 37]. Each of the three digital resonators is in the form (z-domain):
Y(z)
A
X(z)
1-Bz- -CZ
2 whereA=1-B-C,
BW F)B=2e
cos
21r--
,
-2 BWC=-e '
(2.9)and BW is the bandwidth of the formant, F is the formant frequency, and f, is the sampling rate, all in Hz. Multiplication of three of these transfer functions results in the overall transfer function of the desired three-formant vocal tract configuration, with impulse response,
][n].
Formant frequencies and bandwidths used in this study are tabulated in Table 2.1. Although higher formants could have been included, it was decided to only draw from the Peterson and Barney data [62] and reduce complexity for the current analysis.Phonetic Synthesizer Male
Female Symbol Symbol F1 F2 F3 F1 F2 F3 /i/ i 270 2290 3010 310 2790 3310 /e/ e 460 1890 2670 560 2320 2950 /O/ ae 660 1720 2410 860 2050 2850 /a/ a 730 1090 2440 850 1220 2810 /o/ o 450 1050 2610 600 1200 2540 /u/ u 300 870 2240 370 950 2670
Eliminating the need to explicitly indicate the density of air or a distance in Equation (2.5), the digital filter representing the radiation characteristic,
R(z),
is often implemented as a first-difference filter, approximating its high-pass characteristic and is (in the z-domain)R(z)=1-
z-'.
(2.10)
2.3.4
Parameters
Synthesis equations have been developed above for the glottal airflow waveform ug[n], the derivative of the glottal waveform ug'[n], and the aspiration noise source
q[n]
prior to modulation due to the gating effect of vocal fold oscillations. Formulae were also derived for the effect of modulations and DC offsets on the aspiration noise source, as well as for the acoustic filter properties of the vocal tract. Variables for the synthesizer are set by nine synthesis parameters (see Appendix A for list with default values). It is noted that the addition of perturbations such as frequency jitter and amplitude shimmer would form a more complete synthesis system [21, 36, 37,55, 56], especially when modeling disordered speech [10, 40, 51]. The analysis and modification
sections in the following chapters do not include jitter and shimmer parameters; however, their anticipated effects are investigated for future improvements (Section 5.1).
For flexibility, the aspiration noise can either be modulated or unmodulated by the glottal airflow waveform. Six vowels are chosen for investigative purposes. The three formants to be used in the vocal tract resonators of Equation (2.9) are selected by the vowel and the gender parameters, as indicated in Table 2.1. Differences in oral and pharyngeal cavity lengths for males and females correlate with different average formant frequencies [73]. The fundamental frequency parameter, f0, is set for each glottal cycle, and the sampling rate and duration of the vowel are set as desired.
The last three synthesis parameters are DC, OQ, and HNR, which set important attributes of the source signals. DC determines the DC offset on the glottal flow waveform as a fraction of the
AC amplitude. OQ indicates the open quotient during a glottal cycle, defined as the ratio of the
open-phase to closed-phase duration. Finally, the harmonics-to-noise ratio (HNR) sets the ratio of the powers in the harmonic and noise components computed on the signals after filtering by the vocal tract resonances and the radiation characteristic. HNR is defined as
(v[n)2
HNR=10loglo "= , (2.11)
E(u[n])2
B=O
where vfn] is the harmonic component,
u[n]
is the noise component, and L is the signal length. See Appendix A for a list of the vowel synthesizer's parameters and Appendix B for a graphical user interface created for developing code and performing simulations with different test parameters.2.4 Alternative Speech Production Models
The linear source-filter model detailed above, in which the nonlinear modulation is folded into the noise source, is not the only way that one may view the production of voiced speech. Notions of the involvement of non-acoustic components contributing to spectral characteristics of the speech pressure signal were introduced, for example, by Teager [77], further qualitatively evaluated by Kaiser [33], and more recently investigated experimentally by several research groups
[3, 39, 49, 52, 71, 81]. The essence of these models of aeroacoustics in speech production rests on
the existence of concomitant airflows of vortices in the vocal tract and pharyngeal region.
In one study, measurements of velocity and pressure in a simple mechanical model of the vocal folds and vocal tract seem to indicate the presence of such a non-acoustic component at the source of the mechanical model. The non-acoustic source energy, following a transformation to acoustic energy, is shown to contribute to the power spectrum of the output pressure signal [3, 71]. Evidence thus points to the possibility of aerodynamic influences contributing to the source and to formant shaping [77]. Although aerodynamics and other non-acoustic phenomena must be fully accounted for in a complete model of speech production, implementation is computationally
intensive and beyond the scope of this study. The linear source-filter theory provides a flexible paradigm that can be readily adapted for the current study.
2.5 Perception of Aspiration Noise Characteristics
After developing and implementing the vowel synthesizer, it was desired to obtain a flavor for the perceptual salience of different noise characteristics. For this purpose, this section reviews some earlier work as well as our informal evaluation of the perception of these synthesized vowels. In particular, the perceptual experiments performed by Hermes [20] motivated the current preliminary investigation. In his work, Hermes investigates the synthesis of a natural breathy voice quality using an additive model with impulsive and stochastic sources. Hermes documents the perceptual consequences of synthesizing the stochastic source with various characteristics in both the time and frequency domain.
The next three sections briefly investigate time- and frequency-domain characteristics of the aspiration noise source and provides some informal observations of their effect on human perception. Section 2.5.1 comments on differences in perception when the vowel is synthesized either with an unmodulated or modulated noise source. Section 2.5.2 investigates the possible perceptual effects of imposing different modulation functions on the aspiration noise source. Finally, Section 2.5.3 introduces the importance of synchrony between the modulated noise and the periodic excitation, drawing from one of Hermes' experiments [20].
2.5.1
Unmodulated versus Modulated Noise
Hermes investigates the fusion of periodic and noise components when synthesizing breathy
vowels and concludes that noise bursts must
lie
in phase with the glottal pulse excitation formaximum "fusion" with the periodic sound component [20]. References are made to Bregman's theory of auditory scene analysis [5], in which two auditory objects may fuse together only if they both contribute to the overall timbre of the sound. As a consequence, if an unmodulated noise were used for aspiration source synthesis, a percept of two streams may result-one due to the periodic
source and the other due to the unmodulated noise source.
Figure 2.8 displays two synthesized sources illustrating the temporal differences between an unmodulated and modulated noise source. In this example, the modulating function is taken to be
the glottal airflow waveform, although Hermes did not define a specific shape. Section 2.5.2 will present work on comparing the perception of different modulation functions.
1 -0.8 0.8 -0.6 0.6-0.4 0.4-0.2 D0.2 -0.2 -0.2--0.4 -0.4--0.6 -0.6--0.8 _ -0.8 -02 0.2 0.24 0.26 0.28 0.3 0.2 0.22 0.24 0.26 0.28 0.3 Timre (s) Timf (s) (a) (b)
Figure 2.8 The aspiration noise source. (a) Unmodulated white Gaussian noise and (b) noise signal modulated by glottal waveform. Synthesis parameters: fo= 100 (pitch period = 0.01 s), f. = 8000, DC = 0.2, OQ
= 0.6.
In Hermes' work and in our informal listening, after filtering by the vocal tract formants and radiation characteristic, the vowel's noisy part seems to perceptually integrate better with the periodic component when modulated noise is used as the aspiration noise source. These results indicate that modulation may be important for the synthesis of a natural-sounding vowel but do not reveal how best to select the modulation function.
2.5.2
Modulation Functions
Modulation of the noise component in the time domain seems to be perceptually significant and physiologically plausible, a view adopted by many researchers (e.g., [38]). Klatt, however, states that no evidence supports the use of any specific modulation function, as long as a modulation function exists [36-38]. It is desirable to further explore the perception of different modulation functions on the aspiration noise source.
Four different modulation patterns are chosen for study and illustrated in Figure 2.9. The functions are a rectangle, a sinusoid, and a glottal airflow velocity waveform with and without a DC component. Vowels are synthesized with the noise sources modulated by each function. Informal listening indicates that the glottal airflow waveform provides for the most natural synthesis, with a